Ultrasound elastography is a method in diagnostic radiology that uses the response of tissue to external forces (e.g., compression or shear) and analyses the relative changes in their biomechanical dimensions [1]. The techniques of ultrasound elastography vary depending on how they capture tissue deformation, the method of force application, and the type of output produced. These techniques are generally categorised into Strain Elastography (SE), ARFI elastography, and Shear-Wave Elastography (SWE) [1,2]. In the context of TN, these techniques operate on the principle that the biomechanical properties differ between benign and malignant nodules, making TE and its measurements (both qualitative and quantitative) useful biomarkers for identifying malignancy in TN [3,4].
The TI-RADS was proposed as a tool that uses a conglomerate of grey-scale ultrasound parameters to indicate the likelihood of malignancy in a systematic and standardised manner. As suggested by Kwak JY et al., TI-RADS considers five risk factors: the internal composition, markedly hypoechoic nodule, a taller-than-wide shape, the presence of microlobulated or irregular margins, and the presence of microcalcifications [5]. In May 2017, a white paper from the ACR TI-RADS committee was published on the ACR TI-RADS [6]. As per this system, different scores are assigned to the various components of the five risk factors in the nodule, and risk stratification is performed based on the total score of the nodule.
ARFI imaging for the detection of malignant nodules is being increasingly adopted in clinical practice [7,8]. It is based on the principle that malignant nodules are likely to be harder than benign nodules. This is achieved through two methods: a qualitative method called VTi and a quantitative method known as VTq. Several studies have indicated that there are benefits to using ARFI in detecting malignant TNs [7-9].
To improve diagnostic accuracy, reliability and prognostic prediction, it is proposed to combine more than one method with TE, such as using predictors of malignancy like ACR TI-RADS alongside TE [6]. However, TE itself serves as a standalone tool when considering the latest Bethesda classification for predicting malignant nodes [10].
Several studies have used the combination of ACR-TI-RADS with various types of TE techniques in an attempt to differentiate between malignant and benign TNs and to predict the risk stratification of TNs [11-15]. Recently, there has been an increasing number of patients undergoing screening for malignant TNs. While advancements have been made in the methods of TE for differentiating malignant nodules, there still seem to be some gaps. A recent study concluded that ACR-TI-RADS is a useful tool for the risk stratification of TNs, but it pointed out that the current dimensional thresholds can lead to an underestimation of malignant lesions. Additionally, a lack of a consensus statement from standard governing bodies regarding the use of TE was reported [4,10]. Thus, authors conducted a study on the diagnostic performance of TI-RADS and ARFI in the detection of malignant TNs. Authors attempted to derive cut-offs for TE parameters using ROC analysis. Sensitivity, specificity, PPV and NPV were calculated based on these cut-offs. Binary logistic regression analysis was also performed to identify factors associated with false positive and false negative findings.
Materials and Methods
A cross-sectional study was conducted in the Department of Radiodiagnosis, the Department of Pathology, and the Department of Surgery at JIPMER, Puducherry, India, from January 2015 to June 2017. The study was approved by the Institute’s Ethical Committee (IEC), JIPMER, Pondicherry (JIP/IEC/SC/2014/8/648).
Inclusion criteria: Patients who were referred to the Department of Radiodiagnosis with TNs greater than 10 mm in diameter on ultrasound were included in the study.
Exclusion criteria: Patients with pure anechoic cystic nodules, nodules smaller than 1 cm, or those without nodules were excluded from the study.
Sample size determination: A sample size of 250 was calculated using a nomogram [16] with a sensitivity of 86% (the lowest) as per the study by Zhang YF et al., [17]. Additionally, the prevalence of malignancy was set at 20% based on a preliminary analysis of data from FNAC and biopsy reports from the previous year, with an absolute precision of 10%.
Study participants: Participants were recruited through consecutive systematic sampling.
All eligible patients were briefly informed about the procedure they would undergo after their socio-demographic data had been collected on a predetermined proforma. The methodology involved imaging (Ultrasound+ARFI), collection of histopathology reports (nodal FNAC/Biopsy), and lesion scoring according to the TI-RADS.
Ultrasound evaluation: The ultrasound examination was conducted using an S3000 ultrasound machine (Siemens Medical Solutions, Mountain View, CA, USA), equipped with a linear array transducer (9L4, Siemens) operating at a frequency of 9 MHz. The procedure involved placing patients in a supine position with their neck exposed, followed by the recording of routine greyscale and Doppler imaging (for vascular pattern). SWE was then performed using ARFI. The following data were collected for each TN during the greyscale examination: (1) internal composition (cystic, mixed cystic and solid, solid); (2) echogenicity (hyperechoic, isoechoic, hypoechoic, marked hypoechogenicity); (3) shape (wider than tall, taller than wide); (4) margins (regular, irregular); (5) echogenic foci (microcalcifications appearing as stippling less than 2 mm, egg-shell rim calcification, macrocalcification, absence of calcification) [Table/Fig-1,2a]. A TI-RADS score was assigned based on these features as per the system proposed by Kwak JY et al., [5].
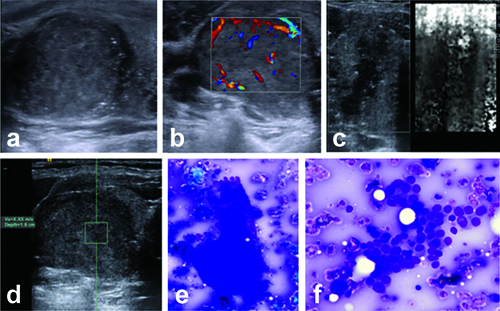
Grayscale, ARFI imaging profile of nodule with papillary carcinoma. Ultrasound of right thyroid nodule (a and b), shows hypoechoic nodule with irregular margins internal microcalcifications and vascularity pattern III ARFI VTi image shows Grade III pattern (c) and ARFI VTq image shows mean shear wave velocity X.XX m/s (d). FNAC shows (e and f) classic papillary cluster (May-Grunwald- Giemsa stain X200) and neoplastic cell cluster showing an occasional intranuclear inclusion (MGG X400).
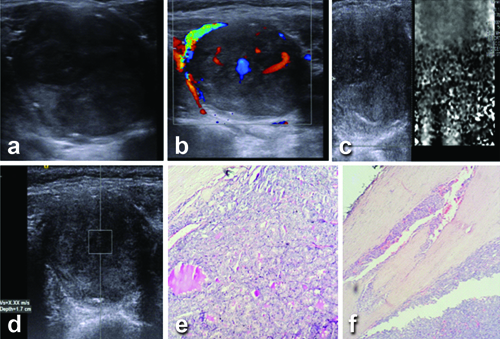
Grayscale, ARFI imaging profile of nodule with follicular carcinoma. Ultrasound of left thyroid nodule (a and b) shows irregular marked hypoechoic nodule with internal vascularity (Pattern III). ARFI VTi image shows Grade IV pattern (c) and ARFI VTq image shows mean shear wave velocity X.XX m/s (d). Histological section (e and f) shows follicular thyroid carcinoma (H&E X200); same case showing capsular invasion (H&E X400).
According to this system, the nodule was categorised as TI-RADS 1 when there were no nodules, TI-RADS 2 when it was a definite benign nodule, and TI-RADS 3 when it exhibited no suspicious features. The nodule was classified into TI-RADS 4a, 4b, or 4c categories when there was one, two, or three/four suspicious factors, respectively. When all five suspicious factors were present, a TI-RADS 5 category was ascribed. The size and volume of the nodule, the presence of a peripheral halo around the lesion, extrathyroidal extension of the nodule, and the presence of significant cervical nodes were also recorded. The pattern of vascularity inside the nodule was described as one of the following: pattern I (avascularity), pattern II (presence of vascularity in at least 25% of the circumference surrounding the nodule), or pattern III (marked intrinsic vascularity, with flow in the central part of the nodule greater than the flow in the surrounding parenchyma) [Table/Fig-1b,2b] [8,18].
ARFI evaluation: VTi and VTq were scored for all patients [Table/Fig-1c,d,2c,d]. Patients were asked to hold their breath while VTi was performed and scored according to established standards [8]. {Grade I: white or white honeycomb; Grade II: light or light grey, similar to the surrounding soft tissue; Grade III: dark grey or only a small number of white dots; Grade IV: absolutely black}. VTq was performed by placing the ROI on the nodule. The mean SWV was displayed in m/sec. For values above 9 m/sec, “X.XX” m/sec was displayed. According to manufacturer recommendations, if the lesion was solid, this value was recorded as 9 m/sec. The mean of three readings (taken by a single observer) was considered the VTq velocity of the nodule.
FNAC (according to the Bethesda system [10]) or biopsy was conducted for all screened nodules after the ultrasound examination. TI-RADS grading, as per the white paper of the ACR TI-RADS committee, was scored [3,6]. As per these guidelines, points were assigned to five ultrasound components: (a) Composition: cystic, almost completely cystic, or spongiform (0 points), mixed cystic-solid (1 point), and solid or completely solid (2 points); (b) Echogenicity: anechoic (0 points), hyperechoic or isoechoic (1 point), hypoechoic (2 points), very hypoechoic (3 points); (c) Shape: wider than tall (0 points), taller than wide (3 points); (d) Margin: smooth or ill-defined (0 points), lobulated or irregular (2 points), extra-thyroidal extension (3 points); (e) Echogenic foci: none or large comet tail artefacts (0 points), macrocalcification (1 point), rim calcification (2 points), punctate echogenic foci (3 points). Zero points were categorised as TI-RADS 1, 2 points as TI-RADS 2, 3 points as TI-RADS 3, 4 to 6 points as TI-RADS 4, and nodules with 7 or more points as TI-RADS 5.
Histological/cytopathological results of each nodule were compared with ultrasonographic and ARFI imaging findings [Table/Fig-1e,f,2e,f].
Statistical Analysis
The data were analysed using the Statistical Package for the Social Sciences (Version 24.0, SPSS Inc., Chicago, IL, USA). Ultrasound features in benign and malignant nodules were compared using the Chi-square test for categorical variables and the Mann-Whitney U test for continuous variables. ROC curves were plotted for the total score according to Kwak, the total number of points as per the ACR committee white paper, and the mean SWV of VTq, with the best cut-off obtained for each. Sensitivity, specificity, PPV, and NPV were calculated based on these cut-offs. Binary logistic regression analysis was conducted to identify factors associated with false positive and false negative VTq findings. A univariate analysis was performed first, and only statistically significant variables were included in the binary logistic regression model. The binary logistic regression was carried out using the forward stepwise selection method (likelihood ratio).
Results
A total of 260 nodules were studied using conventional grey scale ultrasound, colour Doppler, and ARFI (VTi and VTq) imaging protocols. Of these, 255 nodules were included in this study (5 nodules were excluded; three showed inconclusive FNAC results, and two did not undergo FNAC/biopsy).
The study population consisted of 204 (80%) histologically proven benign nodules and 51 (20%) malignant nodules. The mean age of the patients was 42.77±13.7 years (minimum 18, maximum 84). There were 206 females and 49 males [Table/Fig-3].
Comparison of demographic data and ultrasound findings in patients with thyroid nodules.
| Parameters | | Benign nodules n=204 (%) | Malignant nodules n=51 (%) | p-value |
|---|
| Mean age±SD (years) | 41.9±12.9 | 46.1±16.4 | 0.095* |
| Gender | Male | 32 (15.7) | 17 (33.3) | 0.003 |
| Female | 172 (84.3) | 34 (62.7) |
| Ultrasound features |
| Volume of the nodule | Mean volume in mm3 | 2100 | 4903.5 | 0.002* |
| 25th, 75th percentile | 896.3-4986.6 | 2559.1-12100.1 |
| Internal component | Cystic | 1 (0.5) | 0 | 0.012 |
| Solid and cystic | 172 (84.3) | 51 (100) |
| Solid | 31 (15.2) | 0 |
| Echogenicity | Hyperechoic | 5 (2.45) | 2 (3.9) | <0.001 |
| Isoechoic | 30 (14.7) | 1 (2) |
| Hypoechoic | 164 (80.4) | 20 (39.2) |
| Marked hypoechoic | 5 (2.45) | 28 (54.9) |
| Shape | Wider than tall | 202 (99) | 15 (29.4) | <0.001 |
| Taller than wide | 2 (1) | 36 (70.6) |
| Margins | Smooth | 174 (85.3) | 8 (15.7) | <0.001 |
| Irregular | 29 (14.2) | 15 (29.4) |
| Extrathyroidal extension | 1 (0.5) | 28 (54.9) |
| Calcifications | None | 118 (57.8) | 10 (19.6) | <0.001 |
| Macrocalcification | 65 (31.9) | 8 (15.7) |
| Peripheral rim | 19 (9.3) | 1 (2) |
| Microcalcification | 2 (1) | 32 (62.7) |
| Peripheral halo | Present | 159 (77.9) | 4 (7.8) | <0.001 |
| Absent | 45 (22.1) | 47 (92.2) |
| Cervical nodes | Present | 7 (3.4) | 30 (58.8) | <0.001 |
| Absent | 197 (96.6) | 21 (41.2) |
| Doppler vascularity | Peripheral | 192 (94.1) | 10 (19.6) | <0.001 |
| Central | 12 (5.9) | 41 (80.4) |
p-value indicates Chi-square test unless specified, *indicated Mann-Whitney U test
As per the ACR TI-RADS system, 19 benign nodules and 45 malignant nodules were categorised as TI-RADS 5, respectively. There was a significant difference (p-value <0.05) in the VTi grade between benign and malignant nodules. Additionally, there was a significant difference (p-value <0.05) in the mean SWV of the nodules between the malignant and benign groups [Table/Fig-4].
Comparison of TI-RADS (ACR), TI-RADS (Kwak) and ARFI findings in benign and malignant nodules.
| Variables | Benign nodules (n=204) | Malignant nodules (n=51) | p-value |
|---|
| TI-RADS (ACR) |
| TI-RADS 1 (0 points) | 0 | 0 | <0.001 |
| TI-RADS 2 (2 points) | 2 (1) | 0 |
| TI-RADS 3 (3 points) | 24 (11.8) | 1 (2) |
| TI-RADS 4 (4 - 6 points) | 159 (77.9) | 5 (9.8) |
| TI-RADS 5 (7 or more points) | 19 (9.3) | 45 (88.2) |
| TI-RADS (Kwak et al.,) |
| TI-RADS 3 (no suspicious features) | 0 | 0 | <0.001 |
| TI-RADS 4a (one suspicious feature) | 31 (15.2) | 1 (2) |
| TI-RADS 4b (two suspicious features) | 144 (70.6) | 4 (7.8) |
| TI-RADS 4c (three or four suspicious features) | 29 (14.2) | 24 (47.1) |
| TI-RADS 5 (all five suspicious features) | 0 | 22 (43.1) |
| ARFI imaging |
| Virtual touch imaging | <0.001 |
| Grade 1 | 11 (5.4) | 1 (2) |
| Grade 2 | 183 (89.7) | 5 (9.8) |
| Grade 3 | 9 (4.4) | 27 (52.9) |
| Grade 4 | 1 (0.5) | 18 (35.3) |
| Virtual touch quantification |
| Mean shear wave velocity of the nodule (m/sec) | 2.13±1.1 | 7.92±2.5 | <0.001* |
| Mean shear wave velocity of the perinodular normal thyroid (m/sec) | 1.8±0.68 | 1.9±0.67 | 0.173* |
p-value indicates Chi-square test unless specified, *Indicated Mann-Whitney U test
Among the benign pathological types, the average mean SWV was lowest for nodular goitre with follicular hyperplasia and highest for Hashimoto’s thyroiditis. Among the malignant pathological types, the average mean SWV was lowest for micropapillary carcinoma, followed by the follicular variant of papillary carcinoma of the thyroid [Table/Fig-5]. The highest velocity of 9 m/sec was recorded in 19 out of 23 (82.6%) patients with papillary carcinoma of the thyroid, 9 out of 13 (69.2%) patients with the follicular variant of papillary carcinoma of the thyroid, 6 out of 8 (75%) patients with medullary carcinoma of the thyroid, and 2 out of 3 (66.7%) patients with follicular carcinoma of the thyroid. An SWV of 9 m/sec was also recorded in one patient each with diffuse large B cell lymphoma, anaplastic carcinoma, and a combined classical and follicular variant of papillary carcinoma of the thyroid.
ARFI findings, mean ACR points for TI-RADS and mean Kwak score for TI-RADS in pathological types of benign and malignant hyoid nodules.
| Mean shear wave velocity (m/sec) | Virtual touch imaging grade | Mean ACR points
(out of 14) | Mean Kwak score
(out of 5) |
|---|
| 1 | 2 | 3 | 4 |
|---|
| Benign (204) |
| Nodular colloid goitre (n=133) | 1.93±0.7 | 9 | 119 | 4 | 1 | 4.63±1.2 | 2.02±0.6 |
| Nodular goitre with follicular hyperplasia (n=16) | 1.71±0.5 | 1 | 14 | 1 | 0 | 4.29±0.7 | 1.76±0.4 |
| Hyperplastic nodule/adenomatoid nodule/nodular goitre with Hurthle cell change (n=19) | 2.28±1.4 | 0 | 19 | 0 | 0 | 4±0.9 | 2±0.5 |
| Hashimoto’s thyroiditis (n=35) | 2.98±1.8 | 1 | 30 | 4 | 0 | 4.69±1.4 | 2±0.6 |
| Follicular adenoma (oncocytic variant) (n=1) | 2.38 | 0 | 1 | 0 | 0 | 5 | 2 |
| Malignant (51) |
| Papillary carcinoma thyroid (n=23) | 8.45±1.8 | 0 | 2 | 16 | 5 | 11.35±2.3 | 4.26±0.7 |
| Follicular variant of papillary carcinoma thyroid (n=13) | 6.8±3.6 | 1 | 2 | 6 | 4 | 10.69±3.7 | 4.08±1.3 |
| Medullary carcinoma (n=8) | 8.46±1.3 | 0 | 0 | 4 | 4 | 11.38±2.7 | 4.25±1 |
| Follicular carcinoma (n=3) | 6.81±3.9 | 0 | 1 | 0 | 2 | 8.67±4.7 | 3.33±1.5 |
| Diffuse large B-cell lymphoma (n=1) | 9.0 | 0 | 0 | 0 | 1 | 11 | 4 |
| Anaplastic carcinoma (n=1) | 9.0 | 0 | 0 | 0 | 1 | 6 | 2 |
| Classical and follicular variant of papillary carcinoma (n=1) | 9.0 | 0 | 0 | 0 | 1 | 13 | 5 |
| Micropapillary carcinoma (n=1) | 5.93 | 0 | 0 | 1 | 0 | 10 | 4 |
ROC curves were plotted for mean SWV, Kwak score, and ACR points. The Area Under the Curve (AUC) for mean SWV was 93.3% (SE 2.7%, 95% CI 87.9%- 98.7%, p<0.001). The AUC for the Kwak score was 93.5% (SE 2.7%, 95% CI 88.3%- 98.7%, p<0.001). The AUC for the ACR score was 95.3% (SE 2.3%, 95% CI 90.8%-99.7%, p<0.001). Based on the ROC curves, the best cut-off to differentiate between benign and malignant nodules was 3.4 m/sec for mean SWV. The ROC cut-offs for mean SWV, ACR points, and Kwak score, along with their corresponding sensitivity, specificity, PPV, and NPV, are provided in [Table/Fig-6].
Diagnostic performance of Shear wave velocity, ACR TI-RADS and Kwak TI-RADS in the diagnosis of thyroid malignancy.
| ROC cut-off | | Sensitivity (%) | Specificity (%) | PPV (%) | NPV (%) | Diagnostic accuracy |
|---|
| SWV (3.4 m/sec) | | 88.2 | 92.2 | 73.77 | 96.91 | 0.91 |
| (95% CI) | 76.1-95.6 | 87.6-95.5 | 63.5-82 | 93.7-98.5 | 0.85-0.95 |
| ACR 6 points | | 94.1 | 82.8 | 57.83 | 98.26 | 0.85 |
| (95% CI) | 83.8-98.8 | 77-87.8 | 50.2-65.1 | 95-99 | 0.78-0.90 |
| ACR 7 points (TI-RADS 5) | | 88.2 | 90.7 | 70.3 | 96.9 | 0.90 |
| (95% CI) | 76.1-95.6 | 85.84-94.3 | 60.4-78.6 | 93.6-98.5 | 0.84-0.95 |
| Kwak 3 points (TI-RADS 4c) | | 90.2 | 85.8 | 61.3 | 97.2 | 0.87 |
| (95% CI) | 78.6-96.7 | 80.2-90.3 | 52.8-69.2 | 93.8-98.8 | 0.80-0.92 |
| Kwak 4 points (TI-RADS 4c) | | 80.4 | 99.5 | 97.7 | 95.3 | 0.95 |
| (95% CI) | 66.9-90.2 | 97.3-99.9 | 85.2-99.7 | 92.1-97.3 | 0.91-0.97 |
Binary logistic regression showed that the mean SWV of the perinodular normal thyroid (β: 0.954, OR: 2.595, CI: 1.208-5.574, p-value=0.014) and the margins of the nodule (β: 1.512, OR: 4.535, CI: 1.461-14.081, p-value=0.009) were independent risk factors associated with false positive findings [Table/Fig-7]. Similarly, binary logistic regression showed that the total number of suspicious factors according to Kwak (β: 1.753, OR: 5.773, CI: 1.859-17.93, p-value=0.002) was an independent risk factor for false negative findings [Table/Fig-7]. The six malignant nodules that exhibited false negative findings were from four patients with follicular variant of papillary carcinoma, one patient with a follicular neoplasm, and one patient with papillary carcinoma of the thyroid.
Factors associated with false positive and false negative diagnosis of thyroid nodules.
| Statistical type | Variable | Coefficient (β) | Odds Ratio (OR) | Confidence Interval (CI) | p-value |
|---|
| Univariate analysis | Echogenicity | 1.2 | 0.30 | 0.15-0.60 | <0.001 (FN) |
| Shape | 1.5 | 0.22 | 0.10-0.50 | 0.002 (FN) |
| Presence of calcifications | 0.75 | 2.11 | 1.02-4.35 | 0.046 (FN) |
| Kwak score | 1.1 | 3.00 | 1.2-7.50 | 0.014 (FP) |
| ACR points | 0.85 | 2.34 | 1.12-4.90 | 0.026 (FP) |
| Margins | 1.8 | 6.05 | 2.50-14.50 | <0.001 (FP) |
| Binary logistic regression | Total number of suspicious factors (Kwak) | 1.753 | 5.773 | 1.859-17.930 | 0.002 (FN) |
| Mean SWV of perinodular normal thyroid | 0.954 | 2.595 | 1.208-5.574 | 0.014 (FP) |
| Margins of the nodule | 1.512 | 4.535 | 1.461-14.081 | 0.009 (FP) |
FN: False negative; FP: False positive; p-value indicates univariate or binary logistic regression analysis as indicated in table
Discussion
The current study compared the diagnostic performance of ARFI with TI-RADS scoring systems, along with the evaluation of factors associated with false positive and false negative findings in benign and malignant TNs, respectively. A recent meta-analysis showed a strong correlation between rising TN prevalence and older age, female sex, and elevated weight. The overall prevalence of TN was estimated to be 24.83% [19]. In the Indian context, 92.2% of TNs turned out to be neoplastic lesions, as per a study highlighting the importance of early diagnosis [20]. Female predominance in the OPD census in terms of reporting, diagnosis, and prevalence is common both globally and in India [19,20].
Zhang YF et al., reported that the mean SWV values of benign and malignant TNs were 2.57±0.79 m/s and 3.88±2.24 m/s, respectively, with significant intergroup differences [21]. This aligns with the findings of the current study. The same study reported that the accuracy of the VTi elastography score was higher for hypoechoic nodules, particularly in cases of an absent halo and type III vascularity. A VTi elastography score ≥4 and SWV >3.10 m/s are independent risk factors for predicting thyroid cancers, as per their reports [21].
The current findings compared the accuracy of diagnostic methods rather than the contribution of each TE parameter. Significant differences were found in echogenicity, margins, Kwak score, and ACR points between malignant and benign TNs.
A recent study also attempted to evaluate the diagnostic value of the ACR score and TI-RADS for benign nodules, Medullary Thyroid Carcinoma (MTC), and Papillary Thyroid Carcinoma (PTC) by comparing them with Kwak TI-RADS [22]. As per the study, the ACR score performed the best in discriminating between patients with malignant nodules and benign nodules, as well as between patients with MTC and PTC [22]. In present study, the AUC values of ACR TI-RADS, ARFI mean SWV, and Kwak TI-RADS for distinguishing malignant nodules from benign nodules were 0.953 (95% CI: 0.908-0.997), 0.933 (95% CI: 0.879-0.987), and 0.935 (95% CI: 0.883-0.987), respectively.
Present study analysed the cases where malignancies were missed by ACR-TI-RADS. It was found that most were papillary carcinoma (45%) and follicular variant of papillary carcinoma (25.5%). These are soft lesions, and ARFI was also unable to adequately diagnose them. The disadvantage of ACR TI-RADS may be that it is slightly more cumbersome than the simpler Kwak 5-point system. A more recent study conducted on TNs from a southern Indian patient sample showed a sensitivity of 25% and specificity of 75%, with an odds ratio of 0.90 for TI-RADS diagnosing malignant nodules [23]. The shape of a nodule being taller than wider is reported with a specificity of 92.3%, while punctate echogenic foci have a specificity of 76.9% in this study [23].
Azizi G et al., found that the NPV of ARFI was better than the PPV; however, the PPV of ARFI was better than that of the B-mode criteria for hypo echogenicity [24]. Likewise, Gu J et al., found that ARFI had high sensitivity and specificity in evaluating benign and malignant nodules when using a cut-off value of 2.55 m/s [25]. Sporea I et al., reported that the optimal cut-off value for predicting diffuse thyroid pathological abnormality with ARFI was 2.36 m/s, which had a sensitivity of 62.5%, specificity of 79.5%, PPV of 87.6%, NPV of 55.5%, and accuracy of 72.7% [26].
Present study findings indicate that TI-RADS has higher sensitivity, while the ATA guidelines show superior specificity, PPV, and accuracy. In a study by Gao L et al., it was observed that for nodules larger than 1 cm, KWAK-TI-RADS provided better diagnostic efficiency than both ACR TI-RADS and ATA guidelines. However, for nodules of 1 cm or smaller, there was no significant difference in diagnostic efficiency among these three guidelines [27]. Similarly, Xu T et al., compared various TI-RADS systems and found that Korean TI-RADS exhibited the highest specificity, whereas ACR-TI-RADS achieved the highest sensitivity [28].
In terms of FNAB criteria, recent data highlight that ACR-TI-RADS minimises the rate of unnecessary FNABs while maximising the detection rate of malignancies through FNAB. Present study’s results are consistent with these findings, supporting the notion that each TI-RADS system has unique strengths based on nodule size and diagnostic focus. These differences emphasise the importance of tailoring the choice of guidelines to specific clinical needs, as each system contributes distinct advantages to TN assessment [27,28].
The strengths of present study include a uniform study protocol, rigorous ultrasound risk factor evaluation, a large number of single-centre patients, and histopathological confirmation of TNs.
Limitation(s)
The ACR-TI-RADS scoring was conducted using recorded static images, which may have resulted in misdiagnoses according to TI-RADS. Additionally, the present study showed an underrepresentation of benign follicular adenomas.
Conclusion(s)
Kwak, ACR-TI-RADS, and ARFI have shown good performance in predicting thyroid malignancy. Furthermore, the combination of TI-TI-RADS scoring systems with ARFI can be useful in making more personalised and optimised management decisions for clinicians. Furthermore, multicentre prospective studies are crucial for validating and refining this combined approach, setting the stage for more effective, evidence-based care in the assessment of TNs.
p-value indicates Chi-square test unless specified, *indicated Mann-Whitney U test
p-value indicates Chi-square test unless specified, *Indicated Mann-Whitney U test
FN: False negative; FP: False positive; p-value indicates univariate or binary logistic regression analysis as indicated in table