Burnout is a psychological syndrome characterised by overwhelming physical and mental exhaustion, feelings of cynicism or detachment from one’s job, a sense of ineffectiveness, and a feeling of lack of accomplishment, leading to decreased professional efficacy [1,2]. According to the World Health Organisation (WHO), burnout is included in the 11th revision of the International Classification of Diseases (ICD-11) as an occupational phenomenon and is not classified as a medical condition [1]. The concept of “burnout” was first introduced by Freudenberger and Maslach in the 1970s after studying similar psychosocial reactions among individuals involved in ‘people work’ [3,4].
Later, a five-year prospective intervention study, known as the PUMA study, was conducted to map the extent of burnout and identify workplace factors associated with increased burnout. The study among members of the human service sectors in Denmark revealed high work-related and client-related burnout among midwives and homecare providers. The highest level of client-related burnout was found among prison guards. On both scales, office assistants and supervisors scored poorly. Work-related burnout was further shown to have significant correlations with role conflicts, emotional demands, quantitative demands and job satisfaction [5].
Due to changing workplaces and technological demands, resident physicians are becoming increasingly burned out. Demanding schedules, the dual nature of residency (both training and education), excessive workloads, a lack of resources and an inclination toward electronic media are some factors that contribute to the high occurrence of burnout [6,7]. Burnout affects quality of life, raises the risk of illness and has psychological effects [8-11]. Major medical errors have been linked to higher rates of burnout among American surgeons in a study by Shanafelt TD et al., [12]. Given the substantial number of deaths attributable to medical errors in India, research identifying the correlation between burnout and medical errors is essential [13,14]. Burnout rates worsened due to Coronavirus Disease 2019 (COVID-19) [15]. Additionally, violence against doctors adds to the existing burden, which is weakening healthcare throughout India [16].
There are a significant number of studies that have investigated the prevalence of burnout among resident doctors [6-8,11,12,14]. In contrast to earlier studies on resident burnout [15,17,18], which predominantly focused on prevalence, this study aimed to understand nearly all the elements associated with burnout. It further adds to the pool of data related to burnout, especially in emergency settings like those encountered during COVID-19. The primary objective of this study was to assess the prevalence of occupational burnout among resident doctors across different specialties at a tertiary care centre in India during the pandemic. This study also aimed to identify factors contributing to occupational burnout among resident doctors in the same setting.
The null hypothesis posited that there was no significant prevalence of occupational burnout among resident doctors across different specialties at a tertiary care centre in India during the pandemic (prevalence ≤50%) and that there was no significant association between the identified socio-demographic and occupational factors and burnout among resident doctors. The alternative hypothesis stated that there was a significant prevalence of occupational burnout among resident doctors across different specialties at a tertiary care centre in India during the pandemic era (prevalence >50%) and that there was a significant correlation between the identified socio-demographic and occupational factors and burnout among resident doctors.
Materials and Methods
This cross-sectional study was conducted at a tertiary healthcare institute in Central Kerala, India which, being a medical college hospital, also hosts a nursing college, allied health sciences, and its own research institute. The institute has all the departments of various medical and surgical specialties, as well as super specialty departments. The duration of the study was four months, from September 2021 to January 2022. The study commenced after obtaining ethical clearance from the Institutional Ethics Committee (IEC) (IEC 21/20/IEC/JMMC&RI).
Inclusion criteria: Residents with a basic MBBS degree and those from clinical departments, including radiodiagnosis and transfusion medicine, were included in the study. Clinical departments are those where significant doctor-patient interaction occurs—examination and/or treatment takes place.
Exclusion criteria: Medical students and other medical professionals without a basic MBBS degree, residents not willing to provide consent, surveys returned with incomplete data, and residents of non clinical departments (not contributing to patient care—microbiology, pathology, pharmacology, forensic medicine, physiology, community medicine, anatomy and biochemistry) were excluded from participating in the study.
Sample size estimation: A randomised convenience sampling technique was utilised for sample size selection and data collection. The sample size was calculated using the formula 3.84pq/D2 based on a previous study among German practitioners that recorded a prevalence of burnout at 7.5%. The required sample size came to 106.56 and was rounded to an estimate of 110 resident doctors [17]. The study population included 114 residents, both junior and senior, holding MBBS, MD, and DM degrees and thus included doctors in the age group of 24 to 55 years.
Variables and measures: The CBI was used to assess the prevalence of burnout, as it is easy to comprehend, convenient and freely available. It is a validated 19-item questionnaire divided into three scales: personal burnout (6 items), work-related burnout (7 items), and patient-related burnout (6 items). Each question has five options, and a numerical value is assigned to each option (never - 1 - scoring 0%, seldom - 2 - scoring 25%, sometimes - 3 - scoring 50%, often - 4 - scoring 75%, always - 5 - scoring 100%). Scores are calculated at the end to assess the prevalence of burnout [4,19]. Burnout scores are calculated and categorised into mild (<50), moderate (50-74), high (75-99) and severe (100) [4,19]. Possible factors were identified through an extensive literature search and compiled into a checklist [6,8,18,20-24]. Demographic details, including name, age, sex, family structure, residents’ specialties, experience, emergency duties in the past month and negative life events in the past year, were also collected.
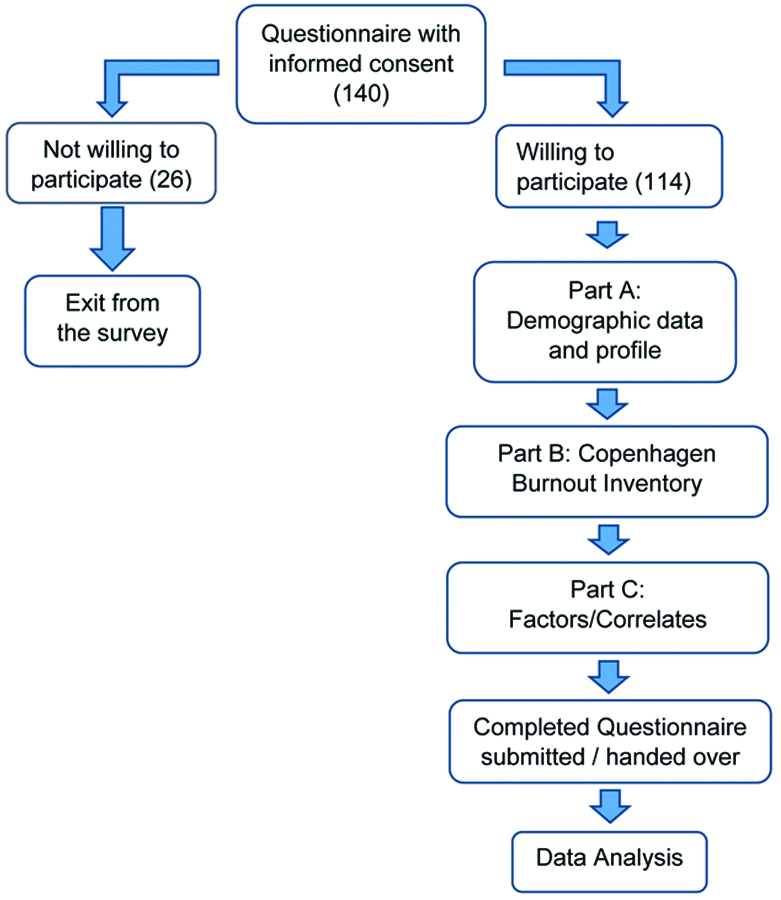
The survey was sent once a week for four consecutive weekends, and reminders were sent thereafter for up to four weeks. Any identifying information was delinked and confidentiality was maintained throughout the study. The questionnaire was handed over or sent by mail to 140 resident doctors, taking into consideration a non response rate of 20%, working in the institute either in printed form or electronically as a Google form, with informed consent. Participation was voluntary, with an option to opt out of the survey at any time. Only completed surveys with the required consent to participate were included in the study [Table/Fig-1].
Data collection tools and techniques.
Statistical Analysis
The data from the completed questionnaires were entered into Microsoft Excel 2007 and analysed using IBM SPSS version 25.0. Descriptive and inferential statistics were employed to analyse the data. The frequency and percentage of all independent variables were calculated. The mean and standard deviation were computed for the continuous variables. The differences in mean scores of occupational burnout among the categories of selected variables were measured using an Independent t-test and one-way Analysis of Variance (ANOVA). The differences in mean scores of burnout among residents who reported the presence or absence of selected factors were analysed using an independent t-test. The significance level was set at p<0.05.
Results
The questionnaire was sent to 140 resident doctors, out of which 114 responded with complete questionnaires (response rate: 81.4%). Ten respondents returned with incomplete data, while 16 did not respond at all. Of the 114 residents who participated in the study, 87 (76.3%) were between the ages of 25 and 30 years, with a mean age of 28.01±4.24 years. Nearly equal percentages of married and single participants made up the sample, which was predominantly composed of women (n=70, 61.4%) [Table/Fig-2].
Distribution of demographic characteristics of resident doctors (n=114).
| Characteristics | Categories | n (%) |
|---|
| Age (years) | <25 | 17 (14.9) |
| 25-30 | 87 (76.3) |
| >30 | 10 (8.8) |
| Sex | Female | 70 (61.4) |
| Male | 43 (37.7) |
| Others | 1 (0.9) |
| Marital status | Married | 56 (49.1) |
| Unmarried | 58 (50.9) |
| Family structure | Joint | 13 (11.4) |
| Nuclear | 101 (88.6) |
| Experience (years) | <1 | 12 (10.5) |
| 1-2 | 63 (55.3) |
| >2 | 39 (34.2) |
| Years of residency | <1 | 8 (7.0) |
| 1-2 | 61 (53.5) |
| >2 | 45 (39.5) |
| Emergency duties in previous month | <5 | 76 (66.7) |
| 5-10 | 33 (28.9) |
| >10 | 5 (4.4) |
| Negative life events in past year | No | 85 (74.6) |
| Yes | 29 (25.4) |
| Average hours of sleep | <6 | 26 (22.8) |
| ≥6 | 88 (77.2) |
| Average hours of work per day | <8 | 20 (17.5) |
| 8-12 | 79 (69.3) |
| >12 | 15 (13.2) |
Using the CBI, this study investigated burnout among medical residents, revealing significant new insights about stress in the workplace. With notable variations in the personal, work-related and patient-related dimensions, 75 (65.8%) of the 114 participants reported experiencing moderate total burnout [Table/Fig-3]. Empirical evidence suggests that 100% of the research population, although the intensity varied, exhibited signs of burnout.
Levels of CBI subscales (n=114).
| Subscales | Mild (<50) | Moderate (50-74) | High (75-99) | Severe (100) | Mean±SD |
|---|
| n (%) | n (%) | n (%) | n (%) |
|---|
| Personal burnout | 8 (7.0) | 47 (41.2) | 51 (44.7) | 8 (7.0) | 20.61±4.67 |
| Work-related burnout | 17 (14.9) | 72 (63.2) | 22 (19.3) | 3 (2.6) | 15.18±4.11 |
| Patient-related burnout | 47 (41.2) | 48 (42.1) | 16 (14.0) | 3 (2.7) | 12.61±4.57 |
| Total burnout | 20 (17.5) | 75 (65.8) | 18 (15.8) | 1 (0.9) | 48.27±10.71 |
Factors associated with burnout, identified through an extensive literature search, were consolidated into a checklist and observed in the participants. Out of 114, 67 (58.8%) indicated a need for perfectionism in their day-to-day tasks. Ninety-four (82.5%) reported feeling lonely, while 86 (75.4%) felt inadequacy in the support systems available. Approximately half of the participants (54, 47.4%) had to attend frequent call duties, and more than half (69, 60.5%) reported having long working hours. Around half (62, 54.4%) spent time at home on work-related matters [Table/Fig-4].
Frequency distribution of factors influencing the occupational burnout among resident doctors.
| Factors | Response | n (%) |
|---|
| Perfectionism | No | 47 (41.2) |
| Yes | 67 (58.8) |
| Lonely feeling | Yes | 94 (82.5) |
| No | 20 (17.5) |
| Lack of adequate support system | Yes | 86 (75.4) |
| No | 28 (24.6) |
| Face discrimination/harassment | No | 86 (75.4) |
| Yes | 28 (24.6) |
| Short tempered | No | 74 (64.9) |
| Yes | 40 (35.1) |
| Educational or personal debts | No | 72 (63.2) |
| Yes | 42 (36.8) |
| Drugs for illness related to mental health | No | 112 (98.2) |
| Yes | 2 (1.8) |
| Motor vehicle accident incidents in the past year | No | 101 (88.6) |
| Yes | 13 (11.4) |
| Substance abuse | No | 110 (96.5) |
| Yes | 4 (3.5) |
| Frequent call duties | No | 60 (52.6) |
| Yes | 54 (47.4) |
| Specialty causing excessive workloads | No | 65 (57.0) |
| Yes | 49 (43.0) |
| Long working hours | No | 45 (39.5) |
| Yes | 69 (60.5) |
| Pressure of malpractice suits | No | 103 (90.4) |
| Yes | 11 (9.6) |
| Spend time at home on work related affairs/work life imbalance | No | 52 (45.6) |
| Yes | 62 (54.4) |
| Decreased control over work environment | No | 68 (59.6) |
| Yes | 46 (40.4) |
| Lack of confidence in the psychological care of patients | No | 98 (86.0) |
| Yes | 16 (14.0) |
| Overall lack of confidence in dealing with patients | No | 101 (88.6) |
| Yes | 13 (11.4) |
| Deaths of patients and their illnesses taking a toll on you | No | 72 (63.2) |
| Yes | 42 (36.8) |
| Difficulty related to comprehensive documentation | No | 70 (61.4) |
| Yes | 44 (38.6) |
| Form of discrimination/harassment from patients | No | 95 (83.3) |
| Yes | 19 (16.7) |
The results showed that the scores of personal burnout were notably high among the age category of over 30 years, with a mean value of 22.00±4.81. Residents with less than one year of experience had a personal burnout mean of 22.25±3.72, which was high compared to residents with increasing years of experience. The results indicated that residents with more than 10 emergency duties in the previous month experienced greater personal burnout, with a mean score of 23.60±6.23.
The mean score of work-related burnout was higher in females (15.93±3.97) than in males (14.07±4.08). Work-related burnout was observed to increase with experience, as indicated by a mean score of 16.33±4.07 for those with over two years of experience. The mean score of work-related burnout was 16.08±4.63 among those who slept less than six hours. Residents who worked for more than 12 hours reported high work-related burnout, as indicated by a mean score of 16.80±4.30.
It was observed that individuals in the age group of 25-30 years experienced more patient-related burnout, with a mean score of 12.68±4.80. Residents who had undertaken more than 10 emergency duties in the previous month had a mean value of 13.60±5.32. When considering average sleep hours, mean scores of patient-related burnout were more pronounced among those with fewer than 6 hours of sleep (12.43±4.33). Residents working for more than 12 hours recorded high patient-related burnout, with a mean score of 14.93±4.93.
Compared to men (14.07±4.08), women exhibited greater levels of work-related burnout (15.93±3.97), and burnout increased with more professional experience. Burnout among patients was particularly noticeable among residents aged 25-30 years (12.68±4.80), those with more than 10 emergency duties (13.60±5.32), and those who worked more than 12 hours a day (14.93±4.93). The demographic analysis of burnout showed significant associations with a number of psychological and professional factors. Work-related burnout was higher among female residents (p-value <0.05), while negative life events had a significant impact on patient-related burnout (p-value=0.037) and overall burnout (p-value=0.05) [Table/Fig-5,6]. Burnout was significantly associated with discrimination (p-value <0.003), excessive workloads (p-value <0.005), loneliness (p-value=0.005), and inadequate support networks (p-value=0.001) [Table/Fig-7].
Comparison of mean difference in CBI Score according to the sample demographics (using independent t-test).
| Variable | Personal burnout | Work-related burnout | Patient-related burnout | Total burnout |
|---|
| t (p-value) | t (p-value) | t (p-value) | t (p-value) |
|---|
| Marital status | 0.77 (0.446) | 1.57 (0.120) | -1.04 (0.300) | 0.76 (0.447) |
| Family structure | 1.53 (0.128) | -0.09 (0.927) | 0.13 (0.897) | -0.12 (0.901) |
| Negative life event in last year | 1.32 (0.191) | 1.74 (0.085) | 2.11 (0.037)* | 1.97 (0.05)* |
| Average sleep hours/day | 0.54 (0.592) | 1.28 (0.204) | 0.78 (0.436) | 1.74 (0.084) |
*significant association
Comparison of mean difference in CBI Score according to the sample demographics (using One-way ANOVA).
| Variable | Personal burnout | Work-related burnout | Patient-related burnout | Total burnout |
|---|
| F (p-value) | F (p-value) | F (p-value) | F (p-value) |
|---|
| Age | 0.85 (0.430) | 0.54 (0.585) | 0.07 (0.935) | 0.95 (0.389) |
| Sex | 0.53 (0.588) | 3.7 (0.028)* | 0.49 (0.612) | 2.13 (0.123) |
| Experience in years | 0.83 (0.437) | 3.32 (0.040)* | 0.54 (0.587) | 2.33 (0.102) |
| Years of residency | 0.13 (0.877) | 1.05 (0.353) | 0.08 (0.920) | 1.09 (0.339) |
| Emergency duties in previous month | 1.16 (0.325) | 2.55 (0.083) | 0.95 (0.390) | 2.09 (0.129) |
| Average work hours/day | 0.21 (0.810) | 3.37 (0.039)* | 2.30 (0.105) | 3.45 (0.035)* |
*significant association
Comparison of factors with CBI scores (Independent t-test).
| Factors | Personal burnout | Work-related burnout | Patient-related burnout | Total burnout |
|---|
| t (p-value) | t (p-value) | t (p-value) | t (p-value) |
|---|
| Perfectionism | -0.92 (0.360) | 0.57 (0.573) | 0.20 (0.841) | -0.09 (0.927) |
| Lonely feeling | 1.01 (0.316) | 2.88 (0.005)* | 2.15 (0.034)* | 3.59 (0.001)* |
| Lack of adequate support system | -0.75 (0.457) | 3.43 (0.001)* | 3.02 (0.003)* | 4.39 (<0.001)* |
| Face discrimination/harassment | 0.33 (0.744) | 3.02 (0.003)* | 4.34 (<0.001)* | 3.31 (0.001)* |
| Short tempered | 1.0 (0.319) | 1.59 (0.115) | 0.32 (0.751) | 1.16 (0.249) |
| Educational or personal debts | 0.02 (0.981) | 0.55 (0.585) | 0.52 (0.606) | 0.64 (0.522) |
| Drugs for illness related to mental health | 1.82 (0.071) | -0.75 (0.452) | 0.43 (0.667) | 0.23 (0.819) |
| Motor vehicle accident incidents in the past year | -0.75 (0.456) | 0.05 (0.959) | 0.32 (0.748) | -0.12 (0.901) |
| Substance abuse | 0.67 (0.488) | -0.97 (0.333) | -0.50 (0.618) | -1.01 (0.315) |
| Frequent call duties | -0.55 (0.585) | 1.59 (0.115) | 2.12 (0.036)* | 2.21 (0.029)* |
| Specialty causing excessive workloads | 0.09 (0.925) | 2.97 (0.004)* | 2.32 (0.022)* | 2.74 (0.007)* |
| Long working hours | 0.09 (0.927) | 3.46 (0.001)* | 1.46 (0.147) | 3.24 (0.002)* |
| Pressure of malpractice suits | 2.24 (0.027)* | 0.39 (0.697) | 1.13 (0.261) | 0.8 (0.426) |
| Spend time at home on work related affairs | 0.54 (0.590) | 2.00 (0.048)* | -0.09 (0.933) | 1.48 (0.141) |
| Decreased control over work environment | 0.09 (0.930) | 3.73 (<0.001)* | 1.67 (0.097) | 3.63 (<0.001)* |
| Lack of confidence in the psychological care of patients | -1.49 (0.139) | 3.3 (0.001)* | 2.95 (0.004)* | 2.98 (0.003)* |
| Overall lack of confidence in dealing with patients | -0.18 (0.857) | 1.94 (0.055) | 1.03 (0.304) | 2.28 (0.024)* |
| Deaths of patients and their illnesses taking a toll on you | -0.100 (0.920) | 2.55 (0.012)* | 1.55 (0.125) | 2.49 (0.014)* |
| Difficulty related to comprehensive documentation | -1.69 (0.09) | 0.43 (0.666) | 1.48 (0.142) | 1.70 (0.091) |
| Discrimination/harassment from patients | -1.688 (0.094) | 2.61 (0.010)* | 4.13 (<0.001)* | 3.35 (0.001)* |
*significant association
Burnout was greatly impacted by work-related factors such as long hours at work, frequent call duties, and less control over the workplace (p-value <0.05) [Table/Fig-7]. Personal burnout was significantly associated with the pressures of malpractice suits (p-value=0.027).
Discussion
The results of this study show an alarmingly increased prevalence of burnout among the residents of various specialties in the tertiary care centre during the pandemic era, with 17.5% experiencing mild burnout, 65.8% moderate burnout, 15.8% high burnout, and 0.9% severe burnout. These results align with studies on resident physician burnout conducted across different countries using the CBI, which suggested a prevalence of burnout between 45-77.5% in various domains [20,22,23]. Further research on medical professionals in India by Langade D et al., employing the abbreviated Maslach Burnout Inventory, was also consistent with the results obtained [11]. The slight discrepancies in results could be attributable to the various burnout measurement tools and employment settings, as public and private hospitals have different working environments and issues that require additional research.
Work-related burnout was found to be statistically significantly associated with residents’ sex and experience. Work-related burnout was greater for females and for residents with more than two years of experience (p-value <0.05), which shows a similar pattern to previous studies [22,25]. However, investigations into the connection between years of experience and burnout yielded contradictory findings. While one study identified a link between increasing years of residency and burnout [21], other studies discovered that first-year residents were more likely to develop burnout [23,26]. Although the result was similar to the study among resident doctors by Ratnakaran B et al., generalisability may be limited by the small sample size and different job environments [21]. In line with prior research by Gouveia PAC et al., which linked stressful events with burnout, substantial relationships were also found between unpleasant life events in the previous year and patient-related burnout (p-value=0.037) and total burnout (p-value=0.05) [6].
Higher rates of work-related burnout among residents (p-value=0.039) were significantly associated with longer working hours and insufficient time for personal or family activities. A previous study by Shanafelt TD et al., recorded that 40.1% of physicians were dissatisfied with their work-life balance because they did not have enough personal time after work. However, the dissatisfaction was slightly higher among females compared to their male co-workers [27]. Additionally, there was a strong relationship between loneliness and both patient-related and work-related burnout, as well as total burnout (p-value <0.05), which aligns with another study among family medicine physicians [28].
Several studies have established a significant association between burnout and specialty [21,29]. This study found a strong connection between specialties that cause excessive workloads and both work-related and patient-related burnout. Although another study found a high prevalence of personal burnout among surgical residents, the results were not statistically significant in this study, perhaps due to differences in hospital facilities and specialty procedures [21,29]. However, further longitudinal and comparative studies are required to elucidate such a correlation.
Higher burnout rates were also shown to be significantly associated with longer workdays, although the analysis found no association between sleep and burnout. These results were consistent with other research indicating that higher average work hours and lengthy working hours are important predictors of burnout [30-36]. Sleep deprivation may result from stress rather than just long work hours, so the link between sleep and burnout remains inconsistent [37,38]. Medical residents who worked more than 80 hours per week had a higher rate of burnout, according to a study comparing burnout before and after work hour limitations were implemented [31]. This suggests that having less time for leisure activities and social connections could escalate the rate of burnout.
This study also showed that residents who experience discrimination or harassment, as well as a lack of a support system, were more likely to become burned out. Work-related (p-value=0.001), patient-related (p-value=0.003), and total burnout (p-value <0.001) had a significant association with the lack of an adequate support system [31,39]. Frequent on-call duties have been linked with higher levels of patient-related burnout (p-value=0.036) and total burnout (p-value=0.029). Burnout rates and the number of on-call duties were directly correlated, as indicated by other studies [24,40]. Burnout rates also considerably increased when the number of nights on call per week increased [12,33]. Consistent with past studies, there was a substantial correlation between work-related burnout and spending time at home, as well as having less influence over one’s work [27,41,42].
According to this study, rates of work-related, patient-related, and total burnout were all significantly associated with a lack of confidence in delivering psychological care to patients. Another study from Bengaluru, India, found that poor self-esteem and stress were statistically significant predictors of burnout in healthcare workers [42]. Additionally, there was a link between increased personal burnout and the pressure of malpractice lawsuits. Studies involving American surgeons and physicians in Taiwan revealed similar findings [33,34]. Furthermore, work-related, patient-related, and total burnout rates were all associated with discrimination or harassment from patients, and the death of patients or their illnesses correlated with both work-related and total burnout. According to a US study among surgical residents, burnout symptoms were frequently observed in residents who had experienced mistreatment, highlighting the need for workplace assessments and interventions to improve resident wellbeing and lower burnout [35].
Limitation(s)
The current study was conducted at a single centre; therefore, there are limitations in generalising the results. Due to the cross-sectional nature of the study, causal relationships cannot be established. Consequently, more longitudinal studies are needed to understand the issue of burnout in greater detail. The factors influencing burnout, as mentioned in the third part of the questionnaire, were developed from existing literature. However, there may be other factors that require qualitative research methodologies for identification.
Conclusion(s)
A 65.8% of the study population experienced moderate burnout. Several factors, including negative life events, workplace discrimination, excessive workloads, loneliness and insufficient support networks, were significantly associated with burnout. These factors must be explored in greater depth to establish evidence-based interventions designed to improve the quality of care within the healthcare delivery system through policy-level changes, training methodologies, and fostering a healthy work environment. This comprehensive study serves as a reminder of the need for periodic checks on the mental health and wellbeing of doctors, which, in turn, impacts the healthcare system.
*significant association
*significant association
*significant association