The IOL is one of the most frequently performed procedures in obstetrics. Over the years, there has been an increase in IOL for both maternal as well as foetal indications [1]. Prolonged pregnancy is associated with an increased risk of meconium aspiration and Neonatal Intensive Care Unit (NICU) admissions [2]. Delivering before 41 completed weeks is still debatable, despite various meta-analyses showing the advantage of routine IOL at 39 weeks gestation [2]. As far as Indian women are concerned, it has been observed that the duration of pregnancy is shorter compared to their Western counterparts [3]. This is proposed to be due to early maturation of the placenta. Therefore, most centres offer routine IOL to all women with more than 40 weeks gestation. However, more than one-fourth of women undergoing IOL end up with caesarean delivery for unsuccessful IOL [4]. As documented for the duration of the active phase of labour, all women may not have a similar duration of pregnancy, and generalising the IOL at or beyond 39 weeks or 40 weeks may not work for women with different ethnic backgrounds and nutritional statuses.
Bishop’s score has been used since 1965 to prognosticate the success of IOL, but it has a poor NPV [5,6]. Many women with poor Bishop score, who are predicted to be at increased risk of caesarean section, will eventually deliver vaginally [7]. It is also a subjective evaluation method with high interobserver variation [6,8].
The foetal MCA PI is used to predict foetal outcomes, and has recently been proposed to be a good predictor of IOL outcomes [9,10]. There is a physiological increase in the bioavailability of corticotropin-releasing and urocortin hormones in the maternal and foetal circulation at term. Both peptides have a vasodilatory effect and uterotonic action in the last phase of pregnancy. They may have a role in increasing foetal MCA blood flow and the onset of labour [9].
Encouraged by these findings, the present study was planned in postdated pregnant women to determine the role of the MCA PI in predicting the outcome of IOL. It also aimed to find out the association of the MCA PI with the mode of delivery and to compare the MCA PI with Bishop’s score for prediction of successful IOL, mode of delivery and induction-to-delivery interval in these women.
Materials and Methods
This was a prospective observational study involving 296 nulliparous women with singleton postdated pregnancy admitted to the obstetrics wards of Safdarjung Hospital, New Delhi, India, from December 2020 to March 2022. Before starting the study, ethical clearance was obtained from the Institutional Ethics Committee (IEC) (S.No. IEC/VMMC/SJH/Thesis/2020-11/CC-185).
Inclusion criteria: Women with nulliparity, singleton pregnancy, cephalic presentation and gestation >40 weeks were included in the study.
Exclusion criteria: Women presenting with antepartum haemorrhage, foetal macrosomia, foetal growth restriction, premature rupture of membranes, a Bishop’s score >5, a history of previous uterine surgery and heart disease, eclampsia, or respiratory disorders were excluded from the study.
Sample size: The sample size was calculated using the sensitivity and specificity of the MCA PI to predict successful IOL, which were found to be 71.7% and 90.9%, respectively [9]. The minimum required sample size, with a desired precision of 10%, 95% power of study, and 5% level of significance was 231. To further reduce the margin of error, a sample size of 296 was taken.
Study Procedure
Women admitted to the obstetric wards for IOL were screened. The period of gestation was confirmed by the last menstrual period and ultrasound done before 22 weeks of gestation [11]. After obtaining informed consent, a detailed history and examination were done. Per vaginal examination was done for Bishop score.
All enrolled women underwent Doppler ultrasonography to assess the MCA PI. The ultrasound machine, Philips 11XE, equipped with a transabdominal convex multi-frequency probe (2-5 MHz) with colour/power Doppler, was used in this study. For the MCA Doppler, the ultrasound probe was placed on the abdomen. An axial section of the foetal brain showing the thalami and sphenoid bones was obtained, magnified, and the MCA PI was measured as explained by Romero R and Hernandez-Andrade E [Table/Fig-1] [10]. Three measurements the MCA PI were obtained, and the mean of these three values was taken.
Measurement of MCA Doppler PI.
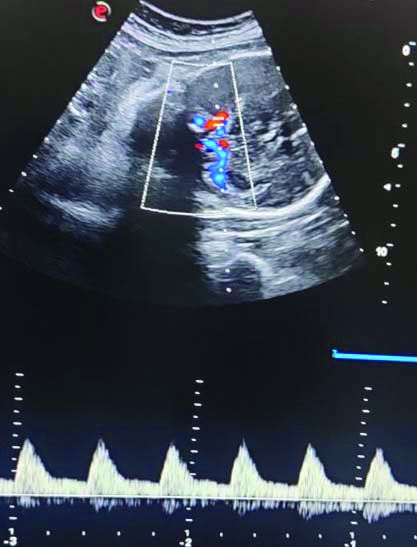
The investigator performing MCA Doppler (one investigator conducted all MCA PI assessments) was blinded for the findings of Bishop score. Women included in the study were instilled with 0.5 mg intracervical Dinoprostone (PGE2) gel. Hourly foetal heart rate monitoring was done and a repeat Bishop scoring was done after six hours. If Bishop score was ≤5, another dose of 0.5 mg intracervical Dinoprostone (PGE2) gel was instilled. If the cervix was favourable (Bishop score >5) after the first prostaglandin gel, oxytocin induction was started. Women who underwent second intracervical Dinoprostone gel installations had oxytocin induction/augmentation after six hours of the second prostaglandin gel. Oxytocin was started with an infusion pump at 4 mIU, and the dose was exponentially increased till women had at least three contractions of 40-45 seconds in 10 minutes, or until a maximum of 64 mIU was reached. All women were followed for the outcome of IOL.
According to the type of response to induction, women were divided into two groups: women with successful IOL and women with failure of induction. Failure of IOL was defined as women requiring caesarean section for failed induction. Failed induction was defined as failure to establish active labour after 24 hours of oxytocin infusion [11]. Outcomes studied were successful IOL, induction to the active phase of labour, and induction to the delivery interval. Successful IOL was defined as women entering an active phase of labour, and the active phase of labour was defined as cervical dilatation of >5 cm.
Statistical Analysis
Statistical Package for the Social Sciences (SPSS) version 21.0 was used for data analysis. ROC curves were employed to determine the AUC for the MCA PI and Bishop score in predicting successful labour induction. The De Long et al., test was used to compare the AUC. Univariate and Multivariate logistic regression was used to assess the predictors of successful labour induction. A p-value of <0.05 was considered statistically significant. To find out the reliability of the MCA PI and Bishop score for prediction of the mode of delivery after labour induction, Kappa, Youden index, and Cramer’s V tests were applied. A value of 0 was considered by chance finding, and 1 value was considered perfect agreement.
Results
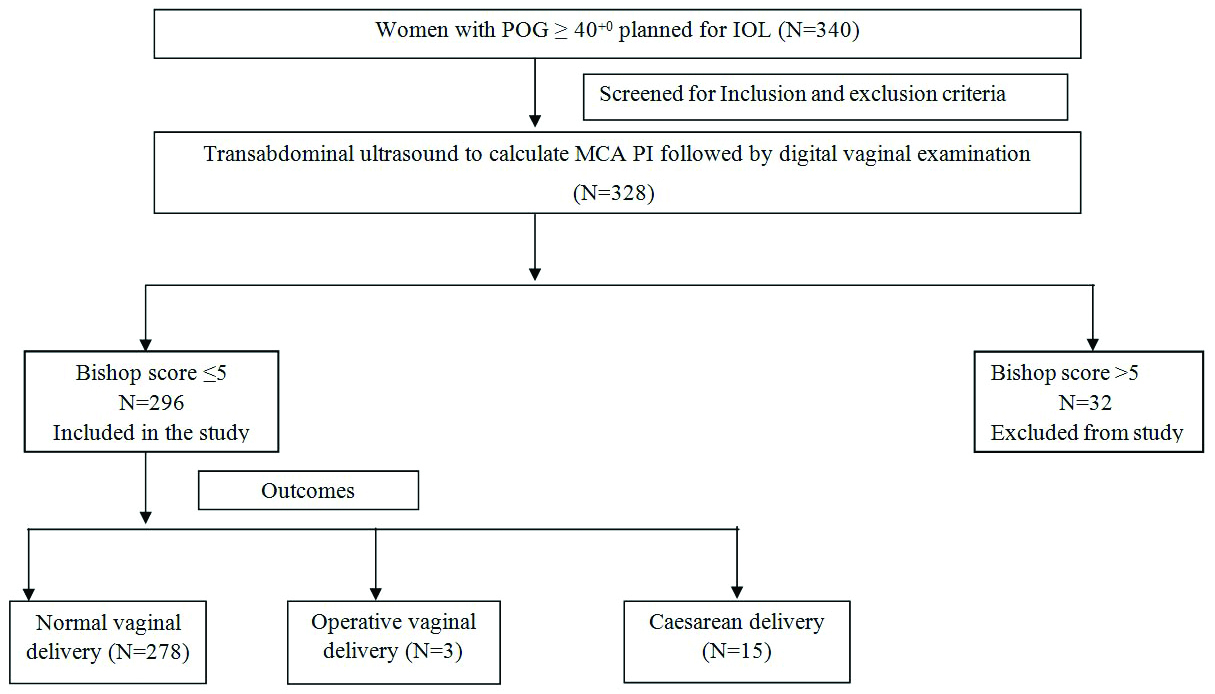
A total of 328 women were enrolled in the study; 32 women had a Bishop score >5 and were excluded, and 296 women had a Bishop score ≤5 and were analysed for type of delivery [Table/Fig-2]. The mean maternal age, period of gestation, Bishop score, MCA PI, and foetal weight of the study population are shown in [Table/Fig-3]. The mean duration from induction to active phase in the study population was 11.63±3.42 hours. Of 296 women enrolled in the study, 285 women (96.3%) had successful IOL. The majority of women, 281 (94.9%), had a vaginal delivery. Out of 15 (5.1%) caesarean sections, 11 (73.3%) were done for failed induction, 3 (20%) for foetal distress, and 1 (6.7%) for the arrest of the second stage of labour.
Clinical profile of women in study population.
| Parameters | Mean±SD || Median (IQR) || Min-Max || or Frequency (%) |
|---|
| Age (years) | 29.69±3.71 || 31.00 (28.00-32.00) || 20.00-35.00 |
| Period of gestation (weeks) | 40.39±0.27 || 40.29 (40.14-40.57) || 40.00-41.00 |
| Bishop score n (%) |
| 0 | 2 (0.7) |
| 1 | 4 (1.4) |
| 2 | 98 (33.1) |
| 3 | 142 (48.0) |
| 4 | 46 (15.5) |
| 5 | 4 (1.4) |
| MCA PI value | 1.24±0.15 || 1.21 (1.14-1.29) || 1.11-1.81 |
| Induction to active phase interval (hours) | 11.63±3.42 || 11.00 (9.00-15.00) || 4.00-20.00 |
| Induction to delivery interval (hours) | 16.09±4.06 || 15.50 (13.00-19.00) || 8.00-28.00 |
| Outcome of IOL n (%) |
| Successful | 285 (96.3) |
| Failure | 11 (3.7) |
| Mode of delivery n (%) |
| Vaginal | 278 (93.9) |
| Lower Segment Caesarean Section | 15 (5.1) |
| Vaginal operative | 3 (1.0) |
| Baby outcomes |
| Neonatal birth weight (Kg) | 2.68±0.30 || 2.70 (2.45-2.89) || 2.11-3.53 |
| APGAR (5 minutes) | 7.53±0.55 || 8.00 (7.00-8.00) || 6.00-9.00 |
| NICU admission (Yes) | 0 |
The maternal age, period of gestation, individual Bishop score parameters, and Bishop score of women with and without successful outcomes of IOL were comparable [Table/Fig-4]. There was a moderate positive correlation of MCA PI value with induction to active phase interval and induction to delivery interval, with r=0.32, p-value <0.001 and r=0.4, p-value <0.001, respectively. It was found that for every one-unit increase in MCA PI value, the induction to active phase interval and induction to delivery interval increased by 10.42 and 14.82 units, respectively. The strength of association between Bishop score and the success of IOL was low, with Cramer’s V=0.12. However, the mean MCA PI was significantly lower in the women with successful IOL (p-value <0.001).
Association of outcome of labour and clinical parameters.
| Parameters | Outcome of IOL | p-value |
|---|
| Successful (n=285) | Failure (n=11) |
|---|
| Age (years) | 29.74±3.65 | 28.45±5.03 | 0.4801 |
| POG (weeks) | 40.39±0.27 | 40.35±0.23 | 0.7201 |
| MCA PI value*** | 1.23±0.11 | 1.74±0.05 | <0.0011 |
| BISHOP score individual parameters |
| Dilatation | | | 0.5212 |
| Closed | 97 (34.0%) | 5 (45.5%) |
| 1-2 cm | 188 (66.0%) | 6 (54.5%) |
| 3-5 cm | 0 | 0 |
| Effacement | | | 0.6962 |
| 0-30% | 230 (80.7%) | 10 (90.9%) |
| 40-50% | 55 (19.3%) | 1 (9.1%) |
| 60-70% | 0 | 0 |
| Station | | | 0.1332 |
| -3 | 229 (80.4%) | 11 (100.0%) |
| -2 | 56 (19.6%) | 0 |
| -1/0 | 0 | 0 |
| Consistency | | | 0.0962 |
| Firm | 16 (5.6%) | 0 |
| Medium | 216 (75.8%) | 6 (54.5%) |
| Soft | 53 (18.6%) | 5 (45.5%) |
| Position | | | 0.5392 |
| Posterior | 111 (38.9%) | 3 (27.3%) |
| Central | 174 (61.1%) | 8 (72.7%) |
| Anterior | 0 | 0 |
| BISHOPS score | | | 0.4372 |
| 0 | 2 (0.7%) | 0 |
| 1 | 4 (1.4%) | 0 |
| 2 | 96 (33.7%) | 2 (18.2%) |
| 3 | 137 (48.1%) | 5 (45.5%) |
| 4 | 42 (14.7%) | 4 (36.4%) |
| 5 | 4 (1.4%) | 0 |
1: Wilcoxon-Mann-Whitney U Test, 2: Fisher’s exact test
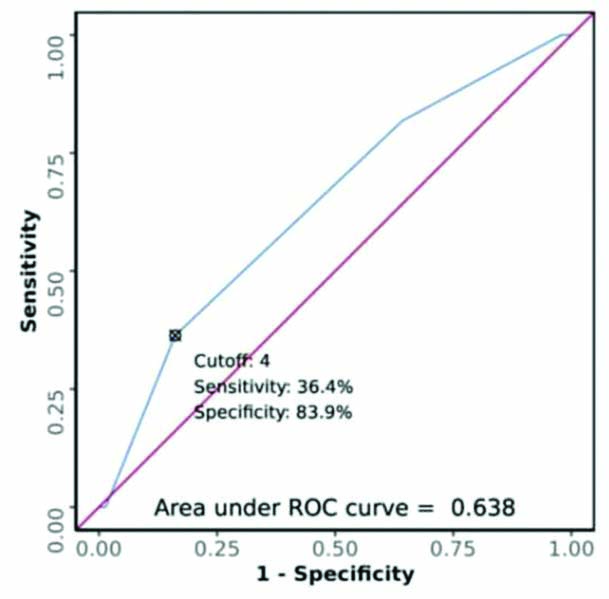
At a ROC cut-off of ≥2 for Bishop score and ≥1.67 for MCA PI, with AUC values of 0.638 and 0.996, respectively, the sensitivity, specificity, and diagnostic accuracy for prediction of outcome of IOL were 36.4%, 83.9%, and 82.1% for the Bishop score, and 100%, 99.3%, and 99.3% for the MCA PI, respectively [Table/Fig-5,6 and 7].
Comparison of study parameters for predicting outcome of IOL.
| Variable | Sensitivity | Specificity | PPV | NPV | Diagnostic accuracy |
|---|
| MCA PI (Cut-off: 1.67 by ROC) | 100.0% (72-100) | 99.3% (97-100) | 84.6% (55-98) | 100.0% (99-100) | 99.3% (98-100) |
| Dilatation (0-1 cm) | 45.5% (17-77) | 66.0% (60-71) | 4.9% (2-11) | 96.9% (93-99) | 65.2% (59-71) |
| Effacement (0-30%) | 90.9% (59-100) | 19.3% (15-24) | 4.2% (2-8) | 98.2% (90-100) | 22.0% (17-27) |
| Station (-3) | 100.0% (72-100) | 19.6% (15-25) | 4.6% (2-8) | 100.0% (94-100) | 22.6% (18-28) |
| Consistency (Soft) | 45.5% (17-77) | 81.4% (76-86) | 8.6% (3-19) | 97.5% (95-99) | 80.1% (75-84) |
| Position (Central) | 72.7% (39-94) | 38.9% (33-45) | 4.4% (2-8) | 97.4% (93-99) | 40.2% (35-46) |
| BISHOPS score (Cut-off: 4 by ROC) | 36.4% (11-69) | 83.9% (79-88) | 8.0% (2-19) | 97.2% (94-99) | 82.1% (77-86) |
ROC curve analysis showing diagnostic performance of Bishop score in predicting outcome of IOL.
ROC curve analysis showing diagnostic performance of MCA PI in predicting outcome of IOL.
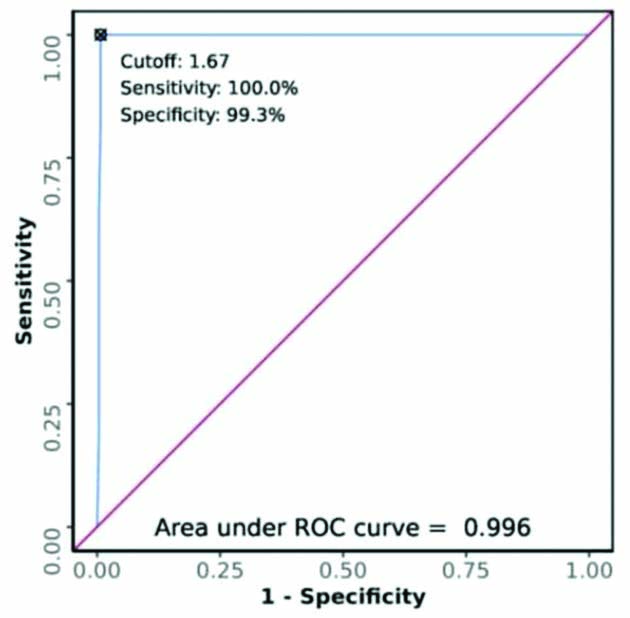
The kappa coefficient of MCA PI was 0.91, and the Youden index score was 99.3, indicating the reliability of the agreement between the MCA PI and the success of IOL, and good ability of MCA PI for prediction of the outcome of IOL [Table/Fig-8].
Performance of study parameters for predicting outcome of IOL.
| Variable | LR+ | LR- | Youden Index | Kappa | p-value |
|---|
| MCA PI (Cut-off: 1.67 by ROC) | 142.50 (35.81-567.01) | 0.00 (0.00-NaN) | 99.3 | 0.91 | <0.001 |
| Dilatation (0-1 cm) | 1.34 (0.69-2.60) | 0.83 (0.48-1.43) | 11.4 | 0.02 | 0.434 |
| Effacement (0-30%) | 1.13 (0.93-1.37) | 0.47 (0.07-3.10) | 10.2 | 0.01 | 0.396 |
| Station (-3) | 1.24 (1.18-1.32) | 0.00 (0.00-NaN) | 19.6 | 0.02 | 0.103 |
| Consistency (Soft) | 2.44 (1.22-4.88) | 0.67 (0.39-1.15) | 26.9 | 0.09 | 0.028 |
| Position (Central) | 1.19 (0.82-1.73) | 0.70 (0.26-1.86) | 11.7 | 0.01 | 0.435 |
| BISHOPS score (Cut-off: 4 by ROC) | 2.25 (0.99-5.14) | 0.76 (0.48-1.19) | 20.2 | 0.07 | 0.079 |
Discussion
Doppler ultrasound is a non invasive approach for studying foetal haemodynamics. It is used to detect foetal hypoxia in intrauterine growth-restricted foetuses. There is a physiological fall in MCA PI with increasing gestational age as a preliminary foetal mechanism to prepare for labour. Fall in MCA PI has been found to precede spontaneous onset of labour [12].
Foetal MCA Doppler shows a correlation with the start of spontaneous preterm and term labour. Using ROC curve analysis, the interval from Doppler ultrasound to spontaneous labour is observed to be shorter in the group with MCA PI <0.74 MoM (p-value <0.001) [13]. Morales-Roselló J et al., also reported a statistically significant association of lower MCA PI with an earlier onset of labour (p-value <0.001) and a shorter ultrasound-labour interval (p-value=0.028) [14]. Similar to present study findings, Vannuccini S et al., reported that women with higher MCA PI had greater chances of failure of induction (p-value <0.05). They found that an MCA PI cut-off of >1.44 had a sensitivity of 71.7% (95% CI, 65.1-77.8) and a specificity of 90.9% (95% CI, 70.8-98.9) (AUC, 0.860; 95% CI, 0.809-0.902, p-value <0.0001) for prediction of failure of IOL [11].
In present study, there was a moderate positive correlation between the MCA PI value (obtained from ROC) and the induction to delivery interval, with r=0.4, p-value ≤0.001. For every one-unit increase in MCA PI value, the induction to delivery interval increased by 14.82 minutes. Widschwendter P et al., also found that the higher the resistance (RI) of the MCA before the start of induction, the longer is the time from the start of induction until delivery of the baby (r=0.547, p-value <0.001) [15].
The main strength of present study was that a separate single researcher did the Bishop score assessments and MCA PI assessments, and they were blinded to each other’s findings.
Limitation(s)
The main limitation of present study was that the study was done in a tertiary care hospital. To apply the study results to the general population, further studies should be conducted with a larger sample size.
Conclusion(s)
In nulliparous women undergoing IOL for pregnancies continuing beyond 40 weeks, lower mean MCA PI is associated with successful IOL. There is a moderate positive correlation of MCA PI with induction to active phase interval and induction to delivery interval.
1: Wilcoxon-Mann-Whitney U Test, 2: Fisher’s exact test