Exploring the Link between Generalised Ligament Laxity and Flexible Flatfoot in Paediatric and Adolescent Populations: A Case-control Study
Ashish Yadav1, Shalu Arimbooth2, Avinash Muraleedharan3, Shweta Chaubey4
1 Senior Resident, Department of Physical Medicine and Rehabilitation, All India Institute of Medical Sciences, Nagpur, Maharashtra, India.
2 Senior Resident, Department of Physical Medicine and Rehabilitation, All India Institute of Medical Sciences, Mangalagiri, Vijayawada, Andhra Pradesh, India.
3 Senior Resident, Department of Physical Medicine and Rehabilitation, All India Institute of Medical Sciences, Raipur, Chattisgarh, India.
4 Consultant, Department of Physical Medicine and Rehabilitation, Baptist Hospital, Bangalore, Karnataka, India.
NAME, ADDRESS, E-MAIL ID OF THE CORRESPONDING AUTHOR: Dr. Ashish Yadav, Senior Resident, Department of Physical Medicine and Rehabilitation, AIIMS, Nagpur, Maharashtra, India.
E-mail: drashishyadavagra@gmail.com
Introduction
Flatfoot, or pes planus, is a postural deformity resulting from the inadequate development of the Medial Longitudinal Arch (MLA) of the foot. Generalised ligament laxity is the most important aetiological factor among various predisposing factors. Previous research has explored these conditions independently rather than investigating their potential association. This study focuses on understanding how generalised ligament laxity contributes to flexible flatfoot, which could provide valuable insights that have not been thoroughly explored in paediatric and adolescent populations.
Aim
To determine the association between flexible flatfoot and generalised ligament laxity in paediatric and adolescent populations.
Materials and Methods
This case-control study was conducted on 180 patients attending the Physical Medicine and Rehabilitation (PMR) Outpatient Department (OPD), aged 5 to 19 years, from September 2019 to March 2021. Footprints were taken from the subjects and a flatfoot assessment was performed using Staheli’s plantar arch index. The Jack test was conducted in all flatfoot subjects to exclude rigid flatfoot. All patients with flexible flatfoot were enrolled as cases, while those without flatfoot were enrolled in the control group. Both groups were further evaluated using the Beighton Score for the presence of generalised ligament laxity and results were recorded. Demographic factors were expressed as frequencies, and quantitative data were presented as median with 25th and 75th percentiles (IQR=interquartile range). Differences in qualitative variables between the groups were analysed using the Chi-square test.
Results
Out of the 180 subjects, 126 (70%) were male, and the majority, 108 (60%), were aged 11 to 19 years, with a mean±SD age of 11.46±3.1 years. The proportion of ligament laxity was higher in cases 30 (41.67%) than in controls 20 (18.52%), and this association was statistically significant (p-value=0.016). Patients with flatfoot had a 3.14 times higher chance of having ligament laxity than those lacking flatfoot, which was statistically significant.
Conclusion
Children and adolescents with increased generalised ligament laxity are more predisposed to the development of flexible flatfoot compared to those without ligament laxity.
Footprint, Hypermobility, Joint flexibility, Medial longitudinal arch, Pes planus, Plantar arch
Introduction
Pes planus, also known as flatfoot, is a postural deformity resulting from the collapse of the MLA of the foot [1]. Although flatfoot rarely leads to disability, it is still a major concern and results in gait abnormalities [2]. Infants and toddlers are universally flat-footed due to a fat pad present underneath the MLA. This fat pad resolves between 2 and 5 years as the normal MLA develops [3]. Hence, the prevalence of flatfoot decreases with increasing age [4]. The prevalence of paediatric flatfoot varies and ranges from 0.6 to 77.9% [3]. Pourghasem M et al., conducted a study to analyse the prevalence of flatfoot in school children and its relationship with Body Mass Index (BMI). They evaluated 1,158 school children, consisting of 653 males and 505 females aged 6 to 18 years. They found the prevalence of flatfoot to be 16.1% in their study [5].
Pes planus, or flatfoot, is clinically divided into two categories: rigid and flexible, depending on the mobility of the tarsal and subtalar joints [6]. The aetiology of flatfoot is multifactorial. Many predisposing factors result in the development of flatfoot, such as age, sex, body composition, family history, decreased strength of the foot muscles and laxity of the osseous-ligamentous complex of the foot [6,7]. The two most accepted theories regarding the pathophysiology of flatfoot are decreased foot muscle strength and weakness of the osseous-ligamentous complex of the foot [8]. Current opinion accepts that osseous and ligamentous structures are most important in maintaining the medial arch, while the intrinsic muscles of the foot contribute more to strength and stabilisation of the foot during ambulation [9].
Generalised ligament laxity is defined as an increased range of motion across various joints in an individual compared to the mean range of motion of the general population [10]. The prevalence of generalised ligament laxity varies among different races, ranging from 5 to 57% of the general population [11,12]. Beighton’s 9-point scoring system is the most commonly used method to assess generalised ligament laxity [13]. A cut-off of more than or equal to 4 hypermobile joints is defined as generalised ligament laxity.
Clinch J et al., studied 6,022 children with a mean age of 13.8 years to evaluate the prevalence of ligament laxity. They used a Beighton score of more than or equal to 4 as a marker of ligament laxity and found the prevalence of generalised ligament laxity to be 27.5% [14]. Generalised ligament laxity can lead to flexible flatfoot, as it is the tensile strength of the ligaments that helps maintain the arches of the foot [15]. Homayouni K et al., studied 290 elementary school girls aged 6 to 11 years for the prevalence of flatfoot and its association with generalised ligament laxity. They found that the prevalence of flexible flatfoot was 34.9%, with the highest prevalence among six-year-olds and the lowest among eleven-year-olds. The study indicated that flatfoot was more common in children with joint laxity, suggesting a significant correlation between joint laxity and the risk of flatfoot [16]. In contrast, an observational study conducted by Tsai CC et al., to evaluate the correlation between flexible flatfoot and joint hypermobility in 291 preschool children demonstrated no correlation between joint hypermobility and flatfoot [17]. There are currently no case-control studies in the literature that show the association between flatfoot and generalised ligament laxity in children and adolescent populations.
The findings from the study will help clinicians potentially enhance diagnostic and treatment strategies associated with generalised ligament laxity and flatfoot. Hence, the study aimed to determine the association between generalised ligament laxity and flexible flatfoot among children and adolescent populations.
Materials and Methods
The case-control study was conducted in the PMR OPD of an apex central government institution from September 2019 to March 2021. The study was approved by the institutional ethics committee (ECR/1210/INST/WB/2019). Written informed consent was obtained from the parents of the enrolled subjects.
Inclusion criteria: Subjects with flatfoot aged 5 to 19 years attending the PMR OPD were included in the study as cases, while normal individuals as same age group were included in the control group.
Exclusion criteria for both groups: Subjects with any lower limb deformity (other than flexible flatfoot in the case group), a history and examination suggestive of any surgical procedure on the lower limb, any neuromuscular disorders, or any lower limb trauma or injury were excluded from the study.
The study population was screened for flatfoot using Staheli’s Plantar Arch Index (PAI). A total of 190 subjects were screened, of which 82 subjects were found to have flatfoot, and the remaining 108 subjects were enrolled as controls. Out of the 82 flatfoot subjects, 10 were found to have rigid flatfoot, as detected by the Jack test and were hence excluded. Therefore, a total of 72 subjects with flexible flatfoot were enrolled as cases. Both cases and controls were evaluated using the Beighton Score for the presence of generalised ligament laxity and the results were recorded. The results were analysed to find out the association between generalised ligament laxity and flexible flatfoot.
Data Collection Variables
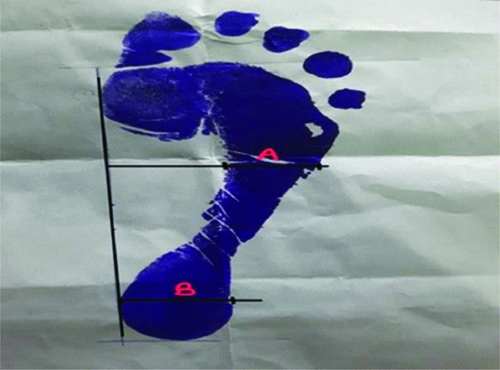
1. Staheli’s plantar arch index: A large piece of sponge, about 30 cm (larger than the foot size) and 1-2 cm thick, was placed on a tray soaked with diluted ink. The foot was placed on this sponge and then on a clean white paper to obtain a clear footprint. The PAI was calculated by drawing a tangential line connecting the edges of the medial forefoot and heel region. The midpoint of this straight line was marked. From this marked point, a perpendicular line was drawn crossing the footprint. The same procedure was repeated at the heel region for the heel tangency point.
The width of the central region of the footprint was considered as “A,” and the width of the heel region was considered as “B” [Table/Fig-1]. The PAI was obtained by dividing the A and B values [18]. If the PAI was greater than 1.15, it was considered flatfoot.
Staheli’s Plantar Arch Index = A/B.
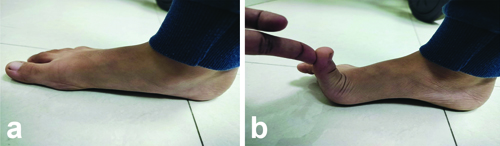
2. Jack test: The purpose of this test was to check foot flexibility [19]. To perform this test, the hallux (toe) was manually dorsiflexed while the patient was standing. If the MLA rises due to dorsiflexion of the hallux, the foot is considered a flexible flatfoot. If the MLA remains unchanged, the test indicates a rigid flatfoot [Table/Fig-2].
a) On standing, b) Passive dorsiflexion of great toe.
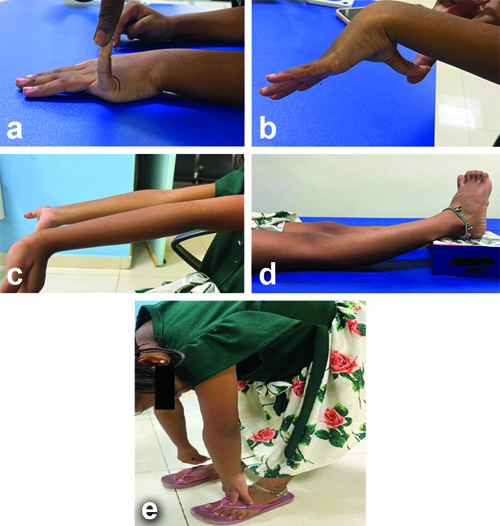
3. Beighton score: This test was conducted to evaluate the presence of ligament laxity [13]. The Beighton Scoring System measures joint hypermobility on a 9-point scale [Table/Fig-3]. The maximum score for ligament laxity is 9. A score of zero is considered tight, scores of 0-3 are regarded as normal and scores of 4-9 represent ligament laxity. A score of 9 indicates hyperlaxity. In this study, a Beighton score of more than 4 was taken as a criterion for generalised ligament laxity.
a) Passive hyperextension of 5th metacarpophalangeal joint; b) Passive apposition of thumb to flexor aspect of the forearm; c) Active hyperextension of elbow; d) Hyperextension of knee; e) Touching the floor with the palm without bending the knee.
A well-designed proforma containing all variables under study was used for data collection.
Statistical Analysis
Microsoft Excel spreadsheet was used for data entry. The final analysis was conducted using the Statistical Package for the Social Sciences (SPSS) software, IBM manufacturer, Chicago, USA, version 21.0. The categorical variables were illustrated in the form of numbers and percentages (%). Quantitative data were presented as means±SD and median with 25th and 75th percentiles (IQR=interquartile range). Data normality was checked using the Kolmogorov-Smirnov test, where a p-value<0.05 indicated a lack of normality in the data. As all the quantitative variables lacked a normal distribution, the Mann-Whitney U test was used to identify the differences in the distribution of those variables between cases and controls. Differences in qualitative variables between case and control groups were analysed using the Chi-square test. If any cell had an expected value of less than 5, then Fisher’s exact test was used for this purpose. A p-value <0.05 was considered statistically significant.
Results
Of the 180 subjects included in this study, the majority (n=108; 60%) were aged 11 to 19 years, with a mean±SD age of 11.46±3.1 years, ranging from 5 to 17 years, and a median age of 11 years. The proportion of children aged 5-10 years was 50 (46.30%) in the control group compared to 22 (30.5%) in the case group. However, this difference was not statistically significant (p-value=0.135). The majority of participants, 126 (70%), were male among the study subjects [Table/Fig-4]. Male predominance was noted in both cases (50;69.44%) and controls (76;70.37%).
Demographic characteristics.
| Variables | | Cases (n=72) n (%) | Control (n=108) n (%) | p-value |
|---|
| Age (years) | 5-10 | 22 (30.56) | 50 (46.30) | 0.135† |
| 11-19 | 50 (69.44) | 58 (53.70) |
| Gender | Female | 22 (30.56) | 32 (29.63) | 0.925† |
| Male | 50 (69.44) | 76 (70.37) |
| Residence | Rural | 34 (47.22) | 38 (35.19) | 0.65 |
| Urban | 38 (52.78) | 70 (64.81) |
| Body Mass Index (BMI) | Underweight | 2 (2.78) | 4 (3.71) | 0.047 |
| Normal | 44 (61.11) | 90 (83.33) |
| Overweight | 18 (25) | 12 (11.11) |
| Obese | 8 (11.11) | 2 (1.85) |
†Chi-square test
The distribution of ligament laxity in the study subjects was assessed using the Beighton score. The mean Beighton score in cases (3.92±1.76) was higher than that of the control group (2.5±1.15), and this difference was statistically significant (p-value <0.001) [Table/Fig-5]. The results demonstrated that the proportion of ligament laxity was higher in cases (n=30; 41.67%) than in controls (n=20; 18.52%), and this association was statistically significant (p-value=0.016). The odds of ligament laxity for flatfoot cases was 3.14, with a Confidence Interval (CI) of 1.21 to 8.16 [Table/Fig-6]. This indicates that patients with flatfoot had a 3.14 times higher chance of having ligament laxity than patients without flatfoot, which was statistically significant, as both ends of the CI are greater than 1.
Distribution of ligament laxity based on Beighton score on cases and control. §Mann-Whitney test applied as Kolmogarov Smirnov Test; p-value <0.05.
| Beighton score | Cases (n=72) | Controls (n=108) | Total | p-value |
|---|
| Mean±SD | 3.92±1.76 | 2.5±1.15 | 3.07±1.58 | <0.0001§ |
| Median (IQR) | 3 (3-5) | 2 (2-3) | 3 (2-4) |
| Range | 2-9 | 1-6 | 1-9 |
Association of ligament laxity and flatfoot.
| Ligament laxity | Cases(n=72) n (%) | Controls (n=108) n (%) | Totaln (%) | OR (CI)p-value |
|---|
| Absent | 42 (58.33) | 88 (81.48) | 130 (72.22) | 3.14 (1.21-8.16)0.016† |
| Present | 30 (41.67) | 20 (18.52) | 50 (27.78) |
| Total | 72 (100) | 108 (100) | 180 (100) |
†Chi-square test; OR: Odds ratio; CI: Confidence Interval
Discussion
In this case-control study, 72 cases and 108 controls were enrolled and examined for flexible flatfoot and generalised ligament laxity. The aim of this study was to determine the prevalence of flexible flatfoot in children and adolescent populations and to investigate the association between generalised ligament laxity and flexible flatfoot among cases and controls.
A total of 180 subjects aged 5 to 19 years, including males and females, were included in the study. The study showed that the proportion of 5 to 10-year-old children was slightly higher in the control group (n=50; 46.30%) compared to the case group (n=22; 30.56%). However, this difference was not statistically significant (p-value=0.135). The study also indicated a predominance of male subjects in both cases (n=50; 69.44%) and controls (n=76; 70.37%), but no significant gender difference was found between cases and controls (p-value=0.925). Chang JH et al., conducted a study involving 2083 subjects aged between 7 and 12 years to evaluate the prevalence of flexible flatfoot and found that 67% of males and 49% of females had flatfoot. Males were twice as likely to have flatfoot as females [20]. The study found that the average Body Mass Index (BMI) of cases (20.2 kg/m2) was higher than that of controls (17.8 kg/m2), which was statistically significant (p-value=0.003). This suggests a significant association between BMI and obesity with the occurrence of flatfoot. Jayabandara A et al., conducted a study that included 533 participants. Their study aimed to determine the prevalence of flatfoot and its correlation with age, gender and BMI. They found a significant association between flatfoot and increasing BMI or obesity [21]. The study also found that subjects in the flatfoot group were more likely to be urban residents. Thomas B et al., examined 200 healthy children aged 6-15 years to compare the differences in foot structure between rural and urban school-aged Indian children. They found that when corrected for body weight, rural children were considered more favourable in the development of the MLA and hence less likely to develop flatfoot [22].
In the study, the Beighton score was used to determine the prevalence of generalised ligament laxity among cases and controls. A score of 4 or higher is considered indicative of generalised ligament laxity. The proportion of ligament laxity was higher in cases (n=30; 41.67%) than in the control group (n=20; 18.52%), and this association was statistically significant (p-value=0.016). Homayouni K et al., studied 290 elementary school girls aged 6 to 11 years, with a median age of 8.45 years. They used the navicular foot drop test to diagnose flatfoot and the Beighton score to evaluate generalised ligament laxity. They found that children with ligament laxity have a higher risk of flatfoot compared to those without ligament laxity (p-value=0.01) [16]. Mosca VS, reviewed flexible flatfoot in children and adolescents and proposed the theory that the height of the longitudinal arch is primarily maintained by the bone-ligament complex, with ligamentous laxity being the main abnormality leading to the development of flatfoot. This theory supports the conclusions drawn in the study [23]. Sadeghi-Demneh E et al., conducted a cross-sectional study of 667 children aged 7 to 14 years to determine the prevalence of flatfoot in school-age children. They found that 25.2% of children with flatfoot have joint hypermobility [24]. Atik A and Ozyurek S, studied flexible flatfoot and its aetiopathology among children. They suggested that the collapse of the MLA results from ligament laxity in the foot, leading to the occurrence of flatfoot in the population [25]. In contrast, a study conducted by Tsai CC et al., which was an observational study involving 291 preschool children aimed at evaluating the correlation between flexible flatfoot in preschool age and joint hypermobility. They found no correlation between flexible flatfoot and joint hypermobility when flatfoot was defined using the Staheli index and joint hypermobility was assessed by the Beighton score [17].
Clinical Implications
The study recorded a significant association between ligament laxity and flexible flatfoot. This can guide clinicians in early diagnosis and in initiating interventions such as tailored exercise programs for generalised ligament laxity in the early stages, potentially preventing future joint problems.
Limitation(s)
The limitation of the study was that it was conducted in a single centre and only one method was used to diagnose flatfoot and ligament laxity.
Conclusion(s)
Children and adolescents with increased generalised ligament laxity are more predisposed to the development of flexible flatfoot compared to those with normal ligament laxity. The study reveals that the assessment and immediate management of generalised ligament laxity should be addressed early in patients with flexible flatfoot. There is a need for a larger sample size, biomechanical assessments including kinetic chain analysis of the lower limb, imaging such as MRI, and force plate analysis to examine the stability of the medial arch and ligament laxity. Additionally, there is a need for multicentric prevalence studies across India, taking both rural and urban populations into consideration. This will lead to the development of stronger study designs for future research.
†Chi-square test
†Chi-square test; OR: Odds ratio; CI: Confidence Interval
Author Declaration:
Financial or Other Competing Interests: None
Was Ethics Committee Approval obtained for this study? Yes
Was informed consent obtained from the subjects involved in the study? Yes
For any images presented appropriate consent has been obtained from the subjects. Yes
Plagiarism Checking Methods: [Jain H et al.]
Plagiarism X-checker: Jun 29, 2024
Manual Googling: Sep 21, 2024
iThenticate Software: Oct 19, 2024 (15%)
[1]. Pranati T, Babu KY, Ganesh K, Assessment of plantar arch index and prevalence of flat feet among south Indian adolescent populationJ Pharmaceutical Sci Res 2017 9(4):490 [Google Scholar]
[2]. Krul M, van der Wouden JC, Schellevis FG, van Suijlekom-Smit LW, Koes BW, Foot problems in children presented to the family physician: A comparison between 1987 and 2001Family Practice 2009 26(3):174-79.10.1093/fampra/cmp01819270034 [Google Scholar] [CrossRef] [PubMed]
[3]. Halabchi F, Mazaheri R, Mirshahi M, Abbasian L, Stric flexible flatfoot; Clinical aspects and algorithmic approachIranian J Strics 2013 23(3):247 [Google Scholar]
[4]. Yeagerman SE, Cross MB, Positano R, Doyle SM, Evaluation and treatment of symptomatic pesplanusCurrent Opinion in Strics 2011 23(1):60-67.10.1097/MOP.0b013e32834230b221169838 [Google Scholar] [CrossRef] [PubMed]
[5]. Pourghasem M, Kamali N, Farsi M, Soltanpour N, Prevalence of flatfoot among school students and its relationship with BMIActa Orthopaedica Et Traumatologica turcica 2016 50(5):554-57.10.1016/j.aott.2016.03.00227760696PMC6197460 [Google Scholar] [CrossRef] [PubMed]
[6]. Carr JB, Yang S, Lather LA, Stric pesplanus: A state-of-the-art reviewStrics 2016 137(3)10.1542/peds.2015-123026908688 [Google Scholar] [CrossRef] [PubMed]
[7]. Jones RL, The human foot. An experimental study of its mechanics, and the role of its muscles and ligaments in the support of the archAm J Anat 1941 68(1):1-39.10.1002/aja.1000680102 [Google Scholar] [CrossRef]
[8]. Hicks JH, The mechanics of the foot: II. The plantar aponeurosis and the archJ Anat 1954 88(Pt 1):25 [Google Scholar]
[9]. Gray EG, Basmajian JV, Electromyography and cinematography of leg and foot (“normal” and flat) during walkingThe Anatomical Record 1968 161(1):01-05.10.1002/ar.10916101015664082 [Google Scholar] [CrossRef] [PubMed]
[10]. Murray KJ, Hypermobility disorders in children and adolescentsBest Pract Res Clin Rheumatol 2006 20(2):329-51.10.1016/j.berh.2005.12.00316546060 [Google Scholar] [CrossRef] [PubMed]
[11]. Remvig L, Jensen DV, Ward RC, Epidemiology of general joint hypermobility and basis for the proposed criteria for benign joint hypermobility syndrome: Review of the literatureJ Rheumatol 2007 34(4):804-09. [Google Scholar]
[12]. Neki NS, Chhabra A, Benign joint hypermobility syndromeJ Mahatma Gandhi Institute of Med Sci 2016 21(1):1210.4103/0971-9903.178073 [Google Scholar] [CrossRef]
[13]. Beighton PH, Solomon L, Soskolne CL, Articular mobility in an African populationAnn Rheum Dis 1973 32(5):41310.1136/ard.32.5.4134751776 [Google Scholar] [CrossRef] [PubMed]
[14]. Clinch J, Deere K, Sayers A, Palmer S, Riddoch C, Tobias JH, Epidemiology of generalized joint laxity (hypermobility) in fourteen-year-old children from the UK: A population-based evaluationArthritis & Rheumatism 2011 63(9):2819-27.10.1002/art.3043521547894PMC3164233 [Google Scholar] [CrossRef] [PubMed]
[15]. Malakoutikhah H, The contribution of the ligaments in flatfoot deformity, a finite element study (Doctoral dissertation, The University of Arizona) [Google Scholar]
[16]. Homayouni K, Karimian H, Naseri M, Mohasel N, Prevalence of flexible flatfoot among school-age girlsShiraz E-Medical Journal 2015 16(2)10.17795/semj18005 [Google Scholar] [CrossRef]
[17]. Tsai CC, Chih YC, Shih CL, Chen SJ, Shen PC, Tien YC, Joint hypermobility and preschool-age flexible flatfootMedicine 2022 101(31):e2960810.1097/MD.000000000002960835945775 [Google Scholar] [CrossRef] [PubMed]
[18]. Ganapathy A, Sadeesh T, Rao S, Morphometric analysis of foot in young adult individualsWorld Journal of Pharmacy and Pharmaceutical Sciences 2015 4(8):980-93. [Google Scholar]
[19]. Jack EA, Naviculo-cuneiform fusion in the treatment of flat footJ Bone & Joint Surgery British Volume 1953 35(1):75-82.10.1302/0301-620X.35B1.7513034876 [Google Scholar] [CrossRef] [PubMed]
[20]. Chang JH, Wang SH, Kuo CL, Shen HC, Hong YW, Lin LC, Prevalence of flexible flatfoot in Taiwanese school-aged children in relation to obesity, gender, and ageEurp J Strics 2010 169:447-52.10.1007/s00431-009-1050-919756732 [Google Scholar] [CrossRef] [PubMed]
[21]. Jayabandara A, Rodrigo D, Nadeeshan S, Wanniarachchi C, Rajathewa P, Makuloluwa T, Prevalence of flatfoot and its correlation with age, gender and bmi among undergraduates at the faculty of allied health sciences, general sir John Kotelawela Defence UniversityJ Pharmacy and Pharmacol 2021 9:287-91.10.17265/2328-2150/2021.09.001 [Google Scholar] [CrossRef]
[22]. Thomas B, Singh YL, Mullerpatan RP, Comparison of foot structure between urban and rural Indian school childrenPhysiotherapy-The Journal of Indian Association of Physiotherapists 2019 13(1):3810.4103/PJIAP.PJIAP_10_18 [Google Scholar] [CrossRef]
[23]. Mosca VS, Flexible flatfoot in children and adolescentsJournal of Children’s Orthopaedics 2010 4(2):107-21.10.1007/s11832-010-0239-921455468PMC2839866 [Google Scholar] [CrossRef] [PubMed]
[24]. Sadeghi-Demneh E, Melvin JM, Mickle K, Prevalence of pathological flatfoot in school-age childrenThe Foot 2018 37:38-44.10.1016/j.foot.2018.05.00230321857 [Google Scholar] [CrossRef] [PubMed]
[25]. Atik A, Ozyurek S, Flexible flatfootNorthern Clinics of Istanbul 2014 1(1):5710.14744/nci.2014.2929228058304PMC5175026 [Google Scholar] [CrossRef] [PubMed]