Pleural effusion is characterised by the pathological accumulation of fluid in the pleural space [1]. Around 1.5 million people worldwide are affected each year [1,2]. The occurrence of pleural effusion indicates a pathological process, which can originate primarily from the lungs or another organ system, or may be the initial sign of a systemic disease. However, in approximately 20% of patients, the aetiology of pleural effusion remains uncertain [3].
To effectively treat the effusion, it is necessary to identify the underlying cause. Determining the type of effusion is the initial step, as it indicates the underlying pathophysiologic process, guides the differential diagnosis and determines the necessity for additional investigations [4]. Light’s criteria, which include pleural fluid and serum biochemical studies, are routinely employed in clinical practice to differentiate between exudative and transudative effusions. Light’s criteria combine three dichotomous tests obtained through thoracentesis into a decision rule that is considered positive if one of the tests is positive. However, this examination cannot be performed on elderly or bedridden patients due to its invasiveness [5]. Additionally, while this criteria has a high sensitivity for diagnosing exudative pleural effusions (98%), its ability to exclude transudates is limited [6]. This misclassification may subject patients to unnecessary diagnostic tests and cause delays in appropriate treatment, highlighting the need for specific biomarkers.
The use of Ultrasonography (USG) as a point-of-care test allows for accurate detection of pleural pathology while ensuring safe access for thoracentesis or chest drain insertion. It distinguishes pleural from parenchymal densities, in addition to determining the quantity, presence of septations, echoes in the fluid and pleural thickening, all of which assist in the patient’s future therapy. Some studies have indicated that thoracic USG can determine the type of effusion, with findings correlating with the transudative and exudative interpretations from Light’s criteria, aiding in the determination of the appropriate course of management [7].
The C-cells of the thyroid gland naturally release PCT, a prohormone of calcitonin [8]. PCT is broken down by a specific protease into calcitonin, katacalcin and an N-terminal residue; its levels are undetectable in healthy individuals [9]. PCT synthesis is increased solely in response to bacterial infection and is emerging as a useful clinical indicator, but not in response to non infectious inflammation or non-bacterial infection [10]. Higher PCT levels in pleural fluid may suggest a more inflammatory or infectious aetiology for the effusion, which is often linked with exudative pleural effusions [11,12].
The role of USG of the thorax in pleural effusions and the evaluation of PCT levels in pleural fluid to distinguish the type of effusion is limited. Therefore, the present study was undertaken to emphasise the need for TUS among patients with pleural effusion to classify the type of pleural effusion and correlate it with Light’s criteria to initiate appropriate management. Additionally, the association of pleural fluid PCT levels with Light’s criteria was studied to determine the possibility of using PCT as a screening test, which may help in the optimised management of pleural effusions.
Materials and Methods
A cross-sectional study was conducted in the Department of Respiratory Medicine at Shri BM Patil Medical College, Hospital and Research Centre, Vijayapura, Karnataka, India, from 2022 August to 2024 July. Written consent was obtained from each patient for participation. The study was approved by the Institutional Ethical Committee (IEC number: BLDE/DU/IEC/734/2022-23).
Inclusion and Exclusion criteria: Patients with pleural effusion aged above 18 years were included. Exclusion criteria included patients with contraindications to pleural aspiration procedures, patients aged below 18 years and pregnant or lactating women.
Sample size calculation: A total of 89 patients with pleural effusion were enrolled and the sample size calculation was based on the binomial test for a single proportion using G*Power version 3.1.9.4 software.
Study Procedure
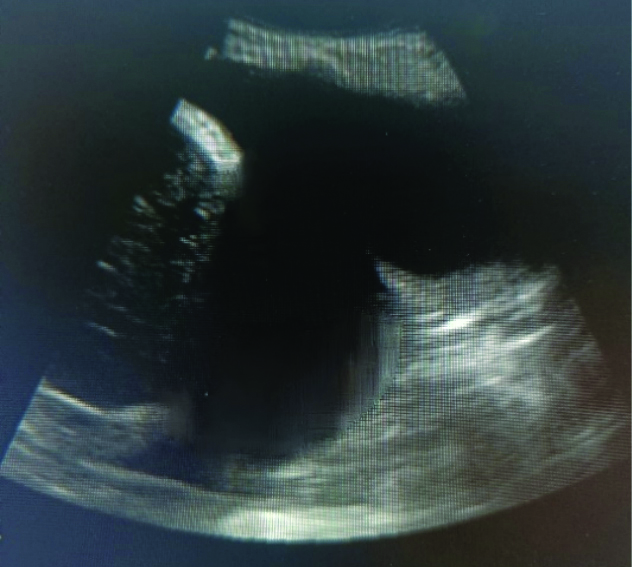
The USG was performed using linear and convex probes of 3.5 MHz and pleural effusions were classified as follows:
Anechoic- no echoes within the fluid
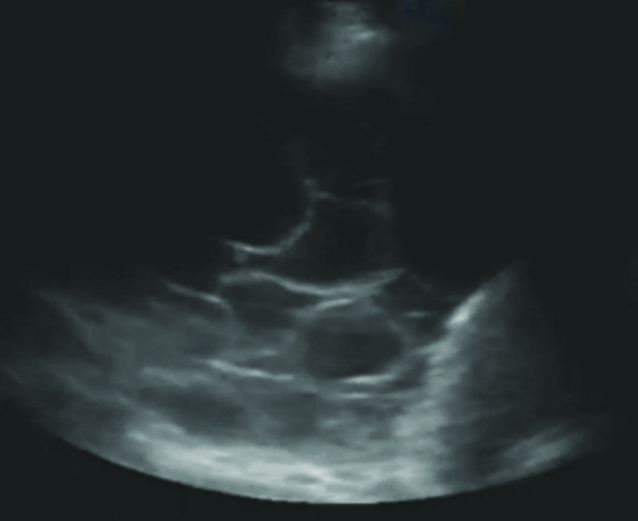
Complex septated- with prominent fibrinous septations within the fluid
Complex non septated- with few echoes within the fluid
Homogeneously echogenic- with echogenic spots evenly distributed within the fluid [13].
The diagnostic pleural fluid analysis was performed on each patient which included the following investigations: cell count, cell type, malignancy, gram stain, Zn stain, culture, sugar, protein, chloride, Lactate Dehydrogenase (LDH), Adenosine Deaminase (ADA) and the Cartridge-based Nucleic Acid Amplification Test (CBNAAT). Light’s criteria were calculated to distinguish the type of effusion and pleural exudates met at least one of the following criteria:
Pleural fluid/serum LDH >0.6;
Pleural fluid LDH >2/3 of the upper limit of serum value;
Pleural fluid/serum protein >0.5 [13].
Quantification was done and classified as minimal/small, moderate and massive effusion when the space was greater than the costophrenic angle but still within a one-probe range, exceeded one-probe range but within a two-probe range and exceeded two-probe range, respectively. Thick septations appeared brighter and were clearly echogenic, measuring 1 mm or more in thickness, thus distinguishing them from thin septations. Pleural thickening was confirmed as a focal lesion greater than 3 mm in width, arising from the visceral or parietal pleura with or without an irregular margin [14].
The exudative group was further classified into four groups after diagnostic pleural fluid analysis:
Tuberculous effusion: Mycobacteria or caseating granuloma detected on pathological examination of pleural biopsy, sputum culture positive for mycobacteria and both clinical and radiological response to anti-tuberculosis treatment.
Malignant effusion: Presence of malignant cells on cytological examination of the effusion or pleural biopsy.
Parapneumonic effusion: If pleural effusion was accompanied by community-acquired pneumonia but the effusion was not grossly purulent.
Empyema: Grossly purulent pleural effusion accompanied by bacteria detected on gram stain or culture positive for bacteria [15].
Pleural fluid PCT levels (expressed in ng/mL) were measured using an enzyme-linked immunosorbent assay kit and a Tecan multimode analyser machine for all patients.
Statistical Analysis
The data collected were entered into a Microsoft Excel spreadsheet and statistical analyses were carried out with the help of Statistical Package for the Social Sciences (SPSS) version 20.0. Means, Standard Deviations (SD), counts and percentages, as well as graphs, were used to present the results. Categorical variables between the two groups were compared using the Chi-square test or Fisher’s-exact test, with a p-value of <0.05 considered statistically significant. All statistical operations were conducted in two-tailed mode.
Results
Among the 89 patients enrolled in the present study, the ages ranged from 18 to 85 years, with a mean age of 50.8±18.1 years. In the transudative group, ages ranged from 21 to 80 years, with a mean age of 53.8±14.2 years. In the exudative group, ages ranged from 18 to 85 years, with a mean age of 49.3±19.6 years. A male preponderance was observed in the present study, with 61 males (68.5%) and 28 females (31.5%).
Among the complex septate pleural effusions in the present study, thin septations were predominant at 28 (80%), followed by thick septations, which accounted for 7 (20%). Regarding the site of effusion, 49 patients (55%) had right-sided effusions, 25 (28.1%) had left-sided effusions and 15 (16.9%) had bilateral effusions. Additionally, 16 patients (18%) had thickened pleura and the nature of the fluid in those cases was exudative [Table/Fig-1].
Distribution of patients according to gender and ultrasonographic findings.
| Variables | Patients |
|---|
| n | % |
|---|
| Gender |
| • Males | 61 | 68.5 |
| • Females | 28 | 31.5 |
| USG findings |
| • Anechoic | 32 | 36.0 |
| • Complex non septated | 19 | 21.3 |
| • Complex septated | 35 | 39.3 |
| • Homogenous echoes | 3 | 3.4 |
| Septations in pleural fluid |
| • Thin | 28 | 80 |
| • Thick | 7 | 20 |
| Quantity of pleural fluid |
| • Massive | 21 | 23.6 |
| • Mild | 14 | 15.7 |
| • Moderate | 54 | 60.7 |
| Site of effusion |
| • Bilateral | 15 | 16.9 |
| • Left | 25 | 28.1 |
| • Right | 49 | 55 |
| Thickened pleura |
| • Present | 16 | 18.0 |
| • Absent | 73 | 82.0 |
The USG of the thorax was performed on all enrolled patients. The majority of cases, 35 (39.33%), exhibited complex septate findings on USG, followed by 32 (35.96%) with anechoic findings, 19 (21.35%) with complex non septate findings and 3 (3.36%) with homogeneous echo findings, as depicted in [Table/Fig-2,3,4,5 and 6]. There was a statistically significant association (p<0.05) between anechoic findings and complex septate findings on ultrasound, correlated with the type of pleural effusion defined by Light’s criteria, as shown in [Table/Fig-2].
Association of ultrasound thorax findings with light’s criteria.
| USG findings | Light’s criteria | Total | Chi-square test | Significant value |
|---|
| Exudative | Transudative |
|---|
| Anechoic | Count | 9 | 23 | 32 | 32.572 | 0.001 |
| % within groups | 15.3% | 76.7% | 36.0% |
| Complex septate | Count | 34 | 1 | 35 | 24.570 | 0.001 |
| % within groups | 57.6% | 3.3% | 39.3% |
| Complex non septate | Count | 13 | 6 | 19 | 0.049 | 0.8248 |
| % within groups | 22.0% | 20.0% | 21.3% |
| Homogenous echoes | Count | 3 | 0 | 3 | 1.579 | 0.2090 |
| % within groups | 5.1% | 0.0% | 3.4% |
Simple anechoic- No echoes present between the pleura and diaphragm.
Homogenously echoes- Echogenic materials filled between pleura and diaphragm.
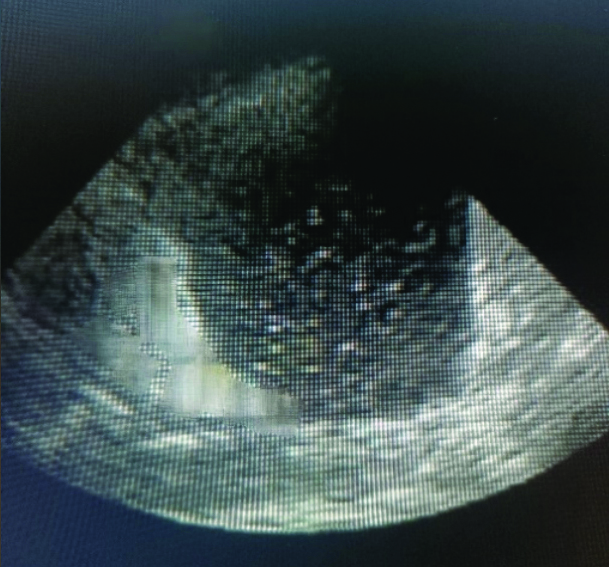
Complex non septated- Increased echogenicity between pleura and diaphragm.
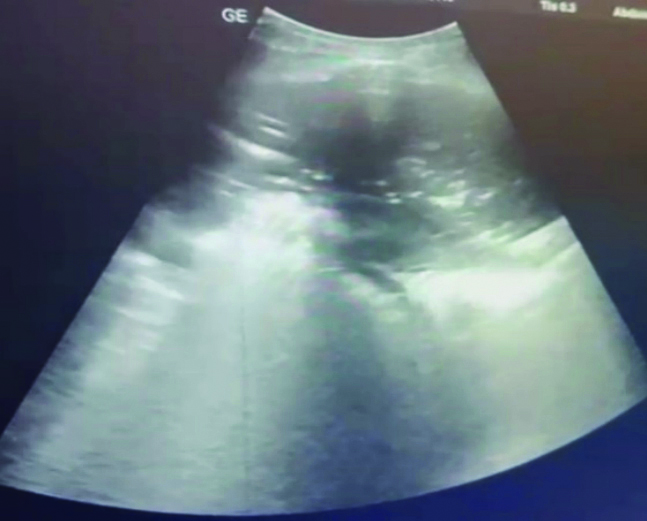
Complex septated- Echogenic septa between pleura and diaphragm.
In the current study, ultrasound assessment of pleural effusion quantity revealed that 21 patients (23.6%) had massive pleural effusion, 54 patients (60.7%) had moderate effusion and 14 patients (15.7%) had mild effusion. Out of 89 pleural effusions, the proportion of transudative cases was higher in the massive category (50%), while in the moderate category, exudative cases were more prevalent (72.9%), with a statistically significant association [Table/Fig-7].
Association of quantity and septations on ultrasound thorax with Light’s criteria.
| Quantity and septations on USG | Light’s criteria | Total | Chi-square test | Significant value |
|---|
| Exudative | Transudative |
|---|
| Massive | Count | 6 | 15 | 21 | 10.931 | 0.009 |
| % Within groups | 10.2% | 50.0% | 23.6% |
| Moderate | Count | 43 | 11 | 54 | 17.501 | 0.001 |
| % Within groups | 72.9% | 36.7% | 60.7% |
| Minimal/Small | Count | 10 | 4 | 14 | 0.1961 | 0.6578 |
| % Within groups | 16.9% | 13.3% | 15.7% |
| Thin septations | Count | 27 | 1 | 28 | 16.604 | 0.001 |
| % Within groups | 96.43% | 3.57% | 100% |
| Thick septations | Count | 7 | 0 | 7 | 3.863 | 0.049 |
| % Within groups | 100% | 0 | 100% |
Effusions with anechoic findings (28/32) were predominantly managed with therapeutic aspiration, while four cases were managed with Intercostal Drainage (ICD) insertion. Effusions with non septate findings were managed with ICD insertion in 13 cases and therapeutic aspiration in six cases. Effusions with homogeneous echo findings were managed with ICD insertion in two cases and therapeutic aspiration in one case. Effusions with thin septations (26/28) were mostly managed with therapeutic aspiration, while two cases were managed with ICD insertion. All cases with thick septations (7/7) were managed with surgical interventions such as thoracotomy or Video-assisted Thoracoscopic Surgery (VATS) [Table/Fig-8].
Impact of ultrasound thorax findings on management of pleural effusion.
| Ultrasound thorax | Therapeutic pleural aspiration | ICD tube insertion underwater seal | Thoracotomy/VATS decortications |
|---|
| Effusion with anechoic finding | 28 | 4 | - |
| Effusion with non septate finding | 6 | 13 | - |
| Effusion with homogenous echoes finding | 1 | 2 | - |
| Effusion with thin internal septations | 2 | 26 | - |
| Effusion with thick septations | - | - | 7 |
The mean±SD of PCT in pleural fluid for the transudative pleural effusion group in the present study was 0.32±0.01 ng/mL, while for the exudative pleural effusion group it was 9.67±25.8 ng/mL, with a statistically significant difference (p=0.0001) [Table/Fig-9]. This study found that the mean±SD of PCT in pleural fluid was higher in the empyema group (49.2±41.9 ng/mL), followed by the parapneumonic effusion group (0.88±0.95 ng/mL), compared to other groups: malignancy group (0.59±0.21 ng/mL) and tuberculous group (0.50±0.20 ng/mL) [Table/Fig-10]. Additionally, one case of pulmonary thromboembolism showed a PCT level of 0.344 ng/mL.
Association of procalcitonin (PCT) levels with type of effusion (ng/mL).
| Variables | Light’s criteria | n | Mean | Std. Deviation |
|---|
| Procalcitonin (PCT) (ng/mL) | Exudative | 59 | 9.67 | 25.8 |
| Transudative | 30 | 0.32 | 0.01 |
| Mann-Whitney U | 17.000 | | | |
| Asymp. Sig. (2-tailed) | 0.0001 | | | |
Descriptive data of transudative effusion and exudative effusion groups regarding Procalcitonin (PCT) levels in pleural fluid (ng/mL).
| Procalcitonin (PCT) | Transudative group | Exudative group |
|---|
| CLD | CKD | HF | Malignancy | PPE | PE | TB | Empyema |
|---|
| Mean | 0.32 | 0.31 | 0.32 | 0.59 | 0.88 | 0.34 | 0.50 | 49.2 |
| Std. Deviation | 0.01 | 0.01 | 0.08 | 0.21 | 0.95 | - | 0.20 | 41.9 |
| Min value | 0.30 | 0.29 | 0.30 | 0.38 | 0.35 | 0.34 | 0.31 | 1.23 |
| Max value | 0.33 | 0.34 | 0.33 | 1.07 | 3.80 | 0.34 | 1.15 | 97.5 |
CLD: Chronic liver disease; CKD: Chronic kidney disease; HF: Heart failure; PPE: Parapneumonic effusion; PE: Pulmonary thromboembolism; TB: Tuberculosis
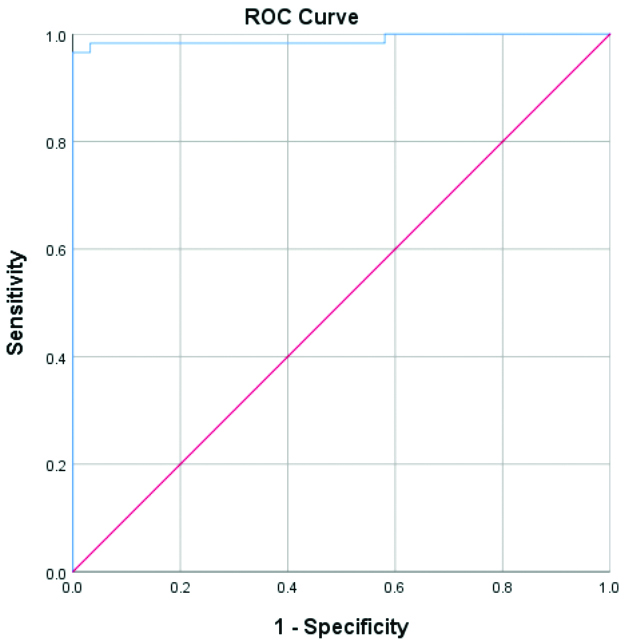
The Receiver Operating Characteristics (ROC) analysis for optimal discrimination between transudative and exudative effusions could be achieved at a cut-off point of 0.345 ng/mL, with an Area Under the Curve (AUC) of 0.989 (sensitivity: 96.6% and specificity: 96.8%) [Tables/Fig-11,12].
ROC curve of pleural fluid Procalcitonin (PCT) level values.
| Case processing summary |
|---|
| Light’s criteria | Valid N (list-wise) |
|---|
| Positive | 59 |
| Negative | 30 |
 |
Larger values of the test result variable (s) indicate stronger evidence for a positive actual state
| Pleural Procalciton (PCT) values |
|---|
| Cut-off | 0.345 ng/mL |
| Sensitivity | 96.6% |
| Specificity | 96.8% |
| AUC | 0.989 |
| p-value | <0.001 |
Discussion
In the present study, complex septate findings and thickened pleura were highly indicative of exudative effusions, while the anechoic appearance was characteristic of transudative effusions. Out of 89 patients, the majority of cases exhibited complex septate findings (39.3%). These results were consistent with studies conducted by Bandaru RC and Rachegowda N, and Ahmed MI et al., although the percentages differed from those in the present study [10,16]. Evans PT et al., and Wang CY et al., reported a higher prevalence of anechoic findings (71.5% and 71%, respectively), which contrasts with the results of the present study [6,7,15].
Ultrasound is more sensitive in detecting septations in pleural fluid compared to other radiological investigations. Among the complex septate pleural effusions in the present study, thin septations were predominant and were associated with exudates. These results were similar to those reported by El Wahsh RA et al., which indicated that thick septations were present in only 10% of cases [11].
In the current study, ultrasound assessment of pleural effusion quantity revealed that the majority had moderate effusions. These findings aligned with those of Bandaru RC and Rachegowda N, El Wahsh RA et al., and who reported a higher prevalence of moderate effusions [10,11]. Among the 89 cases, most pleural effusions were unilateral (83.1%) and more common on the right-side (55%). This is consistent with the findings of Bandaru RC and Rachegowda N, where right-sided effusions were predominant (75.4%), although El Wahsh RA et al., observed a predominance of left-sided effusions (17%) [10,11].
A total of 16 patients had thickened pleura, all of which were exudative pleural effusions and statistically significant, correlating with the study by Yang W et al., which indicated exudates [12]. Most of the thickened pleura findings were observed in empyema cases in this study, which correlated with the findings of El Wahsh RA et al., [11] and contrasted with those of Wang CY et al., who showed a majority of thickened pleura in the tuberculosis group, likely due to a greater number of TB cases in their study [15].
The present study highlights the utility of USG findings in distinguishing between types of effusions and demonstrates significant correlations between various ultrasound findings and pleural effusion types, as defined by Light’s criteria, aligning with previous research. Anechoic findings were strongly associated with transudative effusions, particularly in heart failure patients, consistent with studies by and Yang W et al., Wang CY et al., [12,15]. Complex septate findings were significantly linked to exudative effusions, especially in TB and empyema cases, supporting the findings of Ahmed MI et al., Soni NJ et al., and Brogi E et al., [16-18]. Although complex non septate findings were more common in exudative effusions, this correlation was not statistically significant, echoing the results of Evans PT et al., while differing from those of Wang CY et al., [15]. Homogeneous echoes, though observed only in exudative effusions, did not reach statistical significance, likely due to the small sample size, as noted by Soni NJ et al., and Brogi E et al., [17,18]. In the massive category, the proportion of transudative cases was higher and moderate effusions were more prevalent in exudative cases, similar to the findings of the study by Bandaru RC and Rachegowda N, [10].
According to the British Thoracic Society guidelines, procedures such as pleural aspiration and chest tube insertions should be performed under the guidance of thoracic USG to ensure a successful and safe procedure [19].
The management strategies for pleural effusions varied significantly based on the ultrasound characteristics of the effusions. Simple effusions with anechoic findings were primarily managed with therapeutic aspiration due to considerations such as unstable haemodynamics, comorbidities, cost-effectiveness and patient preference. Complex effusions, particularly those with thin septations and non septate findings, often required ICD tube insertion, necessitating more aggressive management with ICD tubes to ensure adequate drainage and prevent complications. In contrast, effusions with thick septations required more invasive procedures like thoracotomy or VATS to break down the septations and ensure complete drainage. Ultrasound findings play a crucial role in guiding these decisions, ensuring appropriate and effective treatment tailored to the specific characteristics of each effusion [18].
The mean±SD of PCT in pleural fluid in the exudative group was higher and statistically significant (p<0.05) compared to the transudative group. These results agreed with the study by Al-Aarag AH et al., which reported that the mean±SD of PCT in the pleural fluid of the transudative group was 0.186±0.063 ng/mL [9], while the exudative group had a mean of 1.387±1.566 ng/mL, which was statistically significant.
In the present study, no statistically significant differences in PCT concentrations were found within the transudative groups, as indicated by similar ranges and overlapping confidence intervals. However, among exudative effusions, levels were significantly higher in the empyema group, followed by the parapneumonic group, which were statistically significant compared to the other groups. This suggests the potential of PCT as a diagnostic marker to differentiate infectious causes such as empyema and parapneumonic effusions from other types.
The values of PCT in pleural fluid in the present study, compared to other studies, are depicted in [Table/Fig-13] [8,9,15,20-22].
Procalcitonin (PCT) levels in pleural fluid (ng/mL) in various studies [8,9,15,20-22].
| Authors name | Year and place of the study | Transudative effusions (ng/mL) | Exudative effusions (ng/mL) | Empyema (ng/mL) | Tuberculous effusions (ng/mL) | Malignant effusions (ng/mL) | PPE (ng/mL) |
|---|
| Al-Aarag AH et al., [9] | 2020, Egypt | 0.186±0.063 | 1.387±1.566 | - | 0.262±0.171 | 0.500±0.239 | 3.400±4.672 |
| Wang CY et al., [15] | 2011, Europe | 0.188±0.077 | - | 5.147±3.056 | 0.130±0.069 | 0.241±0.071 | 1.091±0.355 |
| Sharma A et al., [20] | 2021, India | - | - | 27.14±23.8 | 3.078±2.623 | 1.174±1.542 | |
| Kocer BC et al., [22] | 2015, Turkey | 0.08±0.05 | - | | 0.13±0.16 | 0.16±0.29 | 0.11±0.22 |
| El-Shimy WS et al., [21] | 2014, Egypt | 0.169±0.074 | - | - | 0.204±0.033 | 0.63±0.167 | 1.760±0.312 |
| Akkurt B et al., [8] | 2020, Eurasia | 0.47±1.45 | 0.90±2.93 |
| Present study | 2024, India | 0.32±0.01 | 9.67±25.8 | 49.2±41.9 | 0.50±0.20 | 0.59±0.21 | 0.88±0.95 |
The ROC analysis showed a cut-off value of 0.345 ng/mL in pleural fluid to differentiate between effusion types. In a study conducted by Al-Aarag AH et al., optimal differentiation between groups was achieved at a cut-off value of 0.19 ng/mL, with an AUC of 0.87, a sensitivity of 86% and a specificity of 54% [9].
Among the 89 patients, 32 had a PCT of less than 0.345 ng/mL, which included all transudates, while 57 had a PCT of more than or equal to 0.345 ng/mL. The association between these groups was statistically significant. Considering PCT as a potential biomarker for a state or syndrome (such as severe sepsis) rather than merely an indicator of a disease could help explain the elevated concentrations of PCT observed in all cases of empyema [20].
There was a positive association between Light’s criteria and PCT levels in pleural fluid and the correlation was statistically significant (p<0.05). This indicates that measuring PCT levels in pleural fluid can help differentiate between transudative and exudative effusions, providing an additional diagnostic tool alongside Light’s criteria and can also aid in the identification of infectious effusions.
Limitation(s)
The present study has some limitations, including a small number of cases. The thoracentesis process may have involved sampling bias, which could have affected the reliability of laboratory measurements. Interrater reliability during the operation of the ultrasound machine should also be considered. Additionally, the possible influence of treatment and the high cost of the PCT test cannot be excluded.
Conclusion(s)
The present study highlights the importance of ultrasound of the thorax as a valuable tool for characterising pleural effusions and guiding therapeutic interventions, ensuring precise and effective patient management. Complex septate findings and thickened pleura were highly indicative of exudative effusions, while the anechoic appearance characterised transudative effusions. Simple effusions with anechoic findings were primarily managed with therapeutic aspiration, while complex effusions with non septate findings and thin septations often necessitated ICD tube insertion. Those with thick septations required more invasive procedures, such as thoracotomy or VATS. Measurement of PCT in pleural fluid can be used to differentiate transudative from exudative pleural effusions and can also aid in identifying infectious effusions from other types.
CLD: Chronic liver disease; CKD: Chronic kidney disease; HF: Heart failure; PPE: Parapneumonic effusion; PE: Pulmonary thromboembolism; TB: Tuberculosis
Larger values of the test result variable (s) indicate stronger evidence for a positive actual state