Since ancient times, women’s roles in healthcare have included being nurses, caretakers and nurturers, in addition to their responsibilities for children, the sick, the elderly and disabled family members [1]. Women faced social opposition to taking up instrumental healing tasks as these roles became more complex and lucrative. In 1849, Elizabeth Blackwell became the first woman doctor [2]. Female physicians experience discrimination in the healthcare system based solely on their gender, often being mistaken for nurses by patients and ignored by professional colleagues and superiors. This kind of behaviour generates anxiety for women, who anticipate mistreatment and the threat of being female. Women doctors have to deal with prejudice and bias from patients and sometimes co-workers, who make them feel inferior because of their gender [3]. Female physicians spend more time with their patients and often use a patient-centered care approach; still, they are not regarded as equals to their male professional colleagues by patients [4,5].
Currently, there is increasing discussion about the ‘feminisation’ of the medical workforce, with women now forming the majority of medical students and over half of the general practitioner workforce. This is a relatively new phenomenon, as for centuries the professions of medicine and surgery were dominated by men, similar to other technical fields [6].
Previous studies have indicated that women physicians adhere to clinical guidelines, provide preventive care and offer psychosocial counselling more often to their patients compared to their male peers [7-9]. Additionally, some Western studies have revealed improved clinical outcomes for patients under the care of female physicians compared to those treated by male physicians [10-12].
A few studies have found that female patients prefer same gender physicians for psychosocial counselling and when visiting a Gynaecologist, Obstetrician, or Urologist. Additionally, women of childbearing age favour female physicians during delivery. Men also prefer a physician of the same gender when being treated by a urologist, general surgeon, or orthopaedic surgeon [13,14]. A significant proportion of women report a higher comfort level with female doctors and find it easier to discuss their medical issues and develop a rapport; moreover, female patients prefer female surgeons for their breast examinations [15,16].
Despite significant progress in surgery that parallels advancements in anaesthesia and anesthetic techniques, anesthesiology is still considered a “behind-the-scenes” specialty [17]. Patients who undergo surgery under anaesthesia often have very limited knowledge and poor perceptions regarding the role of anaesthesiologists. The Consumer Protection Act of 1986, which was passed in the Indian Parliament to protect the interests of consumers, awareness about anaesthesia was began to spread. However, the general public still has poor knowledge about the specialty and the role of anaesthesiologists as perioperative medical specialists [18]. Present study aimed to evaluate patients’ perspectives on the preference for the gender of medical professionals, such as surgeons and anaesthesiologists, for their elective surgeries. Study also determined the influence of demographic factors (such as gender, age, education and marital status), the type of surgery and geographical area on the preference for the gender of medical professionals (anaesthesiologists and surgeons), as well as patients’ awareness regarding the importance of anaesthesia and the role of anaesthesiologists.
Materials and Methods
An institution-based, cross-sectional study was conducted in the main operating theatre complex (Department of Anaesthesiology and Intensive Care) at the Adesh Institute of Medical Sciences and Research (AIMSR), Bathinda, a tertiary care hospital in a rural area of Northern India, from September 2023 to May 2024. After obtaining approval from the hospital ethics committee (Ref No. AU/EC_BHR/2K/23/488) and consent from the patients, the study was conducted on patients admitted for elective surgical interventions in specialties such as obstetrics/gynaecology, general surgery, orthopaedics, urology, otorhinolaryngology, ophthalmology and neurosurgery at our institute.
Inclusion criteria: Patients admitted for various surgeries in different specialties, under anaesthesia, monitored anaesthesia care, or sedation; patients over 18 years of age; and patients with sound mental status were included in the study.
Exclusion criteria: Patients with a history of dementia or cognitive impairment were excluded from the study.
Sample size: The sample size was calculated based on a previous study [19] and using a sample size calculator formula (Open Epi) with a confidence level of 95% and a margin of error of 5%. The sample size was determined to be 383 cases. With an attrition rate of 5%, additional cases were added, resulting in a final sample size of 403 cases, which was rounded off to 400.
Study Procedure
For the current study, a structured questionnaire was prepared, divided into three sections: patients’ demographic profile, surgical history and patients’ preferences regarding the gender of the surgeon. The questionnaire also assessed patients’ awareness on the importance of anaesthesia and the role of the anesthesiologist during the perioperative period. This proforma included questions regarding age, gender, education, marital status, geographical area (rural or urban), type of surgery, reasons for preferring one gender of surgeon or anesthesiologist over another and the importance of anaesthesia. The questionnaire was reviewed by 10 subject experts who found it valid, reliable, easy to understand and convenient to use. The questionnaire was administered to patients who attended the preanaesthesia clinic for preanaesthesia assessment. After completing the preanaesthesia check-up, patients were asked questions from the proforma (which was prepared in English) in their vernacular language by the authors, and appropriate answers were marked on the questionnaire sheet. Data were collected from a total of 400 patients, all of whom were included in the study.
Outcome measure: Data were collected from patients based on their answers to the questions in the questionnaire and the outcomes were assessed as follows:
To evaluate patients’ perspectives on the preference of the gender of medical professionals for their perioperative care.
To assess patients’ awareness of anaesthesia and their attitude toward anaesthesiologists as medical specialists.
Statistical Analysis
Data collected from all 400 patients were recorded in a Microsoft Excel sheet and analysed using the Microsoft Excel ToolPak data analysis software. Categorical variables were represented as percentages or means±SD. Comparisons of these variables were conducted using the Pearson’s Chi-square test or Fisher’s exact test. The final data were presented using numbers, frequencies, tables, charts and figures. The level of significance was set at p-value <0.05.
Results
Demographic data from a total of 400 patients were collected and analysed. The majority of patients were from rural areas, and most of them were married [Table/Fig-1].
Demographic data of the study patients (n=400).
| Variables | Frequency (%) |
|---|
| Gender |
| Male | 207 (51.7) |
| Female | 193 (48.3) |
| Age (years) |
| 18-49 | 165 (41.3) |
| 50-65 | 144 (36) |
| >65 | 91 (22.7) |
| Highest level of completed education |
| Illiterate/never attended school | 50 (12.5) |
| 5th standard | 61 (15.3) |
| 8th standard | 71 (17.8) |
| 10th to 12th standard | 105 (26.3) |
| 2-year technical diploma | 33 (8.3) |
| 4-year college degree | 65 (16.3) |
| Post-graduate degree (e.g., MD/PhD) | 15 (3.7) |
| Marital status |
| Married | 339 (84.7) |
| Single | 61 (15.3) |
| Residence |
| Rural | 305 (76.2) |
| Urban | 95 (23.8) |
Patient surgical profile and preference for one gender surgeon over the other one for elective surgery [Table/Fig-2]: When patients were asked about their preference for the gender of the surgeon for their elective surgery, 174 (43.5%) preferred a male surgeon, while only 99 (24.8%) preferred a female surgeon. Additionally, 127 (31.7%) did not have any preference for a particular gender of surgeon. Most patients, 280 (70%), wanted the surgeon to be competent enough to perform the required surgical procedure. Of the patients, 231 (57.8%) believed that both genders of surgeons are equally competent, 146 (36.5%) felt that male surgeons have superior surgical skills, and only 23 (5.8%) answered that female surgeons are better in surgical skills. However, most patients, 250 (62.5%), considered that female surgeons are more compassionate while treating patients.
Patient’s surgical profile and preference for gender of surgeon (n=400).
| Variables | Frequency (%) |
|---|
| Surgical speciality |
| General | 114 (28.5) |
| Obstetric/gynaecology | 45 (11.3) |
| Orthopaedic | 103 (25.8) |
| Urology | 81 (20.3) |
| Ophthalmology | 3 (0.8) |
| Neurosurgery | 14 (3.5) |
| Otorhinolaryngology | 40 (10) |
| Preference of gender of surgeon |
| Male | 174 (43.5) |
| Female | 99 (24.8) |
| No preference | 127 (31.7) |
| Reason for preferring/not prefering one particular gender surgeon |
| Feel more comfortable with same gender doctor | 197 (49.3) |
| Both gender doctor are equally competent | 127 (31.8) |
| Male doctor are more competent | 76 (19) |
| Physician-characteristic most important to patients |
| Gender | 0 |
| Compassion | 52 (13) |
| Competency | 280 (70) |
| Experience any other | 68 (17) |
| Which gender surgeons are having superior surgical skills |
| Male | 146 (36.5) |
| Female | 23 (5.8) |
| Both are equally competent | 231 (57.8) |
| Which gender doctors are more compassionate toward patients |
| Male | 150 (37.5) |
| Female | 250 (62.5) |
Patients knowledge about anaesthesia and role of anaesthesiologist [Table/Fig-3]: When asked about the requirement of anaesthesia, the majority of patients, 392 (98%), acknowledged the necessity of anaesthesia before surgical interventions. A total of 208 (52%) were not aware that anaesthesia is administered by anaesthesiologists. Most patients, 287 (71.8%), were unaware of the types of anaesthesia available. Furthermore, 330 (82.5%) of patients did not recognise anaesthesiologists as qualified specialist doctors, while only 70 (17.5%) considered anaesthesiologists to be specialist doctors. Most patients, 331 (82.8%), did not know that multiple co-morbidities increase the risk associated with anaesthesia. About two-thirds of patients did not have any preference regarding the gender of the anesthesiologist.
Awareness about anaesthesia and role of anaesthesiologist among study patients (n=400).
| Variables | Frequency (%) |
|---|
| Awareness about requirement of anaesthesia for surgery |
| Yes | 392 (98) |
| No | 8 (2) |
| Awareness about anaesthesia given by anaesthesiologist before start of surgery and not by surgeon |
| Yes | 192 (48) |
| No | 208 (52) |
| Awareness about types of anaesthesia |
| No | 287 (71.8) |
| Yes (How many types) | 113 (28.25) |
| Awareness that anaesthesiologists are specialist doctors like surgeons |
| Yes | 70 (17.5) |
| No | 330 (82.5) |
| Awareness that anaesthesiologists are equally qualified as that of surgeon |
| Yes | 70 (17.5) |
| No | 330 (82.5) |
| Awareness that multiple co-morbidities increase the risk of anaesthesia |
| Yes | 69 (17.2) |
| No | 331 (82.8) |
| Preference regarding gender of anaesthesiologist |
| Male | 59 (14.8) |
| Female | 64 (16) |
| No preference | 277 (69.3) |
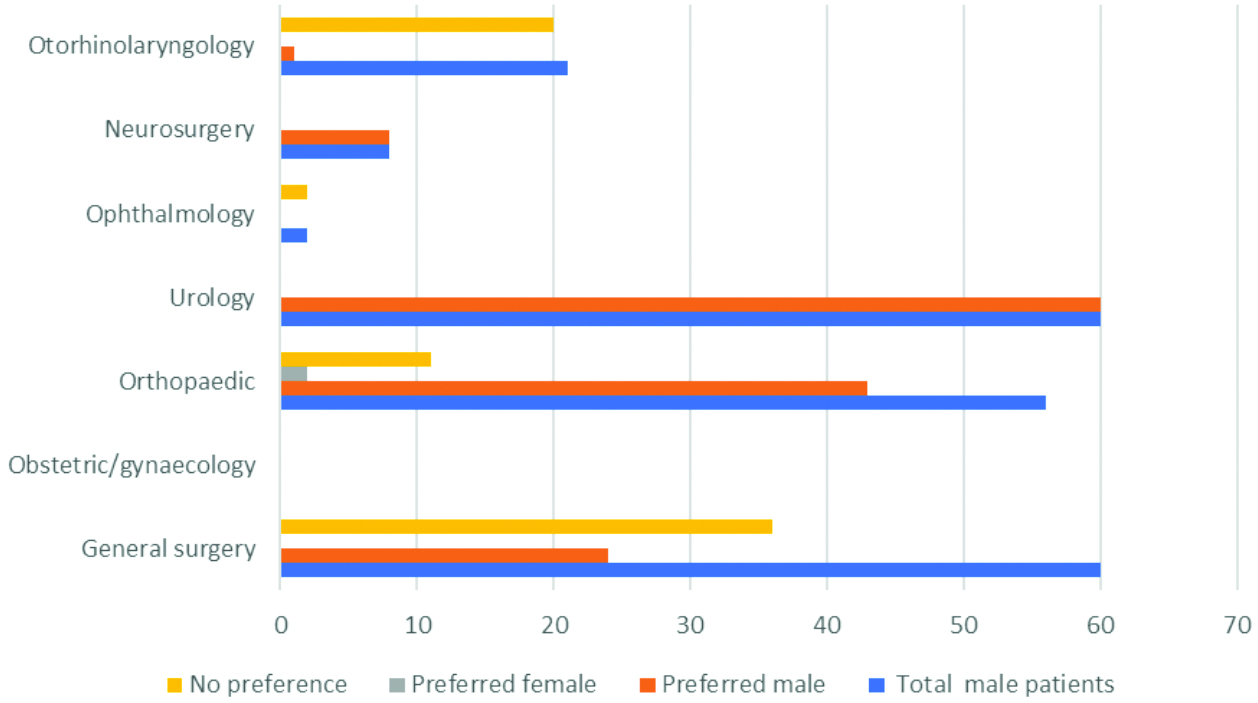
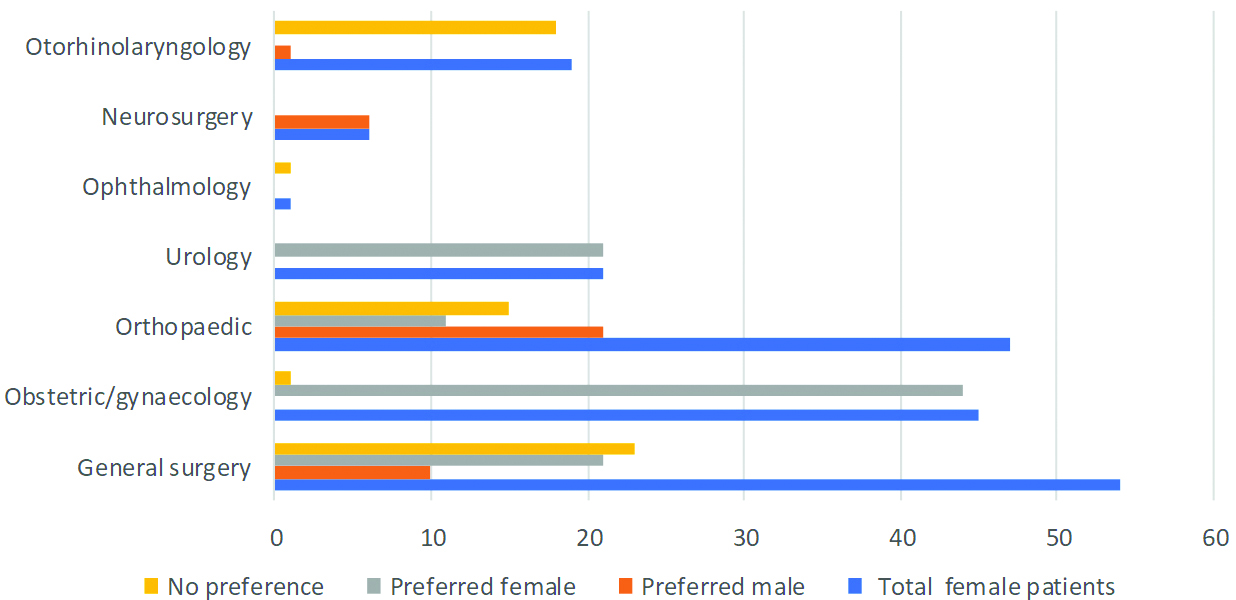
Influence of patients’ age, sex, education, marital status, residence, and type of surgery on choosing the gender of surgeon [Table/Fig-4]. The results of present study demonstrated that male patients preferred male surgeons, with only 1% of male patients preferring female surgeons [Table/Fig-5]. Female patients preferred female surgeons but were also open to male surgeons for their elective surgeries [Table/Fig-6]. Older patients, particularly those over 65 years of age, were less inclined to be operated on by female surgeons. The marital status of patients did not significantly affect their choice regarding the preference for the gender of the surgeon. Patients with educational qualifications below the 12th standard preferred to be operated on by male surgeons compared to those who were more educated (e.g., had a four-year college degree or doctorate). A significant difference in preference was observed between patients from rural and urban areas. Specialty-wise, urology and obstetrics/gynaecology patients preferred surgeons of the same gender, citing that they feel more comfortable being treated by a surgeon of the same gender. Orthopaedics and neurosurgery patients preferred male surgeons more frequently, stating that male doctors are perceived as more competent. Patients from general surgery, ophthalmology and otorhinolaryngology more frequently did not have a particular choice regarding the gender of the surgeon and considered that both genders of surgeons are equally competent.
Influence of patients age, sex, education, marital status, residence and type of surgery on choosing the gender of surgeon (Chi-square test).
| Variable | Frequency | Preferred male | Preferred female | No preference | p-value between preferred male and preferred female surgeon |
|---|
| Gender |
| Male | 207 (51.7) | 136 (65.7) | 2 (1.0) | 69 (33.3) | 0.001 |
| Female | 193 (48.3) | 38 (19.7) | 97 (50.3) | 58 (30) | 0.001 |
| Age (years) |
| 18-49 | 165 (41.3) | 12 (7.3) | 38 (23.0) | 115 (69.7) | 0.001 |
| 50-65 | 144 (36) | 22 (15.3) | 21 (14.6) | 101 (70.1) | 0.63 |
| >65 | 91 (22.7) | 25 (27.5) | 5 (5.5) | 61 (67.0) | 0.001 |
| Marital status |
| Married | 339 (84.7) | 160 (47.2) | 88 (26) | 91 (26.8) | 0.39 |
| Single | 61 (15.3) | 14 (23) | 11 (18) | 36 (59) | 0.39 |
| Education |
| Illiterate/never attended school | 50 (12.5) | 38 (76) | 6 (12) | 6 (12) | 0.0006 |
| 5th standard | 61 (15.3) | 34 (55.7) | 17 (27.9) | 10 (16.4) | 0.06 |
| 8th standard | 71 (17.8) | 43 (60.6) | 19 (26.7) | 9 (12.7) | 0.02 |
| 10th to 12th standard | 105 (26.3) | 38 (36.2) | 29 (26.6) | 38 (36.2) | 0.16 |
| 2-year technical diploma | 33 (8.3) | 9 (27.3) | 5 (15.1) | 19 (57.6) | 0.80 |
| 4-year college degree | 65 (16.3) | 9 (13.8) | 19 (29.2) | 37 (56.9) | 0.002 |
| Post-graduate degree (MD, PhD) | 15 (3.8) | 3 (20) | 4 (26.7) | 8 (53.3) | 0.42 |
| Residence |
| Rural | 305 (76.2) | 146 (47.9) | 68 (22.3) | 91 (29.8) | 0.003 |
| Urban | 95 (23.8) | 28 (29.5) | 31 (32.6) | 36 (37.9) | 0.16 |
| Surgery |
| General | 114 (28.5) | 34 (29.8) | 33 (28.9) | 47 (41.2) | 0.10 |
| Obs/Gynaecology | 45 (11.3) | 0 | 44 (97.8) | 1 (2.2) | 0.0001 |
| Orthopaedic | 103 (25.8) | 69 (67) | 2 (1.9) | 32 (31.1) | 0.0001 |
| Urology | 81 (20.3) | 60 (74) | 21 (26) | 0 | 0.02 |
| Ophthalmology | 3 (0.8) | 0 | 0 | 3 (100) | 1 |
| Neurosurgery | 14 (3.5) | 9 (64.3) | 0 | 5 (35.7) | 0.001 |
| Otorhinolaryngology | 40 (10) | 1 (2.5) | 0 | 39 (97.5) | 0.02 |
Preference of gender of surgeon in different surgical specialities among male patients.
Preference of gender of surgeon in different surgical specialities among female patients.
Discussion
This study was conducted to evaluate patients’ perspectives on the preference of the gender of surgeons, as well as their awareness regarding anaesthesia and attitudes toward anaesthesiologists. A total of 400 patients participated in the study, of which 207 (51.7%) were males and 193 (48.3%) were females. The minimum age was 18 years, and the maximum age was 85 years. Regarding the preference for a surgeon among male patients, out of 207 (51.7%), 136 (65.7%) preferred a male surgeon, only 2 (1.0%) preferred a female surgeon, and 69 (33.3%) did not have any particular preference regarding the choice of surgeon. Among the 193 (48.3%) females, 38 (19.7%) preferred a male surgeon, 97 (50.3%) preferred a female surgeon, and 58 (30%) did not have any choice. Fink M et al., concluded that both male and female patients prefer to see the same-gender primary care physician for primary care, although this phenomenon is relatively less prevalent among female patients [20]. AlSamhori J et al., found in the Jordanian population that while the percentage of study participants with no gender preference is acceptable, among those who did have a preference, about half preferred male surgeons, which was consistent with present study [21].
Regarding the reasons for preferring one gender of surgeon over the other, 197 (49.3%) respondents indicated that they feel more comfortable discussing their issues with a same-gender surgeon, 127 (31.8%) stated that both genders of surgeons are equally competent, and 76 (19%) considered that male surgeons are more competent compared to female surgeons. Alkhaldi LM et al., studied the Saudi Arabian population and found that the primary reason patients prefer a same-gender surgeon is comfort, followed by ease of communication [19]. The most important characteristic of a surgeon for patients is competency, with 280 (70%) of respondents emphasising this. It has been reported that there is a positive correlation between the surgical competency of a surgeon and patient outcomes [22]. A substantial number of patients, 146 (36.5%), considered that male surgeons have superior surgical skills compared to female surgeons (23 [5.8%]), although 231 (57.8%) believed that both genders are equally competent skill-wise. Female surgeons are often viewed as more compassionate than male surgeons; however, the preference for male surgeons is still more pronounced overall. Studies conducted in the West have found that patients operated on by female surgeons experience fewer complications and emergency visits postsurgery, as female surgeons tend to operate meticulously and spend more time counselling patients for postoperative follow-up [10].
Older and less educated patients from rural areas commonly prefer male surgeons [Table/Fig-4]. The reasons may include social, religious and cultural beliefs, as well as classic models of gender discrimination such as ‘role congruity theory,’ ‘lack of fit,’ and ‘think manager, think male’ [23-27]. Recently, a study from the West found bias against female orthopaedic surgeons [28].
Specialty-wise [Table/Fig-5,6], patients in obstetrics/gynaecology and urology prefer to consult same-gender surgeons. For sensitive surgeries, such as breast and genitourinary procedures, patients prefer same-gender surgeons, likely due to better communication and comfort between individuals of the same gender [29].
Patients who attended the preanaesthesia clinic before surgery had very limited knowledge about anaesthesia as a specialty and the role of anaesthesiologists as medical specialists [Table/Fig-3]. Although the majority of patients, 392 (98%), acknowledged the necessity of anaesthesia for painless surgery and lack of awareness during the procedure, only 192 (48%) were aware that anaesthesia is administered by anaesthesiologists. Very few, 113 (28.2%), were familiar with the types of anaesthesia, such as general and spinal. Not many patients, 70 (17.5%), regarded anaesthesiologists as specialists and qualified doctors, similar to surgeons. Only 69 (17.2%) were aware that multiple co-morbidities increase the perioperative risk associated with anaesthesia, and since their knowledge is limited, the majority, 277 (69.3%), did not have any preference regarding the gender of the anesthesiologist. One study also revealed that very few patients (16.5%) recognised the anesthesiologist’s role during surgical interventions [30]. In another study, 55.3% of patients were unaware of general anaesthesia, and 69.6% were unaware of regional anaesthesia as a technique. These findings are similar to present study [31].
From the current study, it was found that gender bias does exist in the medical profession, and patients have poor knowledge about the role of anaesthesiologists. Patients should be educated by medical professionals to change their outdated stereotypical thinking regarding gender roles, allowing them to gain maximum benefit from the surgical and anaesthesia faculty. Through effective communication during the preanaesthesia visit, patients should be made to understand the role of anaesthesiologists in perioperative care.
Limitation(s)
The current study has a few limitations. It was a single-centre study conducted at a medical institute in rural Northern India. Most of the study patients were from rural areas with limited educational backgrounds. Therefore, the findings of this study may not be directly applicable to urban settings or populations with higher literacy levels.
Conclusion(s)
Based on the findings of the current study, it can be concluded that gender bias does exist in the medical profession, as female surgeons are not acknowledged in the same way as their male colleagues in certain surgical specialties such as general surgery, orthopaedics and neurosurgery. However, in specialties like urology and gynaecology/obstetrics, patients prefer surgeons of the same gender, as it is easier and more comfortable to communicate with medical professionals of the same gender. Patients undergoing surgery in otorhinolaryngology and ophthalmology do not have a particular preference for the gender of surgeons. While patients scheduled for surgery under anaesthesia acknowledged the importance of anesthesiology, they demonstrated poor knowledge about the role of anaesthesiologists as perioperative medical specialists.