The alteration of biochemical pathways has been postulated as the basis of human diseases. It is an understatement to say that knowledge of the biochemistry of pathological tissues will prove useful in the diagnosis, grading, staging, treatment, and response evaluation of diseases. Analytical techniques existing for metabolic analysis, such as gas chromatography-mass spectrometry, liquid chromatography-mass spectrometry, and thin-layer chromatography, are performed with biological samples. In contrast, Nuclear Magnetic Resonance Spectroscopy (NMRS) can be done non invasively and in-vivo [1].
Proton MR spectroscopy has become an invaluable tool in the field of neuro-oncology for the characterisation of brain tumours. However, 31-phosphorus MR spectroscopy is a less-exploited potential tool that can elucidate the bioenergetics of normal and pathological tissues in-vivo. The lower concentration of phosphorus metabolites compared to protons in water molecules [2], along with the Larmor frequency of 31-phosphorus being 15 times lower than that of protons [3] leads to reduced sensitivity of the MR spectrum, which has limited the utility of 31-phosphorus MR spectroscopy in clinical practice.
The advantages of 31-phosphorus MR spectroscopy include the natural 100% abundance of Phosphorus-31 Nuclear Magnetic Resonance (31-P NMR) nuclei compared to carbon-13 and oxygen-17, making it easily detectable in spectroscopy. The 31-P spectrum comprises only a few resonance peaks, allowing for precise quantification of metabolites. No suppression techniques are necessary, as is the case with proton spectroscopy, due to the absence of dominant water or fat signals. Additionally, the reduced T1 relaxation time of phosphate metabolites at higher field strengths enables 31-phosphorus MR spectroscopy to be performed with short Repetition Times (TR) [4,5].
The phosphorus metabolites detected from the spectra include Phosphocreatine (PCr), Inorganic Phosphate (Pi), Adenosine Triphosphate (ATP), Phosphomonoesters (PME), and Phosphodiesters (PDE) [Table/Fig-1]. Direct estimation of metabolite concentrations from the spectra can be challenging due to factors such as coil sensitivity, field inhomogeneity, and relaxation time [6]. Hence, metabolite ratios are more commonly used in the evaluation of bioenergetics in both normal and pathological tissues.
The current study is aimed to obtain useful parameters from 31-phosphorus MR spectroscopy for the characterisation of various brain tumours and to evaluate the metabolic differences in various regions of pathological and normal brain tissue for comparison.
Materials and Methods
This cross-sectional study was undertaken at the Barnard Institute of Radiology, Madras Medical College, Chennai, Tamil Nadu, India, from December 2019 to December 2021. Local Institutional Ethical Committee approval was sought, and informed written consent was obtained from the study participants before the 31P-MR spectroscopic examination. The study adhered to the revised Declaration of Helsinki 2013.
Inclusion and Exclusion criteria: Consecutive patients undergoing routine clinical brain MRI who were detected to have a brain tumour were included in the study and followed with histopathology. Patients with smaller lesions that could not be evaluated using MR spectroscopy, histopathologically confirmed non-tumourous lesions, lesions with a predominant cystic or haemorrhagic component, and post-radiation lesions were excluded from the study. Eventually, 32 patients were included in the study. In addition, 10 healthy volunteers with no history of recent trauma, infarct, or migraine were also subjected to 31P-MR spectroscopy.
Study Procedure
MR spectroscopy and data acquisition: Conventional MRI was performed using the regular institutional protocol, followed by 31P-MR spectroscopy conducted in a 3-Tesla MRI (Skyra, Siemens Healthineers, Erlangen, Germany) using a customised birdcage 31P dual-tuned head coil (Rapid Biomedical, Wurzburg, Germany) equipped with quadrature polarisation capable of performing 1H decoupling. The coil used had an inner diameter of 26.5 cm and a housing length of 43 cm, weighing approximately 10 kg. For 31P spectroscopy, planning was done in a 3D Magnetic Resonance Spectroscopic Imaging (MRSI) sequence with full phase encoding, a flip angle of 90 degrees, a bandwidth of 1000 Hz, a repetition time of 1500 ms, an echo time of 2.3 ms, an acquisition delay of 2.3 ms, and an acquisition duration of 512 ms. Post-processing was performed on the Siemens workstation Syngovia. The voxel of interest was selected with an extrapolated 8×8×16 matrix and a field of view of 230×230 mm2, resulting in a voxel size of 40.0×40.0×25.0 mm3, and was placed in three selected areas of interest. The regions of interest for the study included contrast-enhancing tumours, non enhancing peritumoural oedema, and contralateral normal-appearing brain parenchyma.
The integral values and ratios undertaken for this study included Phosphodiesters (GPE and GPC), Gamma ATP (γ-ATP), Phosphocreatine (PCr), and Inorganic Phosphate (Pi), with metabolite ratios namely GPC/GPE, GPC/Pi, GPC/PCr, GPC/γ-ATP, GPE/Pi, GPE/PCr, GPE/γ-ATP, PCr/Pi, PCr/γ-ATP, and Pi/γ-ATP calculated. In addition, pH was derived by exploiting the chemical shift difference between pH-dependent Inorganic Phosphate (Pi) and a pH-independent reference peak, which was Phosphocreatine (PCr), using two different Henderson-Hasselbalch equations [7-9].
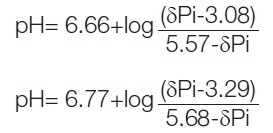
δpi- difference in chemical shift of Pi and PCr
Statistical Analysis
The statistical analysis was conducted using IBM Statistical Package for the Social Sciences (SPSS) Statistics for Windows, version 23.0 (Armonk, NY: IBM Corp). Categorical variables were evaluated using frequency analysis and percentage analysis, while the mean and Standard Deviation (SD) were used to assess continuous variables. The Mann-Whitney U test was used to determine the significant difference between the high-grade and low-grade gliomas (7 cases of Grade 2 and 5 cases of Grade 4 glioma). To compare metabolite ratios across various brain sites and with the controls, one-way ANOVA was utilised. A probability value of 0.05 was considered significant.
Results
A total of 32 patients, which included 13 females and 19 males, with a mean age of 41.7 years and 43.4 years respectively, were subjected to the study. The histopathological composition of the study group comprised 12 cases of glioma, 11 cases of metastasis, 3 cases of meningioma, 2 cases of ependymoma, and one case each of medulloblastoma, haemangioblastoma, oligodendroglioma, and pituitary macroadenoma. Representative images of pituitary macroadenoma and meningioma with the 31-P spectra are shown in [Table/Fig-2] and [Table/Fig-3a-c]. The control group comprised 10 subjects with a mean age of 40.6 years.
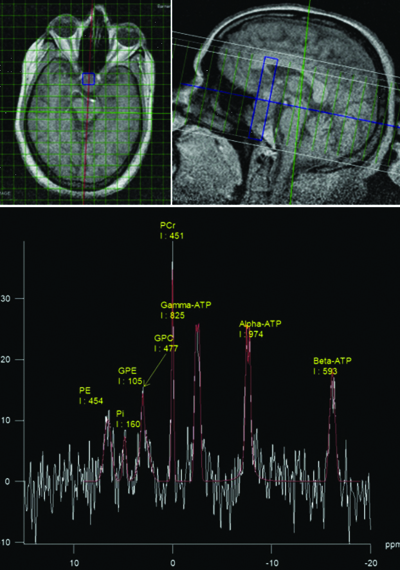
Case of pituitary macroadenoma with axial and sagittal chemical shift imaging of 31-P MR spectroscopy as well as the spectrum showing the distribution of various phosphorus metabolites and their integral values within the lesion.
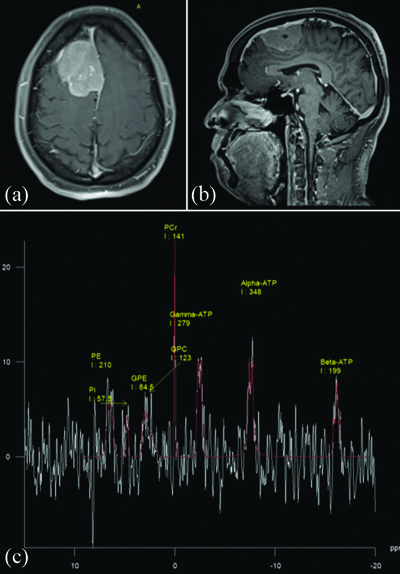
Histopatholoically proven case of transitional cell meningioma with (a and b) axial post contrast T1FS and 3D SPGR images showing homogenously enhancing extraaxial lesion from falx cerebri; (c) 31-P MR spectroscopy spectrum showing integral values of various phosphorus metabolites within the lesion.
The total scan time for 31-Phosphorus MR spectroscopy was about 15 minutes, including localisation. GPE/γATP and PCr/γATP showed a significant increase within the lesion and in the contralateral normal-appearing brain parenchyma compared to the controls, with p-values of 0.001 and 0.0005, respectively [Table/Fig-4]. PCr/Pi values were found to be very low in the control group compared to the lesion, periphery and the normal appearing brain parenchyma with a p value of <0.05 [Table/Fig-2] Increased ratio of Pi/ATP was observed within the normal cells compared to the tumour cells, but the difference was statistically insignificant.
Mean values with SD as well as p-values of pH and metabolite ratios of 31-Phosphorus MR spectroscopy in regions of interest including lesion, periphery, normal contralateral brain parenchyma, and controls. (Comparison between groups was done using One-way ANOVA).
| Metabolite ratios | Lesion (n=32)(Mean±SD) | Periphery (n=28) (Mean±SD) | Normal (n=30) (Mean±SD) | Control (n=10) (Mean±SD) | p-value |
|---|
| GPC/GPE | 2.2±2.5 | 2.2±4.0 | 2.9±1.2 | 0.9±0.3 | 0.464 |
| GPC/Pi | 1.3±0.9 | 1.7±1.5 | 2.2±1.3 | 0.7±0.2 | 0.031 |
| GPC/PCr | 1.4±0.4 | 2.2±0.63 | 2.5±0.67 | 2.0±0.4 | 0.871 |
| GPC/ATP | 1.5±0.7 | 2.0±0.5 | 2.3±0.57 | 3.0±0.6 | 0.822 |
| GPE/Pi | 0.9±0.5 | 1.7±0.1 | 1.4±0.9 | 1.4±0.5 | 0.167 |
| GPE/PCr | 1.1±0.4 | 2.7±0.61 | 1.1±0.3 | 4.3±1.6 | 0.021 |
| GPE/ATP | 1.3±0.9 | 2.9±0.63 | 1.3±0.9 | 6.3±1.9 | 0.001 |
| PCr/Pi | 2.1±1.4 | 2.6±2.1 | 3.1±2.4 | 0.3±0 | 0.002 |
| PCr/ATP | 0.9±0.4 | 0.9±0.3 | 0.9±0.3 | 1.5±0.2 | 0.0005 |
| Pi/ATP | 2.8±0.79 | 2.1±0.42 | 1.2±0.8 | 5.1±0.9 | 0.209 |
| pH | 7.12±0.12 | 7.07±0.07 | 7.04±0.06 | 7.06±0.03 | 0.233 |
PE: Phosphomonoester; Pi: Inorganic phosphate; GPE: Glycerophosphoethanolamine; GPC: Glycerophosphocholine; PCr: Phosphocreatine; ATP: Adenosine triphosphate
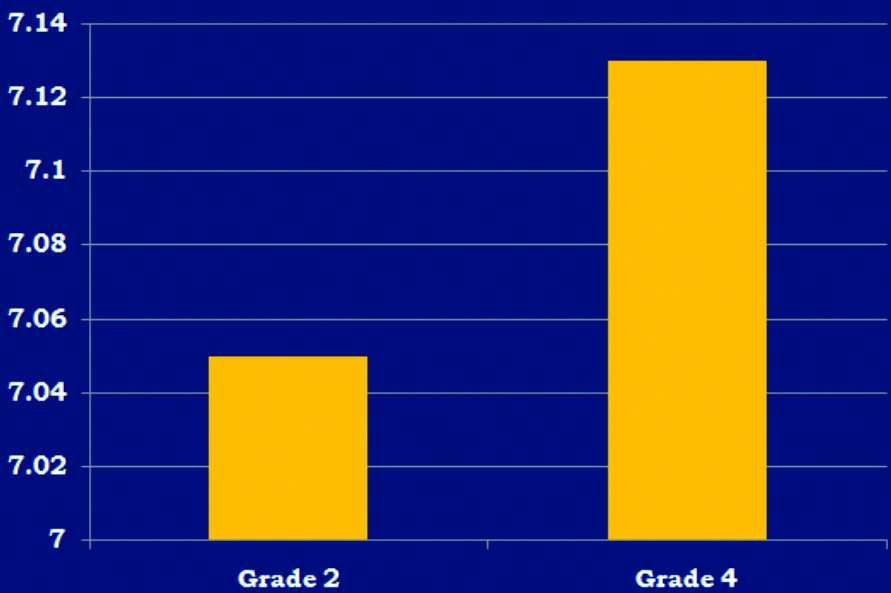
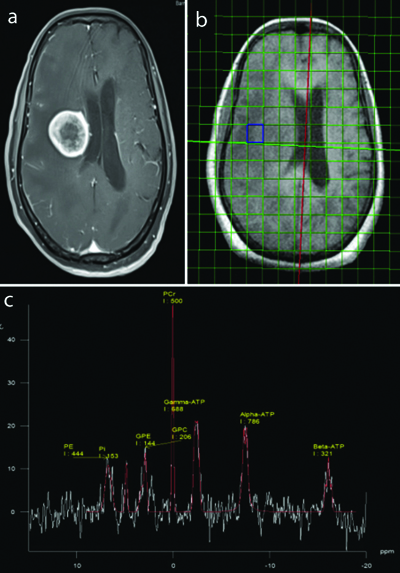
Glioma: In glioma, the intracellular pH recorded was highest within the lesion (pH 7.11±0.09), with decreasing pH in the controls (7.06±0.03) [Table/Fig-5]. When comparing high-grade and low-grade gliomas, no significant differences could be observed in the metabolite ratios [Table/Fig-6]. A representative image of glioma is shown in [Table/Fig-7]. However, an alkaline pH of 7.13 was observed in high-grade gliomas (n=7), compared to 7.05 in low-grade gliomas (n=5), with a significant p-value of 0.000439 [Table/Fig-8].
Mean pH and mean metabolite ratios (±SD) in control, glioma, metasatasis, meningioma and ependymoma groups. One-way ANOVA was used.
| Metabolite ratios | Control(n=10) | Glioma(n=12) | Metastasis(n=11) | Meningioma(n=3) | Ependymoma(n=2) |
|---|
| GPC/GPE | 0.9±0.3 | 1.68±1.28 | 2.23±1.26 | 2.03±1.27 | 2.15±1.8 |
| GPC/Pi | 0.7±0.2 | 1.1±0.55 | 1.12±0.87 | 1.27±1.08 | 2.06±1.68 |
| GPC/PCr | 2.0±0.4 | 2.07±1.66 | 1.3±0.4 | 0.99±0.31 | 0.50±0.29 |
| GPC/ATP | 3.0±0.6 | 2.28±1.02 | 1.23±1.2 | 1.78±1.11 | 0.35±0.11 |
| GPE/Pi | 1.4±0.5 | 1.04±0.47 | 1±0.77 | 0.64±0.03 | 0.97±0.02 |
| GPE/PCr | 4.3±1.6 | 0.97±0.11 | 1.63±0.99 | 1.13±0.86 | 0.27±0.09 |
| GPE/ATP | 6.3±1.9 | 1.07±0.61 | 1.77±0.97 | 2.27±1.87 | 0.22±0.13 |
| PCr/Pi | 0.3±0 | 2.12±1.28 | 1.82±1.1 | 2.13±0.99 | 3.77±1.2 |
| PCr/ATP | 1.5±0.2 | 0.84±0.27 | 0.84±0.25 | 1.65±0.73 | 0.77±0.22 |
| Pi/ATP | 5.1±0.9 | 1.7±1.18 | 1.52±0.79 | 3.47±1.86 | 0.22±0.13 |
| pH | 7.06±0.03 | 7.11±0.09 | 7.1±0.09 | 7.04±0.07 | 7.19±0.09 |
Metabolite ratios in Grade 2 and Grade 4 gliomas with their p-values.
| Metabolite ratios | Grade 2 glioma | Grade 4 glioma | p-value |
|---|
| GPC/GPE | 2±0.99 | 1.24±0.71 | 0.569 |
| GPC/Pi | 1.04±0.56 | 1.19±0.57 | 0.685 |
| GPC/PCr | 2.62±1.02 | 1.3±0.8 | 0.935 |
| GPC/ATP | 2.68±0.6 | 1.72±0.23 | 0.745 |
| GPE/Pi | 0.97±0.5 | 1.14±0.4 | 0.508 |
| GPE/PCr | 0.96±0.6 | 0.97±0.3 | 0.935 |
| GPE/ATP | 0.95±0.28 | 1.23±0.21 | 0.745 |
| PCr/Pi | 2.02±0.4 | 2.25±0.2 | 0.464 |
| PCr/ATP | 0.82±0.1 | 0.88±0.3 | 0.807 |
| Pi/ATP | 2.23±1.4 | 0.96±0.2 | 0.685 |
Mann-Whitney U test
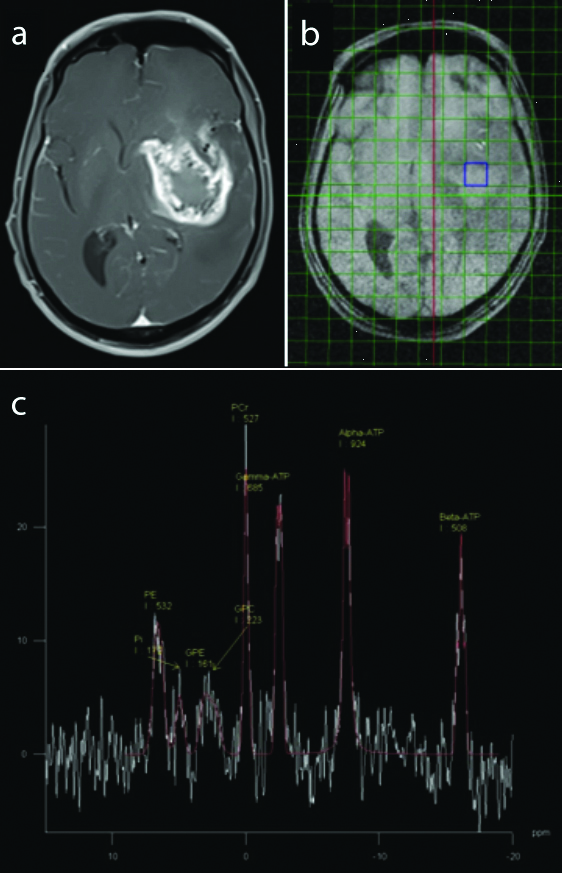
(a and b) Axial T1 Post contrast image shows heterogeneously enhancing lesion in the left temporoparietal region (Histopathologically proven Grade 4 glioma) (c) Axial chemical shift imaging of 31-P MR spectroscopy and the spectrum showing the distribution of various phosphorus metabolites and their integral values within the lesion. Calculated ratios showed decreased values of GPE/γATP, PCr/Pi, PCr/γATP and increased values of Pi/γATP and GPC/Pi within the lesion compared to the controls.
Bar chart showing mean pH values of Grade 2 (7.05) and Grade 4 glioma (7.13) with high-grade glioma demonstrating alkalinity with a significant p-value of 0.000439.
Mann-Whitney U test
Metastasis [Table/Fig-9a-c]: Integral value of γATP was significantly lower in brain metastasis compared to normal parenchyma. An alkalinisation tendency was observed within metastasis (pH 7.1±0.09) compared to controls (pH 7.06±0.03). Decreased metabolite ratios of GPE/γATP, GPE/PCr, PCr/γATP, and Pi/γATP were noted within the metastatic lesion in comparison to the control group.
a) Known case of primary lung carcinoma with Axial T1 post contrast image showing well-defined rim enhancing lesion in the region of right corona radiata (a and b) Axial chemical shift imaging; c) of 31-P MR spectroscopy and the spectrum showing the distribution of various phosphorus metabolites and their integral values within the lesion. Calculated ratios showed decreased values of GPE/γATP, GPE/PCr, PCr/γATP, and Pi/γATP within the lesion compared to the controls.
Discussion
31-Phosphorus spectra: 31-P MR spectroscopy provides three basic types of information, namely the energy pool—represented by PCr, Pi and three isotopomers of ATP; the synthesis and degradation of phospholipids, which constitute the cell membrane—represented by PME and phosphodiesters, respectively; and the quantification of intracellular pH and concentration of magnesium [10].
Due to the abundance of PCr in brain tissue, which leads to the dominant signal and relative stability, PCr is assigned a chemical shift of 0 ppm. PCr is a high-energy molecule indicative of mitochondrial oxidative capacity. To the left of PCr are inorganic phosphate and phospholipids. Inorganic phosphate, a compound directly involved in the synthesis of ATP, resonates at 6.5 ppm, while the phospholipids, including PME at 4.9 ppm and phosphodiesters at 2.6 ppm, are found in this region. PME, consisting of Phosphoethanolamine (PE) and Phosphocholine (PC), represents the anabolic activity of cell membranes, as they are the precursors of membrane synthesis. PDE, constituted by Glycerophosphoethanolamine (GPE) and GPC, indicates the catabolism of cell membranes [11]. The ratio of PME to PDE is indicative of cell membrane turnover [12].
The three peaks of ATP, the molecular currency of intracellular energy transfer, fall to the right of PCr (γ-, α-, and β-ATP from left to right at -7.8, -16.3, and -2.7 ppm, respectively). ATP, comprising the phosphate groups namely the alpha (α), beta (β), and gamma (γ) phosphates, is typically related to adenosine nucleotide. Energy for anabolic reactions is driven by the hydrolysis of the gamma phosphate group on the ATP molecules. The gamma phosphate has a higher energy of hydrolysis than either the alpha or beta phosphate [13]. Thus, the γ phosphate group was taken up for the study.
Intracellular pH: The 31-Phosphorus MR spectroscopy utilises the chemical shift difference between Pi and PCr, using Henderson-Hasselbalch equation for the estimation of pH [7-9]. Contrary to the prevailing theory that tumour cells exhibit acidic pH due to increased production of lactic acid during anaerobic glycolysis, studies using 31-P MR spectroscopy on brain tumours have demonstrated that the intracellular pH in these tumours is alkaline [14-16]. An alkaline pH is essential for the optimal functioning of various enzymes involved in the glycolytic pathway and also enhances key components of cellular proliferation, such as protein, Ribonucleic Acid (RNA), and Deoxyribonucleic Acid (DNA) synthesis. The alkaline environment within tumour cells is maintained by various transporters that move excess H+ ions into the extracellular space, thereby creating an extracellular acidic pH. This process enhances the invasiveness of tumour cells and promotes angiogenesis [14,17]. In coherence with many other similar studies [18-20], the present research demonstrated a tendency towards alkalinisation within tumour cells, with a mean pH of 7.1±0.12 compared to normal brain tissue.
The normal mean pH of healthy brain parenchyma was calculated to be 7.06±0.03, which corroborates with values from studies [7,21,22] but is relatively higher than those found in other studies [23-25], the mean of which was 7.005. Among all the tumours, the most alkaline pH was observed in ependymomas (7.19±0.09). Gliomas also exhibited an alkaline pH (7.12±0.09), similar to other studies [24,26] that reported values of 7.092±0.07 and 7.12±0.02, respectively. A gradual decrease in pH was observed within the peritumoural oedema and the contralateral normal brain. High-grade gliomas demonstrated a higher pH (7.13±0.06) compared to low-grade gliomas (7.05±0.02), with a p-value of 0.000439. Although meningiomas showed an alkaline pH (7.05), it was lower compared to a study that reported a pH value of 7.16±0.03 [26]. Metastatic tumours exhibited a significantly higher pH (7.10) compared to the non pathological brain, which is consistent with findings from a study that reported a pH of 7.12±0.12 [21] and another study that reported a pH of 7.45±0.56 [22], although all studies were statistically insignificant. Cases of metastasis showed a spectrum of values ranging from acidic to alkaline pH, which could possibly reflect the varied nature of the primary malignancy [22].
Membrane phospholipids metabolism: Membrane phospholipids constitute the cell membrane and are involved in maintaining structural integrity, signal transduction mechanisms, regulation of cellular proliferation, and lipoprotein metabolism, thus playing a major role in tumourigenesis [27,28]. The fixed structural integrity of phospholipids precludes the direct estimation of membrane phospholipids; however, the measurement of precursors and degradation products becomes feasible with 31 Phosphorus MR spectroscopy [29,30]. Since various studies have shown the significant role of PME, the present study attempts to investigate the role of individual phosphodiesters, namely glycerol-3-phosphoethanolamine and glycerol-3-phosphocholine, which contribute to cell wall structure. An increased concentration of these compounds indicates the presence of breakdown products of membrane metabolism. PME and PDE with respect to energy-related metabolites (Pi, PCr, and ATP) reflect tumour growth and cell reproduction rates. The present study showed decreased values of GPE/ATP in brain tumours compared to normal brain, indicating an existing catabolic state.
Gliomas exhibited a decreased ratio of GPE/γATP, and metastatic tumours revealed reduced levels of GPE/γATP and GPE/PCr in comparison with normal brain parenchyma, implying a state of increased catabolism within tumour cells [20,31,32]. A decreased ratio of PDE/Pi was found within gliomas, although it was statistically insignificant [22,24]. In contrast, present study showed increased levels of GPC/Pi, which is one of the components of phosphodiesters, within gliomas compared to normal brain parenchyma. This possibly indicates varying roles of GPC and GPE, which need to be elucidated.
Cellular energy metabolism: Cellular energy metabolism is a major determinant of cellular proliferation and cell death [28,33]. ATP drives many important cellular processes, such as protein synthesis, synaptic signalling, active transport, and muscle contraction. The intracellular concentration of ATP remains relatively constant, as the rate of ATP generation is linked to the rate of ATP hydrolysis, indicating a high turnover [34]. Under normal conditions, ATP is generated predominantly from oxidative phosphorylation within the mitochondria and minimally from the process of glycolysis within the cytosol.
The ATP synthase is a transmembrane protein complex that permits protons to enter the intermembrane space through its concentration gradient and uses the released energy from the process of oxidative phosphorylation to synthesise ATP from Adenosine Diphosphate (ADP) and Inorganic Phosphate (Pi) [35]. In addition to oxidative phosphorylation, Creatine Kinase (CK) plays a key role in maintaining cellular energy homeostasis in many metabolically demanding tissues, such as muscle and brain.
During situations of high energy demand or reduced mitochondrial ATP generation, CK facilitates the rapid transfer of a high-energy phosphate group from PCr to ADP through a forward reaction. Consequently, PCr levels decline when ATP levels are minimal, such as during the early onset of heavy exercise and severe ischaemia. Therefore, PCr can be regarded as an energy reservoir that is important for maintaining ATP levels during physiological and pathological states. Contrary to the behaviour of normal cells, tumour cells have a higher demand for metabolic energy [22,26,33] and predominantly rely on the process of anaerobic glycolysis, even in the presence of adequate oxygen in the intracellular milieu [10,13]. The increased demand for ATP by tumour cells is met by increasing the transport of glucose into the cells and by accelerating glycolytic processes [15,17,28]. The present study showed a decreased PCr/ATP ratio in tumour cells compared to normal brain tissue, indicating a negative energetic status within the tumour cells. The PCr/Pi ratio was also comparatively lower in tumour cells, depicting reduced oxidative capacity in comparison to the surrounding tissue and the contralateral normal brain, although this finding was not statistically significant in the present study. This is consistent with findings from other similar studies [20,22,31,32,36]. The lack of ATP causes CK to buffer ATP, resulting in a decrease in PCr and an increase in creatine and Pi. Hence, the Pi/ATP ratio can be used to represent ATP turnover. In line with this theory, brain tumours demonstrated highest values within the tumour compared to the contralateral normal-appearing brain parenchyma. Gliomas showed reduced levels of PCr/Pi and PCr/γATP and increased levels of Pi/ATP compared to normal brain parenchyma, implying increased energy expenditure and ATP turnover, coupled with decreased oxidative capacity and a negative energetic state of tumour cells, possibly due to the presence of necrosis within the tumour cells. High-grade and low-grade gliomas could not be differentiated based on their energetic status.
In the present study, metastatic tumours showed decreased integral values of γATP compared to the controls, with a p-value of 0.002, and also a decreased Pi/ATP ratio, which was contradictory to another study that reported a significant increase in Pi/ATP in the tumour group, including both glioma and metastasis (0.28±0.09) [21]. This discrepancy may indicate an increased propensity for necrosis. Reduced levels of PCr/γATP were observed in metastatic tumours, indicating a negative energetic state.
Limitation(s)
Fewer subjects were included, so definitive conclusions and their clinical roles could not be established. Smaller lesions, less than 2 cm, cannot be subjected to 31 Phosphorus MR spectroscopy, and the increased time required, in addition to the conventional MR sequences, can be limiting, particularly in certain groups of patients. Further studies are needed to establish the role of 31-Phosphorus MR spectroscopy as a complementary tool in the evaluation of brain tumours, particularly in cases of uncertainty and in patients with chronic renal diseases where contrast studies may be contraindicated. The main limitation of 31-phosphorus spectroscopy is the limited availability of 31-phosphorus coils due to their extreme cost, which hinders further research and clinical utility.
Conclusion(s)
A 31-Phosphorus MR Spectroscopy appears to be a powerful non invasive tool in the study of energy metabolism in both normal and pathological brains, thus providing a new perspective in the field of metabolomics. Additionally, it can be used in the follow-up of treatment responses and in exploring future dimensions in targeted treatment of brain tumours. The intracellular pH of brain tumours showed alkalinisation and was also found to be helpful in differentiating high-grade from low-grade gliomas. Metabolite ratios such as GPE/γATP and PCr/γATP were found to be useful in differentiating various tumours, similar to other studies. The present study has raised the possibility of varying roles of GPC and GPE, which need further elucidation. Metabolic differences existed in regions of brain distant from the brain tumour which appear normal on imaging in our study reflecting the biochemical alterations in the whole brain.
PE: Phosphomonoester; Pi: Inorganic phosphate; GPE: Glycerophosphoethanolamine; GPC: Glycerophosphocholine; PCr: Phosphocreatine; ATP: Adenosine triphosphate
Mann-Whitney U test