Since the hamstring muscles are the primary muscles responsible for hip extension and knee flexion, they are essential for the regular performance of functional activities [1,2]. As a monoarticular muscle that shares a tendon with the biceps femoris, the hamstring is typically tested in conjunction with other hamstrings [3]. Hamstring shortening is a crucial mechanical marker for hamstring strain injuries and is often associated with an imbalance in the strength and stiffness of the hamstring and quadriceps muscles [4]. Muscle tension is believed to be a barrier to an individual’s maximum performance, including daily activities [5].
Adaptive shortening of the muscle’s non contractile and contractile components is referred to as “muscle tightness.” Even under normal conditions, the bi-articular postural muscle known as the hamstring tends to shorten [6]. It is a superficial two-joint muscle that can become exceedingly tight, leading to a range of postural problems and muscular imbalances [7]. Clinical data indicate that hamstring tightness may be associated with alterations in the transverse spine curvatures during trunk flexion, affecting the lumbar pelvic rhythm [8]. Short hamstrings may increase the risk of spinal damage from mechanical stresses [9].
The current study aimed to fill the information gap by comparing the effectiveness of KCAT and BLR in terms of objective outcome measures that reflect changes in muscle and tissue levels.
Materials and Methods
A randomised clinical trial was conducted in the Orthopaedic Manual Therapy Department of KAHER Institute of Physiotherapy, Belagavi, Karnataka, India, from December 2022 to June 2023. Institutional Ethical Committee approval was obtained (Ref No: KIPT/706/12/05/22) and the trial was registered under the Clinical Trial Registry - India (CTRI/2023/08/057073).
Inclusion criteria: Participants aged 18-25 years with asymptomatic hamstring tightness, regardless of gender, were included. Individuals with a lack of active knee extension greater than 15 degrees were also included [8].
Exclusion criteria: The exclusion criteria included: 1) Participants with recent musculoskeletal injuries; 2) Recent injuries around the hip and knee joints.
Sample size: The minimum sample size required for the execution of the research study was 30, with 15 participants in each group.
Study Procedure
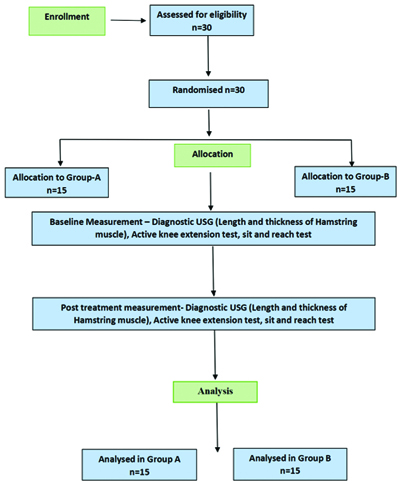
Demographic data was obtained and all participants received the therapy. Participants were divided into two groups. Simple randomisation was performed using the sealed envelope method. Participants were blinded to the study and randomised into two groups: the KCAT group (group A) and the BLR group (group B). The Consolidated Standards of Reporting Trials (CONSORT) flow diagram for recruitment of participants has been given in [Table/Fig-1].
CONSORT flow diagram for recruitment of participants.
Intervention details:
Group A: (Hamstring Fascia Activation through KCAT Technique) [Table/Fig-2a]. The participant was positioned prone, lying on a plinth with the hip and knee in a neutral position. The therapist stood beside the leg to be tested. The therapist activated the hamstring fascia by tapping on the hamstring area for 7-8 seconds. After this, the patient was asked to flex the knee while the therapist applied pressure on the tendo Achillis until the patient could flex fully and then extend. This was done for 10 minutes. The same procedure was performed on the opposite lower extremity [20]. The duration of the intervention was two weeks, with three sessions per week, each lasting 15 minutes.
a) Kinetic Chain Activation Technique (KCAT). b) Mulligan’s Bent Leg Raise (BLR).
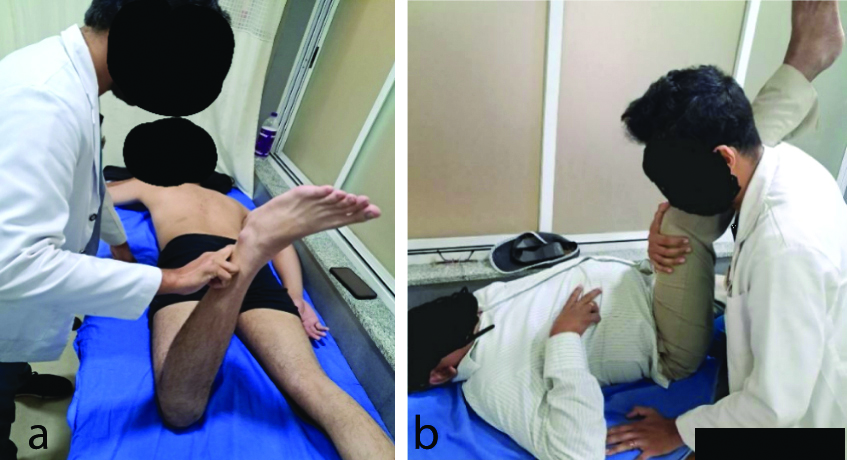
Group B: Mulligan’s Bent Leg Raise (BLR) [Table/Fig-2b].
The therapist stood at the side of the subject. The participant’s hip and knee were in 90° flexion, with the heel off the plinth. The therapist’s position was a walking stance, lateral to the affected side. The participant held the plinth with the unaffected side and placed the hand on the affected side under their head and neck. The therapist’s inner hand was placed underneath, proximal to the popliteal fossa. The therapist grasped the lower end of the thigh with both hands. Longitudinal traction was applied along the long axis of the femur, taking the hip into flexion until the first resistance was felt. If the subject complained of stretch pain, then a contract-relax technique was applied by asking the subject to gently push against the therapist’s shoulder for five seconds. The leg could then be taken into a new pain-free range. If the subject experienced pain, the hip was moved into abduction or external rotation, or more traction was given before further hip flexion was added. The end position was maintained for about 20 seconds. This technique was repeated three times [21,22]. The duration of the intervention was two weeks, with three sessions per week, each lasting 15 minutes.
Preassessment of the thickness and length of the hamstring muscles was performed using ultrasonography, while the active knee extension test and SRT test were also applied. Post-assessment data were calculated immediately after the intervention.
Active knee extension test: The therapist was positioned to the side of the leg being evaluated. To minimise pelvic rotation, the opposite extremity was secured with a strap. The patient lay supine with their hips flexed at 90 degrees. The participant was instructed to extend their knee as far as possible and a universal goniometer was used to assess the result [23].
Sit and reach test: In addition to the subject or participant, the therapist occupied the following position: the patient sat on the floor with their dominant leg extended and the other leg flexed. Their bare feet were positioned flat against a box at a 90-degree angle to the floor. While reaching forward, the subjects performed the sit and reach with their palms toward the floor. If the participant experienced any pain or stiffness in their posterior thigh, they were instructed to stop. The distance travelled was measured in centimetres for the five seconds that this posture was held. The highest score from the two assessments taken before and after the intervention was used to analyse the final results [24].
Statistical Analysis
The collected data were summarised using descriptive statistics: frequency, percentage, mean and Standard Deviation (SD). To compare the length and thickness of the hamstring, AKT and SRT test within groups, the paired t-test was used. For comparisons between groups, the independent t-test was employed. The Shapiro-Wilk test was conducted to assess the normality of the data. A p-value of less than 0.05 was considered significant. Data were analysed using Statistical Package for the Social Sciences (SPSS) software (SPSS Inc.; Chicago, IL) version 29.0.10.
Results
In the current study, 16 males and 14 females were included, with a mean age of 23.8±0.47 years and a mean Body Mass Index (BMI) of 24.2±0.56 kg/m2. There was a significant difference between the pre- and post-treatment values in both groups [Table/Fig-3]. There was a significant difference between the pre- and post-treatment values in both groups [Table/Fig-4].
Comparison of pretest and post-test scores of thickness of hamstring muscle in right leg using diagnostic ultrasonography within the two groups.
| Groups | Times | Mean±SD | SD | Mean diff. | SD diff. | Effect size | t-value | p-value |
|---|
| Group-A | Pre | 16.19±1.17 | 1.17 | 1.51 | 0.46 | 3.26 | 13.025 | 0.001* |
| Post | 17.69±1.15 | 1.15 |
| Group-B | Pre | 16.13±0.99 | 0.99 | 1.45 | 0.57 | 2.54 | 9.844 | 0.001* |
| Post | 17.59±0.91 | 0.91 |
Paired sample t-test
Comparison of pretest and post-test scores of thickness of hamstring muscle in left leg using diagnostic ultrasonography within the two groups.
| Groups | Times | Mean±SD | Mean diff. | SD diff. | Effect size | t-value | p-value |
|---|
| Group-A | Pre | 16.48±1.20 | 1.30 | 0.65 | 1.99 | 7.961 | 0.001* |
| Post | 17.78±1.15 |
| Group-B | Pre | 16.16±1.17 | 1.67 | 0.89 | 1.88 | 7.275 | 0.001* |
| Post | 17.83±0.87 |
Paired sample t-test
There was a significant difference between the pre- and post-treatment values in both groups as determined by the paired sample t-test [Table/Fig-5]. There was a significant difference between the pre- and post-treatment values in both groups as determined by the paired sample t-test [Table/Fig-6]. There was a significant difference between the pre- and post-treatment values in both groups as determined by the paired sample t-test [Table/Fig-7].
Comparison of pretest and post-test scores of active knee extension test of right leg within the two groups.
| Groups | Times | Mean±SD | Mean diff. | SD diff. | Effect size | t-value | p-value |
|---|
| Group-A | Pre | 37.44±6.00 | 9.44 | 4.43 | 2.13 | 8.528 | 0.001* |
| Post | 46.88±4.51 |
| Group-B | Pre | 38.67±6.15 | 9.53 | 3.74 | 2.55 | 9.875 | 0.001* |
| Post | 48.20±5.23 |
Paired sample t-test was used
Comparison of pretest and post-test scores of active knee extension test of left leg within two groups.
| Groups | Times | Mean±SD | Mean diff. | SD diff. | Effect size | t-value | p-value |
|---|
| Group-A | Pre | 39.38±6.27 | 9.00 | 5.43 | 1.66 | 6.632 | 0.001* |
| Post | 48.38±4.60 |
| Group-B | Pre | 41.27±5.76 | 7.73 | 3.08 | 2.51 | 9.720 | 0.001* |
| Post | 49.00±6.16 |
Paired sample t-test
Comparison of pretest and post-test scores of sit and reach test in two groups.
| Groups | Times | Mean±SD | Mean diff. | SD diff. | Effect size | t-value | p-value |
|---|
| Group-A | Pre | 19.94±2.95 | 5.06 | 2.67 | 1.90 | 7.584 | 0.001* |
| Post | 25.00±1.10 |
| Group-B | Pre | 20.53±2.47 | 5.07 | 3.01 | 1.68 | 6.517 | 0.001* |
| Post | 25.60±1.45 |
Paired sample t-test
There was a significant difference between the pre- and post-treatment values in both groups as determined by the paired sample t-test [Table/Fig-8]. There was a significant difference between the pre- and post-treatment values in both groups as determined by the paired sample t-test [Table/Fig-9].
Comparison of pretest and post-test scores of the length of Hamstring muscle in the right leg in two Groups using diagnostic ultrasonography.
| Groups | Times | Mean±SD | Mean diff. | SD diff. | Effect size | t-value | p-value |
|---|
| Group-A | Pre | 4.34±0.19 | 0.63 | 0.20 | 3.12 | 12.476 | 0.001* |
| Post | 4.98±0.12 |
| Group-B | Pre | 4.32±0.20 | 0.69 | 0.18 | 3.87 | 14.989 | 0.001* |
| Post | 5.01±0.12 |
Comparison of pretest and post-test scores of length of hamstring in left leg in two groups.
| Groups | Times | Mean±SD | Mean diff. | SD diff. | Effect size | t-value | p-value |
|---|
| Group-A | Pre | 4.44±0.22 | 0.74 | 0.42 | 1.77 | 7.089 | 0.001* |
| Post | 5.18±0.36 |
| Group-B | Pre | 4.43±0.18 | 0.83 | 0.38 | 2.15 | 8.328 | 0.001* |
| Post | 5.26±0.30 |
The mean value in group A (post-intervention) was 17.69±1.15, which is higher than the pre-intervention value (16.19±1.17), but the difference was not statistically significant. A similar observation was noted for group B [Table/Fig-10].
Comparison of pretest and post-test scores of thickness of hamstring muscle in right leg using diagnostic ultrasonography between the two groups.
| Time | Group | Mean±SD | t-value | p-value |
|---|
| Pre | Group-A | 16.19±1.17 | 0.139 | 0.891 |
| Group-B | 16.13±0.99 |
| Post | Group-A | 17.69±1.15 | 0.285 | 0.778 |
| Group-B | 17.59±0.91 |
Independent t-test was used
The mean value in group A (post-intervention) was 17.78±1.15, which is higher than the pre-intervention value (16.48±1.20), but the difference was not statistically significant. A similar observation was noted for group B [Table/Fig-11].
Comparison of pretest and post-test scores of thickness of hamstring muscle in left leg using diagnostic ultrasonography between the two groups.
| Time | Group | Mean±SD | t-value | p-value |
|---|
| Pre | Group-A | 16.48±1.20 | 0.753 | 0.457 |
| Group-B | 16.16±1.17 |
| Post | Group-A | 17.78±1.15 | 0.141 | 0.889 |
| Group-B | 17.83±0.87 |
Independent t-test was used
The mean value in group A (post-intervention) was 46.88±4.51, which is higher than the pre-intervention value (37.44±6.00), but the difference was not statistically significant. A similar observation was noted for group B [Table/Fig-12].
Comparison of pretest and post-test scores of active knee extension test in right leg between the groups.
| Time | Group | Mean±SD | t-value | p-value |
|---|
| Pre | Group-A | 37.44±6.00 | 0.563 | 0.578 |
| Group-B | 38.67±6.15 |
| Post | Group-A | 46.88±4.51 | 0.757 | 0.455 |
| Group-B | 48.20±5.23 |
Independent t-test
The mean value in group A (post-intervention) was 48.38±4.60, which is higher than the pre-intervention value (39.38±6.27), but the difference was not statistically significant. A similar observation was noted for group B [Table/Fig-13].
Comparison of pretest and post-test scores of active knee extension test in left leg between the groups.
| Time | Group | Mean±SD | t-value | p-value |
|---|
| Pre | Group-A | 39.38±6.27 | 0.873 | 0.390 |
| Group-B | 41.27±5.76 |
| Post | Group-A | 48.38±4.60 | 0.321 | 0.750 |
| Group-B | 49.00±6.16 |
The mean value in group A (post-intervention) was 25.00±1.10, which is higher than the pre-intervention value (19.94±2.95), but the difference was not statistically significant. A similar observation was noted for group B [Table/Fig-14].
Comparison of pretest and post-test scores of sit and reach test between the two groups.
| Time | Group | Mean±SD | t-value | p-value |
|---|
| Pre | Group-A | 19.94±2.95 | 0.607 | 0.549 |
| Group-B | 20.53±2.47 |
| Post | Group-A | 25.00±1.10 | 1.303 | 0.203 |
| Group-B | 25.60±1.45 |
Independent t-test
The mean value in group A (post-intervention) was 4.98±0.12, which is higher than the pre-intervention value (16.48±1.20), but the difference was not statistically significant. The mean value in group B (post-intervention) was 17.83±0.87, which is higher than the pre-intervention value (16.16±1.17), but the difference was not statistically significant [Table/Fig-15].
Comparison of pretest and post-test scores of the length of Hamstring muscle in the right leg between two groups using diagnostic ultrasonography.
| Time | Group | Mean±SD | t-value | p-value |
|---|
| Pre | Group-A | 4.34±0.19 | 0.339 | 0.737 |
| Group-B | 4.32±0.20 |
| Post | Group-A | 4.98±0.12 | 0.879 | 0.387 |
| Group-B | 5.01±0.12 |
Independent t-test
The mean value in group A (post-intervention) was 5.18±0.36, which is higher than the pre-intervention value (4.44±0.22), but the difference was not statistically significant. The mean value in group B (post-intervention) was 5.26±0.30, which is higher than the pre-intervention value (4.43±0.18), but the difference was not statistically significant [Table/Fig-16].
Comparison of pretest and post-test scores of the length of Hamstring muscle in the left leg between two groups using diagnostic ultrasonography.
| Time | Group | Mean±SD | t-value | p-value |
|---|
| Pre | Group-A | 4.44±0.22 | 0.059 | 0.954 |
| Group-B | 4.43±0.18 |
| Post | Group-A | 5.18±0.36 | 0.714 | 0.481 |
| Group-B | 5.26±0.30 |
Discussion
All these parameters indicate that the intervention showed significant improvement in both groups. The study included 30 participants, both male and female, aged between 18 and 25 years, who had asymptomatic hamstring tightness. The mean age of the subjects was 23.8 years. There were 10 males and five females in group A and eight males and seven females in group B. Smith J and Doe A conducted a study to determine the prevalence of hamstring strains among college students. A total of 50 participants, consisting of two men and 48 women, underwent evaluation for hamstring tightness. The results indicated that the AKE angles varied between 30% and 45% and it was observed that 96% of the girls and 4% of the males fell into this category [25]. Jones M and Patel K experimented with 70 volunteers, who were divided into two groups. Each group was assigned a distinct form of myofascial release and neurodynamic sliding technique to practice for two months. The participants’ hamstring flexibility was evaluated before and after the intervention using an AKE test and a functional rating. Both groups showed a significant improvement in flexibility; however, the neurodynamic sliding method was found to be more effective [26]. Further research is required to determine the therapeutic potential of these treatments.
However, the evidence suggests that both methods are beneficial for relieving hamstring tightness. The basis for adaptive shortening is the presence of microcellular dysfunctions that lead to changes in our connective tissues. This implies that achieving flexibility necessitates increased exertion and meticulous training over an extended duration [27]. A study conducted by Palmer TB et al., using ultrasonographic measurements of the hamstring muscle, discovered that men exhibited higher levels of muscle thickness and cross-sectional area compared to women. Women generally exhibit greater intramuscular fat levels than men in specific muscle groups, such as the hamstrings and other thigh muscles, while the muscles in the lower leg and foot have lower fat concentrations. It is logical to assume that females would have smaller muscles in the front of the lower leg and foot and larger muscles in the back of the hip and thigh, considering that the quantity of fat influences the intensity of physical activity in the muscle and fibrous tissue. The elevated eco-intensity values observed in the upper hamstring region of this study may have been influenced by the greater thickness of the posterior thigh in females compared to males. This disparity could perhaps account for the significant positive connection observed between subcutaneous fat and eco-intensity [28].
The current investigation revealed that the hamstring muscle length in both groups exhibited an increase following the intervention. Davis M et al., investigated how the muscular energy technique and instrument-assisted soft tissue mobilisation affected knee extension range of motion, knee extensor/flexor strength and muscle thickness. Diagnostic ultrasonography was used to assess the effects both immediately following therapy and 24 hours later. According to the study, the flexibility of the shortened hamstrings improved both immediately after the intervention and during the use of the Muscle Energy Technique (MET) and Instrument-assisted Soft Tissue Mobilisation (IASTM) procedures. After IASTM, both groups experienced a decrease in muscle strength and an increase in range of motion, while MET produced the opposite effect, increasing both strength and range of motion. Contrary to the results of the prior trial, the combination of KCAT and BLR with stretching exercises significantly increased side-to-side muscle length in all three groups. In the previous study, muscle thickness was measured immediately after a day. It is therefore possible that the larger time intervals used are the cause of this discrepancy [29]. In conclusion, this systematic review and meta-analysis demonstrated that the use of MET is more effective for hamstring flexibility than stretching or no treatment, based on the SRT index. On the other hand, MET and other manipulations do not statistically differ in efficacy based on the AKE index. It is thought that the reason for these results is that MET combines isometric contraction with stretching, unlike other techniques. Although MET is accompanied by such muscle contractions, since no adverse effects were reported, the clinical use of MET can be recommended to increase the flexibility of the hamstring muscle.
Matrix rhythm therapy is a medical treatment that improves microcirculation and tissue flexibility. The study Institute conducted a quasi-experimental study with one session from November 2020 to January 2021, assessing a total of 63 patients. Out of this total, 30 individuals (17 males and 13 females) were of legal age to participate. These individuals underwent a single 60-minute session of MaRhyThe©. The statistical analysis of the AKE tests and ultrasonographic evaluations involved comparing the data before and after therapy using the Kolmogorov-Smirnov test. The treatment outcomes showed a significant decrease in AKE, with a reduction of 41.40% on the left and 41.39% on the right. The ultrasonographic findings underwent substantial changes following the intervention. There was a significant reduction in muscle thickness and an increase in length and blood flow (p-value ≤0.001). Following a 60-minute MaRhyThe© session, which involved 30 minutes of treatment for each leg, patients with asymptomatic hamstring tightness experienced positive outcomes, including enhanced microcirculation, decreased muscle thickness and improved tissue flexibility. The present study also demonstrates substantial improvement with the use of ultrasonography, thereby confirming the alignment of the results with this particular observation [30]. Further studies are recommended to be conducted on subjects with chronic low back pain due to hamstring muscle tightness and core muscle weakness.
Limitation(s)
The present study was not conducted for a longer period of time (2 weeks). Additionally, there were fewer outcome measures and a lack of blinding.
Conclusion(s)
Both Mulligan’s Bent Leg Raise and KCAT were equally effective and could be used as adjuncts in improving hamstring flexibility. Both techniques are beneficial in relieving hamstring dysfunctions and injuries and they can be used in various treatment regimes. The findings also suggest that these interventions could be valuable for managing hamstring tightness, particularly in a clinical setting, even in individuals without symptomatic issues. Further research is recommended to explore the long-term effects and compare efficacy in symptomatic populations. According to the authors’ knowledge, the present study is the first of its kind to evaluate the effect of KCAT and Mulligan’s BLR on hamstring length and thickness using diagnostic ultrasonography.
Paired sample t-test
Paired sample t-test
Paired sample t-test was used
Paired sample t-test
Paired sample t-test
Independent t-test was used
Independent t-test was used
Independent t-test
Independent t-test
Independent t-test