In Temporomandibular Joint Disorder (TMD), the mandibular condyle undergoes numerous morphological changes and remodelling to accommodate malocclusion, trauma and other developmental abnormalities [1]. When the width of the radiolucent joint space is uniform on both the anterior and posterior aspects, the condyle is positioned concentrically. Eccentric condylar positioning, which leads to alterations in joint spaces, may indicate abnormalities such as disc displacement, disc perforation, or the presence of blood within the joint space [2]. Additionally, there is an association between disc perforation, the thickness of the RGF and the posterior attachment. The thickness of the RGF may increase when the TMJ, in conjunction with disc displacement or perforation, is associated with issues such as the displacement of the mandibular condyle into the cranial fossa due to trauma, the intracranial extension of a tumour, or infections that spread to the TMJ, particularly when the RGF has a minimum thickness [3].
The CBCT is a new imaging modality for orofacial structures that offers a minimal radiation dose, good spatial resolution of osseous structures, high patient acceptance and low cost. Consequently, it has become increasingly important in oral and maxillofacial radiology [1]. To distinguish normal variations from aberrant ones, a complete understanding of the structure, anatomy and morphology is required [4]. Many studies on the analysis of the glenoid fossa, joint spaces and condyle have been conducted independently using various approaches [5-10]. For repeatable and reliable measurements, reference points must be fixed. Furthermore, this study represents the first morphometric TMJ analysis conducted on the Gujarati population. Therefore, utilising a specific reference point across multiple CBCT sections, all TMJ parameters were assessed for morphometric and geometric analysis in clinically healthy, asymptomatic Gujarati patients in this experiment.
Materials and Methods
The present cross-sectional study was conducted in the Department of Oral Medicine and Radiology at the College of Dental Sciences and Research Centre in Bopal, Gujarat, India from September 2019 to September 2022. Ethical approval was obtained from the Institutional Ethical Committee (ethical reference no.: CDSRC/IEC/20190702/18).
The CBCT scans were performed at the maximal intercuspation level with the temporal rod immobilised. The scan parameters were set to 60-90 kVp and 4-12 mA, using a Papaya 3D machine from Genoray, Korea. Measurements were taken using Triana imaging software. A total of 40 subjects (20 males and 20 females) with CBCT scans taken between 2018 and 2019 were retrospectively analysed in Triana imaging software between September 2019 to March 2021.
Inclusion criteria: The present study included large Field of View (FOV) CBCT scans (16×8 cm and 16×14 cm) with clear resolution and adequate coverage that displayed bilateral TMJs. CBCT scans taken for various dental treatments unrelated to TMD and without a history of trauma were considered for the study.
Exclusion criteria: The CBCT scans of individuals with systemic illnesses such as Sjögren’s syndrome, rheumatoid arthritis, systemic lupus erythematosus and reactive arthritis; a history of prior orthognathic surgery; severe facial asymmetry; condylar hyperplasia or hypoplasia; scans with insufficient clarity or resolution; patients with a history of any tumour or growth in the orofacial region that could affect the morphology of the condyle; and individuals younger than eighteen were excluded in the study.
Sample size calculation: In August 2019, pilot research with five patients (10 joints) was carried out and based on this sample size of 40 was achieved after using formula.
Z1-a/22SD2/d2=(1.96)2 (3.2)2/(1)2=40.58 (Max. value of SD from pilot study=3.2)
Study Procedure
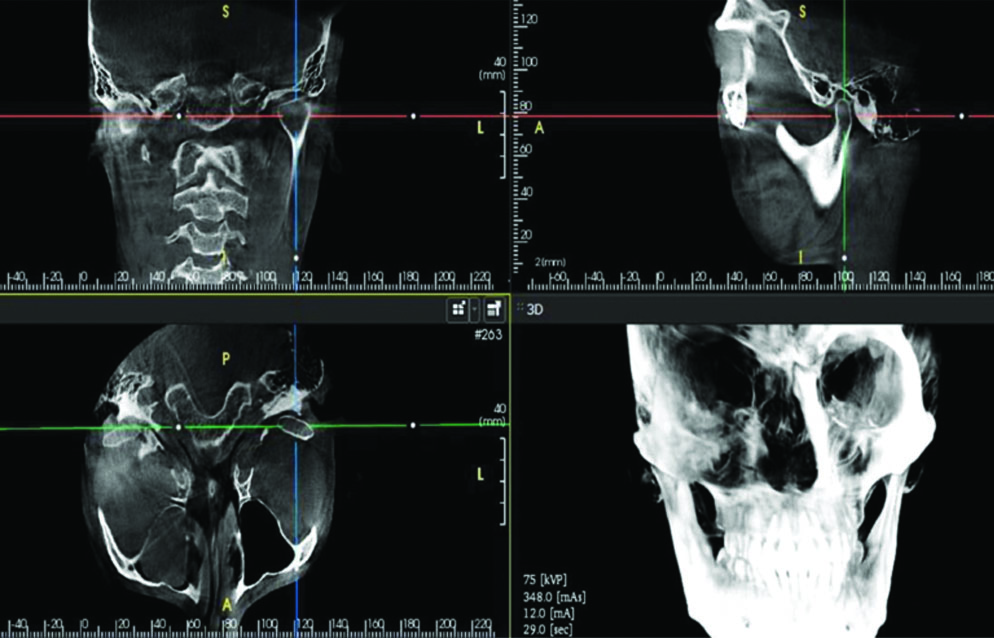
Image analysis: The volumetric data set was created from the basic projection frames. Contiguous, colour-correlated, perpendicular axial, coronal and sagittal 2D Multiplanar Reconstruction (MPR) slices were then sectioned from the visual orthogonal images. The constructed data sets have been generated as files for Digital Imaging and Communications in Medicine (DICOM) and the image stacks have been transferred to a Dell Vostro 3558 personal PC. The axial view presenting the maximum mediolateral dimension of the condyle, using a 1 mm thickness, was selected as the reference view for secondary reconstruction. Occasionally, the chosen slice varied depending on whether the right or left-side was being evaluated. Metric analysis of the morphology of the mandibular condyle, joint space and glenoid fossa was recorded as described by Hilgers ML et al., Dalili Z et al., and Al-Koshab M et al., [Table/Fig-1] [5,6,11].
A 3D software for analysis [5,6,11].
Condylar measurement and parameters [Table/Fig-2,3 and 4]:
| Parameters | Measurement points | CBCT section |
|---|
| Condylar length (Aco- PCo) | Linear distance between posterior mandibular condyle and anterior mandibular condyleSco: Most superior apex on concavity of condylar headAco-Most anterior extent of mandibular condyle (4 mm inferior to apex of superior condylar surface)Pco-Most posterior extent of mandibular condyle (4 mm inferior to apex of superior condylar surface) | Sagittal |
| Condylar width (MCo- LCo) | Linear distance between medial mandibular condyle and lateral mandible condyleMco: Most medial extent on the condyle.Lco: Most lateral extent on the condyle. | Coronal |
| Condylar height CoHt) | The linear distance that is perpendicular between the most inferior point of the coronoid sigmoid notch (InfSig) and the superior mandible condyle (SCo)InfSig- Most inferior apex on concavity between coronoid and condylar process of mandible | Sagittal |
Joint space parameters [6,11].
| Parameters | Measurement points | CBCT section |
|---|
| Anterior Joint Space (AJS) | The most superior point of the glenoid fossa was used to draw the line tangential to the anterior part of the condyle.Perpendicular measurement between anterior tangential plane to the glenoid fossa.Aco-Most anterior extent of mandibular condyle (4 mm inferior to apex of superior condylar surface)SF: Superior point of the glenoid fossa. | Sagittal |
| Superior Joint Space (SJS) | Measurement of the distance between the most superior aspect of the condyle and the most superior point of the glenoid fossa.Sco: Most superior apex on concavity of condylar headSF: Superior point of the glenoid fossa. | Sagittal |
| Posterior Joint Space (PJS) | The most superior point of the glenoid fossa was used to draw the line tangential to the posterior part of the condyle.Perpendicular Measurement between posterior tangential plane to the glenoid fossa.Pco- Most posterior extent of mandibular condyle (4 mm inferior to apex of superior condylar surface)SF: Superior point of the glenoid fossa. | Sagittal |
| Medial Joint Space (MJS) | The most superior point of the glenoid fossa was used to draw the line tangential to the medial most part of the condyle.Perpendicular measurement between medial tangential plane to the glenoid fossa.Mco: Most medial extent on the condyle. | Coronal |
| Lateral Joint Space (LJS) | The most superior point of the glenoid fossa was used to draw the line tangential to the lateral most part of the condyle (Lco).Perpendicular measurement between lateral tangential plane to the glenoid fossa.Lco: Most lateral extent on the condyle. | Coronal |
RGF thickness measurement [11].
| Parameters | Measurementpoints | CBCT section |
|---|
| RGF thickness | The central equivalent region, defined as the thinnest area of the glenoid fossa (through multiple slices). Measurements were taken of the thinnest bone (RGF) that forms the RGF. Distance between outer and inner cortex of RGF was registered as the thickness of RGF.IC- Inner Cortical Outline OC- Outer Cortical Outline | Sagittalcoronal |
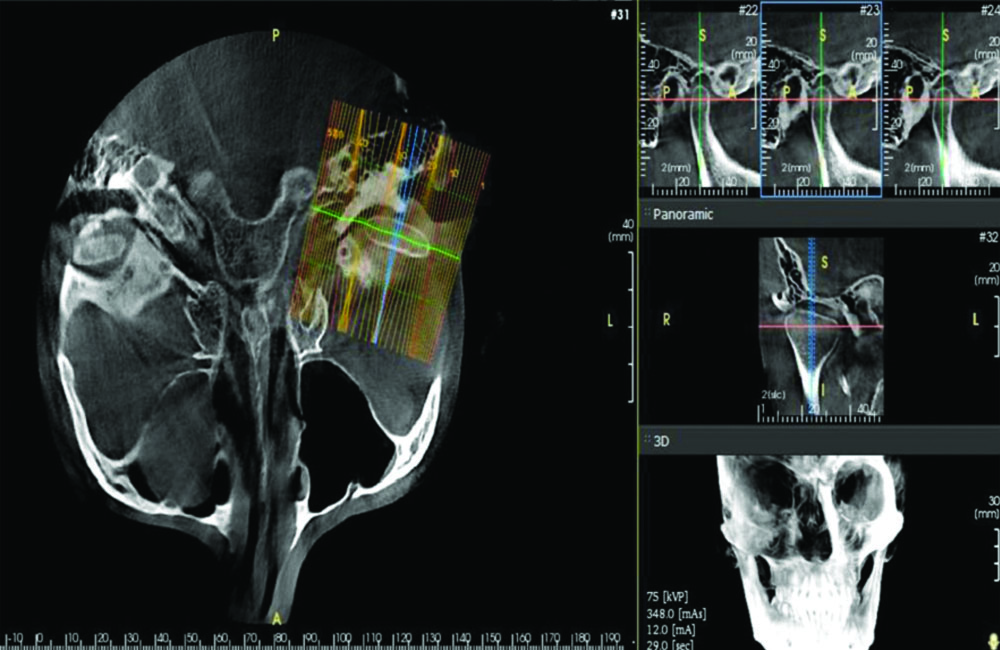
Corrected sagittal section for condylar length, joint space (anterior, superior, posterior) and roof of glenoid fossa thickness: Connecting the medial and lateral poles of the condyle, a panoramic line was drawn in axial slices along the condyle. Subsequently, sagittal slices were acquired parallel to the longitudinal axis of the mandibular condyle. The midpoint of the condyle and the central sagittal slice were used as reference slices for measurements [Table/Fig-5].
Acquisition of corrected sagittal section.
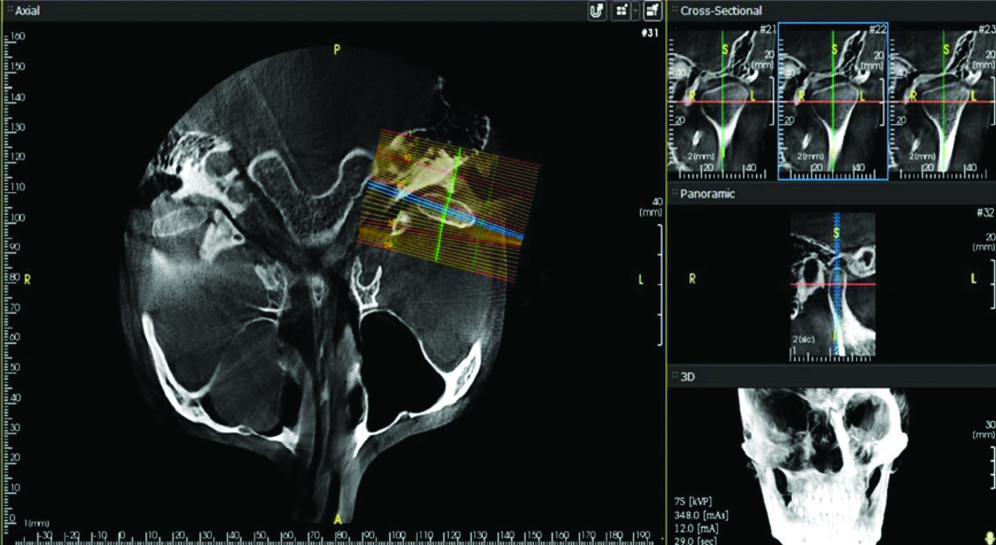
Corrected coronal sections for condylar width, joint space (MJS and LJS) and RGF thickness: For secondary reconstruction, an axial view that displayed the condylar processes at their largest mediolateral extent was used as a reference. From a selected axial image, coronal slices with a thickness of 1 mm were obtained, aligned with the longitudinal axis of the mandibular condyle. The central coronal slice was considered the reference slice [Table/Fig-6].
Acquisition of corrected coronal section.
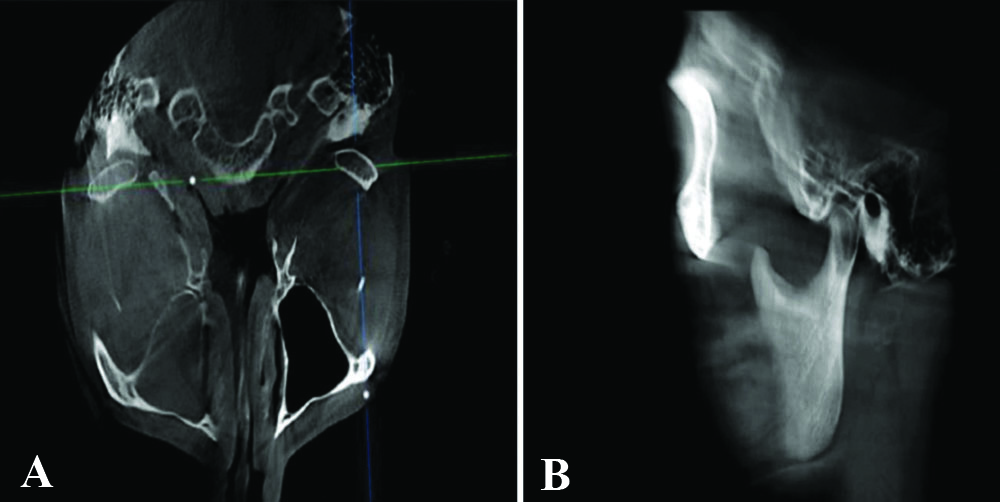
Corrected sagittal section for condylar height: The axial image was adjusted to visualise the condyle and the superior tip of the coronoid process [Table/Fig-7A]. An oblique 2D MPR (10 mm) was then constructed through the tip of the coronoid and the anterior margin of the external auditory meatus [Table/Fig-7B].
A,B) Acquisition of corrected sagittal section for condylar height.
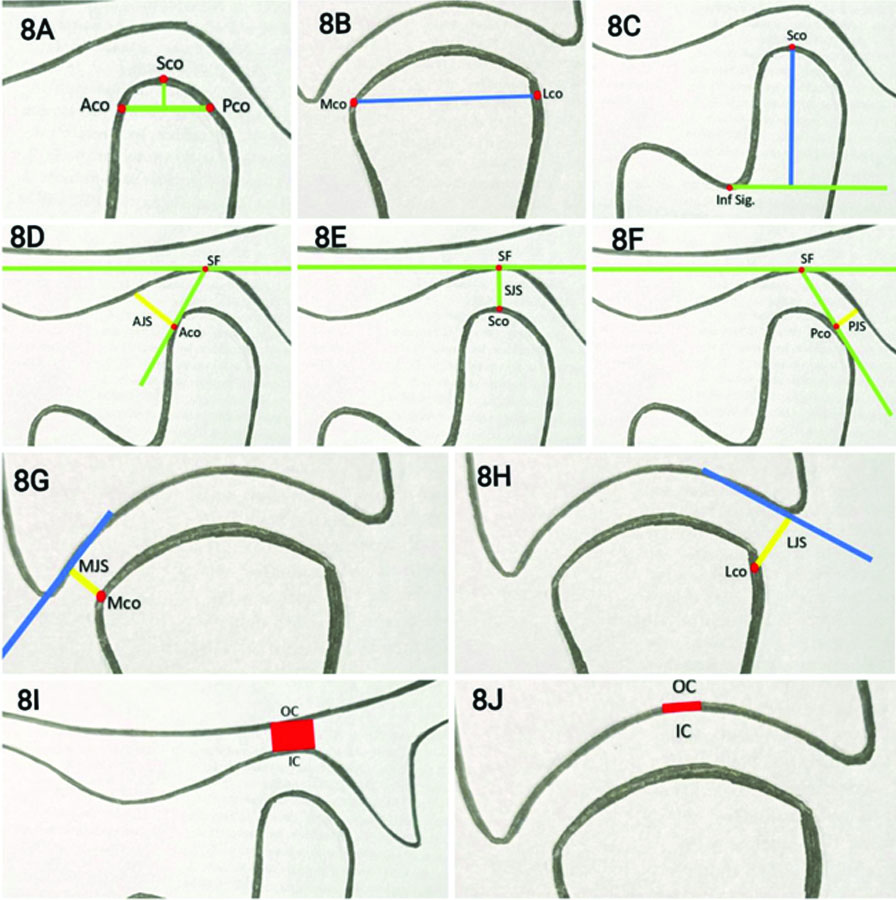
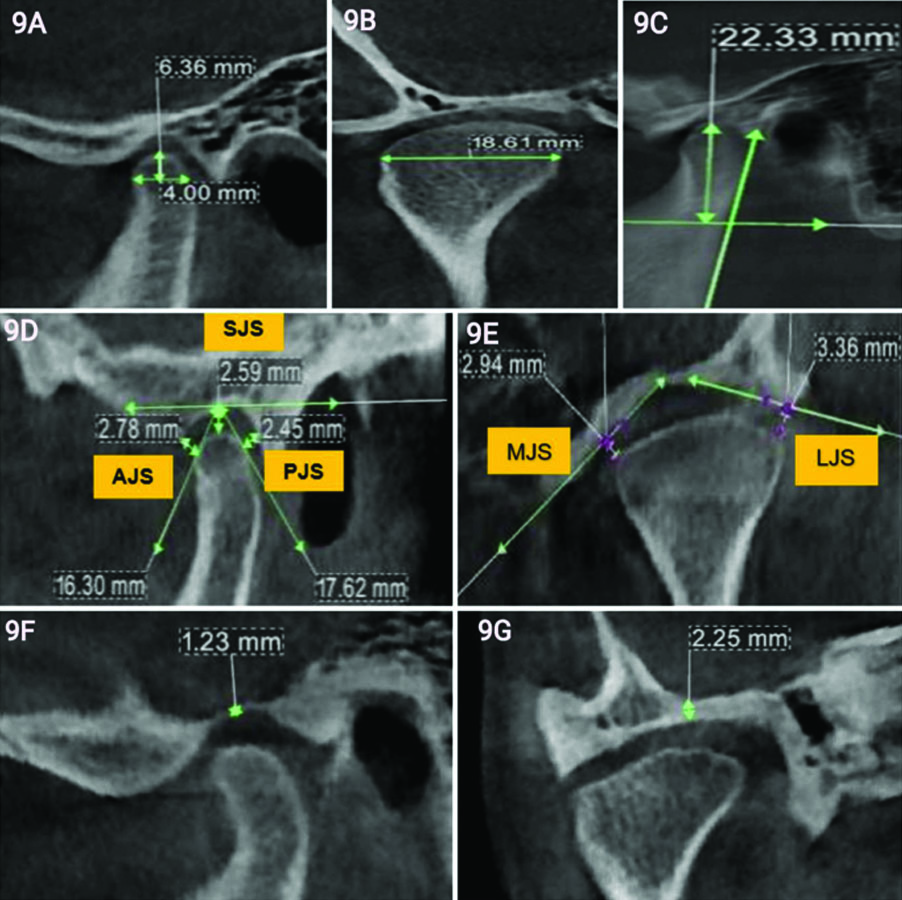
The schematic and radiographic presentations of the condyle, joint space and glenoid fossa thickness measurements are shown in [Table/Fig-8A-J,9A-G], respectively.
Schematic representation of Condylar length (8A), Condylar height (8C), Anterior joint space (8D), Superior Joint Space (8E), Posterior joint space (8F), Thickness roof of glenoid fossa (8I) measurement in sagittal view and Condylar width (8B), Medial joint space (8G), Lateral Joint Space (8H), Thickness roof of glenoid fossa (8J) measurement in coronal view.
Radiographic measurement of Condylar Length (9A), Condylar Height (9C), Anterior joint space (9D), Superior Joint Space (9D), Posterior joint space (9D), Thickness roof of glenoid fossa (9F) in sagittal view and measurement of Condylar width (9B), Medial joint space (9E), Lateral Joint Space (9E), Thickness roof of glenoid fossa (9G) in coronal view.
Statistical Analysis
The measurements were processed and analysed using the statistical software package SPSS (Chicago, IL, USA) version 21.0 for MS Windows. For each variable, the mean and standard deviation were determined based on TMJ sides, age groups and gender [Table/Fig-10]. Since the data were continuous, it was subjected to a t-test for group comparison, considering a significance level of 5% (p<0.05).
Comparative analysis of between Gender, sides and age groups of the subjects.
| Parameters in mm | Mean (in mm), standard deviation and p-value of the variables |
|---|
| Total subject (n=40) | Gender | TMJ side | Age group |
|---|
| Male (n=20) | Female (n=20) | p-value | Right (n=20) | Left (n=20) | p-value | <25 years (n=23) | ≥25 years (n=17) | p-value |
|---|
| Condylar length | 6.94 (0.89) | 6.85 (0.86) | 7.02 (0.92) | 0.386 | 6.94 (0.93) | 6.94 (0.87) | 1.000 | 6.86 (0.83) | 7.04 (0.97) | 0.362 |
| Condylar width | 17.7 (2.44) | 19.14 (2.1) | 16.34 (1.88) | 0.001* | 17.97 (2.49) | 17.50 (2.39) | 0.390 | 17.67 (2.38) | 17.82 (2.55) | 0.777 |
| Condylar height | 19.2 (3.13) | 19.85 (3.10) | 18.59 (3.04) | 0.070 | 19.11 (3.19) | 19.33 (3.08) | 0.752 | 19.69 (2.85) | 18.57 (3.37) | 0.112 |
| AJS | 2.78 (0.65) | 2.79 (0.68) | 2.76 (0.62) | 0.085 | 2.75 (0.64) | 2.80 (0.66) | 0.773 | 2.68 (0.50) | 2.90 (0.80) | 0.155 |
| SJS | 3.7 (0.89) | 3.98 (0.86) | 3.46 (0.85) | 0.009* | 3.69 (0.82) | 3.75 (0.96) | 0.747 | 3.79 (0.91) | 3.63 (0.86) | 0.444 |
| PJS | 2.89 (0.69) | 2.86 (0.59) | 2.92 (0.79) | 0.704 | 2.85 (0.71) | 2.93 (0.68) | 0.634 | 2.88 (0.74) | 2.89 (0.64) | 0.960 |
| MJS | 3.15 (0.82) | 3.48 (0.86) | 2.82 (0.63) | 0.001* | 3.03 (0.80) | 3.28 (0.84) | 0.189 | 3.10 (0.80) | 3.24 (0.89) | 0.466 |
| LJS | 3.04 (0.79) | 3.35 (0.79) | 2.72 (0.67) | 0.001* | 3.01 (0.80) | 3.07 (0.81) | 0.744 | 3.04 (0.69) | 3.07 (0.94) | 0.888 |
| Sagittal RGF thickness | 1.76 (0.48) | 1.89 (0.47) | 1.62 (0.46) | 0.014* | 1.78 (0.51) | 1.73 (0.46) | 0.682 | 1.73 (0.47) | 1.79 (0.50) | 0.567 |
| Coronal RGF thickness | 1.63 (0.43) | 1.79 (0.42) | 1.47 (0.37) | 0.001* | 1.60 (0.42) | 1.66 (0.44) | 0.538 | 1.64 (0.47) | 1.61 (0.37) | 0.715 |
n=Total number of participants in the study
p=level of significance (>0.05=non significant; <0.05=significant), *=significant
SJS: Superior joint space; AJS: Anterior joint space; and PJS: Posterior joint space; MJS: Medial joint space; LJS: Lateral joint space; RGF: Roof of the glenoid fossa
Results
Out of 40 subjects aged 18 to 50 years, 20 (50%) were male and 20 (50%) were female, with a mean age of 34±9.6 years. The participants were divided into two groups: 1) those under 25 years of age, consisting of 14 males (35%) and 9 females (22.5%); and 2) those aged 25 years or older, consisting of 6 males (15%) and 11 females (27.5%). All 40 participants underwent a morphometric assessment of their left and right TMJs [Table/Fig-10].
In the present study, the sizes of the condyle, joint spaces and RGF varied between genders. The condylar width was higher in males (mean value of 19.1±2.11 mm) compared to females (mean value of 16.3±1.88 mm). With the exception of age and side-wise analysis, the condylar width in the present study varied significantly with gender (p-value=0.001). In the gender-specific joint space analysis, the mean values of the SJS, MJS and LJS were significantly higher in males compared to females (p<0.05). Regarding the thickness of the glenoid fossa, no significant variations were found in age and side-wise analysis, except in gender analysis, where it was higher in males compared to females (p-values for sagittal RGF: 0.014; coronal RGF: 0.001) [Table/Fig-10].
Discussion
Researchers used CBCT scans of 40 individuals, comprising 20 females and 20 males, to assess the condyle, joint space and glenoid fossa in the coronal and sagittal sections. In the current study, only condylar width, SJS, MJS, LJS, Sagittal RGF and coronal RGF were found to be larger in males than in females. Other CBCT TMJ assessment parameters did not show any significant differences when analysed age-wise or side-wise. The authors of the study contrasted their findings with previous studies, as seen in [Table/Fig-11A,11B] [1,6-17].
Comparison of the findings in present study with similar and contrast studies [1,6-13,15].
| Authors and study year | Population studied and sample size | CL | CW | CH | AJS | SJS | PJS | MJS | LJS | SRGF | CRGF |
|---|
| Vemareddy S et al., (2019) [1] | Indian, (Tamil Nadu) 50 | 6.74 mm (Similar) | 17.26 mm (Similar) | - | - | - | - | - | - | - | - |
| Dalili Z et al., (2012) [6] | Iran population 40 | - | - | - | 2.1 mm | 3.2 mm | 2.1 mm | 2.9 mm | 2.6 mm | - | - |
| Chaurasia A et al., (2017) [7] | Indian, (Lucknow) 150 | 8.38 mm (Contrary) Axial section CBCT | 18.79 mm (Contrary) Axial section CBCT | 9.46 mm (Contrary) Sagittal section CBCT Measuring points difference | - | - | - | - | - | - | - |
| Ishwarkumar S et al., (2016) [8] | KwaZulu-Natal population 54 dry mandibles | 9.23 mm (Contrary) Use of a digital calliper | 17.92 mm | 19.3 mm | - | - | - | - | - | - | - |
| Imanimoghaddam M et al., (2016) [9] | Iran population 25 | - | - | - | 2.35 mm | 3.33 mm | 2.15 mm | - | - | - | - |
| Vankadara S et al., (2021) [10] | Indian, (Andhra Pradesh) 40 | - | - | - | 2.35 mm | 2.91 mm | 4.29 mm | 4.57 mm | 3.22 mm | - | - |
| Al-koshab M. et al., (2015) [11] | Malay and Chinese population 100 | 7.29 mm (Contrary) | 17.9 mm | 18.25 (3.1) | 1.68 mm (Malay) 1.79 mm (Chinese) | 2.90 mm 3.09 mm | 2.14 mm 2.00 mm | - | - | 1.20 mm (Malay) 1.00 (Chinese) | - |
| Nithin I et al., (2021) [12] | Indian, (Manipal) 119 | 7.02 mm | 17.8 mm | 19.07 (0.7) | 2±0.37 | 2.53±0.53 | 2.34±0.5 | - | - | 1.41 mm | - |
| Hasebe A et al., (2019) [13] | Japanese population 166 | 9.48 mm (Contrary) | 14.77 mm (Contrary) | 17.55 mm | - | - | - | - | - | - | - |
| Yasa Y and Akgül HM (2017) [15] | Turkish 200 | 7.93 (1.48) | 18.96 (2.69) | - | 2.36 mm | 3.52 mm | 2.32 mm | - | - | - | - |
| Present study | Indian, (Gujarat) 40 | 6.94 mm Sagittal section CBCT | 17.7 mm Coronal section CBCT | 19.2 mm Sagittal section CBCT | 2.78 mm Sagittal section CBCT | 3.73 mm Sagittal section CBCT | 2.89 mm Sagittal section CBCT | 3.15 mm Coronal section CBCT | 3.04 mm Coronal section CBCT | 1.76 mm | 1.63 mm |
CL: Condylar length; CW: Condylar width; CH: Condylar height; SJS: Superior joint space; AJS: Anterior joint space; and PJS: Posterior joint space; MJS: Medial joint space; LJS: Lateral joint space; SRGF: Sagittal roof of the glenoid fossa; CRGF: Coronal roof of the glenoid fossa; OA: Osteo arthritis
Gender, side and age wise analysis of present study with similar and contrast studies [6,7,10-12,14,16,17].
| Authors and study year | Place of study | Subjects | Parameter assessed | Gender-wise analysis (significant difference) | Side-wise analysis | Age-wise analysis | Similar/contrary to present study’s findings |
|---|
| Dalili Z et al., (2012) [6] | Guilan,Iran | 40 | AJS, SJS, PJS, MJS, LJS | SJS (M>F) | Significant differences between the values of AJS, SJS, PJS, MJS, LJS in right and left-sides | Not performed | Similar to present study’s findings for gender analysis contrary for side analysis |
| Chaurasia A et al., (2017) [7] | Lucknow,India | 150 | CL, CW, CH | CW, CH (M>F) | Significant difference in the CL, CW between the two sides | CL, CW, CH- minimum in >20 yrs CL CW, CH- maximum in 31-40 years | Similar to present study’s findings for gender analysis contrary for side analysis |
| Vandakara S et al., (2021) [10] | Andhra Pradesh, India | 40 | AJS, SJS, PJS, MJS, LJS, condylar position (Gelb 4/7 grid) | Significant differences were noticed in MJS, AJS values between males and females | Significant difference between right and left-sides in AJS, SJS, MJS, LJS values | Non significant in the dimensions of total joint spaces | Similar to present study’s findings for gender and age analysis contrary for side analysis |
| Al-koshab M et al., (2015) [11] | Kuala Lumpur, Malaysia | 100 | Condyle volume, CL, CW, CH, AJS, SJS, PJS, SRGF | Condyle volume, CW, CH, Joint spaces (M>F) | CW, CL (R>L),CH, SRGF (L>R) | Not performed | Similar to present study’s findings for gender analysis contrary for side analysis |
| Nithin I et al., (2021) [12] | Manipal,India | 119 | CL, CW, CH, AJS, SJS, PJS, SRGF | CL, CW, CH, SJS, PJS, SRGF (M>F) | CW, SRGF (L>R) | CL-In Males both sides, AJS- right-side shows significant difference with age CL, CW, CH, AJS, SJS, PJS- in females shows significant difference with age | Similar to present study’s findings for gender analysis except for PJS2.78 mm, contrary for side and age analysis |
| Jyotirmay et al., (2022) [14] | Patna,India | 266 | CL, CW, CH in various growth patterns | CL, CW, CH (M>F) | Not performed | Not performed | Similar to present study’s findings for gender analysis |
| Soydan D et al., (2019) [16] | Kayseri, Turkey | 68 | “With Osteoarthritis (OA)” or “without OA” patients | No significant relationship was found | Not performed | Not performed | Contrary for gender analysis |
| Tariq QUA et al., (2023) [17] | Rawalpindi, Pakistan | 66 | Condylar size (CL, CW, CH), anterior, superior and posterior distance in various growth patterns | CL, CW, CH, anterior distance (M>F) | No statistically significant differencesfound | Not performed | Similar to present study’s findings for gender analysis except for anterior distance |
| Present study | Ahmedabad, India | 40 | CL, CW, CH, AJS, SJS, PJS, MJS, LJS, SRGF, CRGF | CW, SJS, MJS, LJS, SRGF, CRGF (M>F) | Non significant | Non significant | |
CL: Condylar length; CW: Condylar width; CH: Condylar height; SJS: Superior joint space; AJS: Anterior joint space; and PJS: Posterior joint space; MJS: Medial joint space; LJS: Lateral joint space; SRGF: Sagittal roof of the glenoid fossa; CRGF: Coronal roof of the glenoid fossa; OA: Osteo arthritis
In a comparative analysis based on gender, males exhibited greater condylar width than females. Conversely, there was minimal difference in the mean condylar length and height values between both genders. The difference in condylar width was statistically significant between the genders (p=0.001), with the exception of condylar height and length. Males have larger condylar dimensions than females due to the overall differences in condyle size between the genders [18].
According to research conducted by Al-Koshab M et al., and Jyotirmay et al., the differences in condylar length, width and height between both sides were statistically non significant [11,14]. These findings were consistent with the current research. However, Chaurasia A et al., found that condylar length and width varied significantly (p=0.001) between the two sides [7]. The observation that individuals with malocclusion favoured one side for chewing could be explained by a morphologically altered asymmetry between the two sides [19,20].
The differences in condylar length, width and height between age groups were statistically insignificant. This outcome is in accordance with the findings of Chaurasia A et al., and Nithin I et al., [7,12]. However, Ebner KA et al., found no differences in radiographic changes between normal joints and those with early or moderate to marked osseous changes in 18 human cadaver specimens [21]. Degenerative joint disease can lead to resorptive and proliferative changes that affect dimensional measurements. The dimensions of proliferating joints may be larger than those of early resorptive joints due to the flatness of the articular surfaces [21].
According to the findings of Dalili Z et al., Vankadara S et al., Al-Koshab M et al., and Nithin I et al., men had larger linear measurements of joint spaces than women, particularly in the posterior and superior spaces [6,10-12]. The current investigation yielded comparable results. The TMJ compartment soft-tissue thickness reported by Lubsen CC et al., suggests that men may have larger joint gaps [22]. According to Hinton RJ, male sexual dimorphism also results in differences in the overall size of the temporal fossa and the mandibular condyle [23]. In line with the conclusions of Dalili Z et al., Ikeda K and Kawamura A and this research found that the SJS value was highest for both genders [6,24]. However, the results reported in the present study did not align with those reported by Vankadara S et al., and Al-Koshab M et al., likely due to variations in race and ethnicity, measurement points and sample size [10,11].
In a side-by-side comparative analysis, the difference between both sides of the TMJ was statistically not significant. This finding is consistent with the studies reported by Kecik D et al., and Rodrigues AF et al., [25,26]. Rodrigues AF et al., reported that the values for the right TMJ were 1.29 mm for AJS, 1.57 mm for SJS and 1.87 mm for PJS, while for the left TMJ, the values were 1.22 mm for AJS, 1.59 mm for SJS and 1.65 mm for PJS [26]. The researchers noted that the differences in AJS and SJS for the right and left-sides were statistically not significant, except for PJS, which could be attributed to the various dimensions of the mandibular fossa. The results of the present study did not align with those reported by Dalili Z et al., and Nithin I et al., who observed significant distinctions in the AJS, SJS, PJS, MJS and LJS values between the left and right-sides [6,12]. Cohlmia JT et al., also investigated different skeletal patterns and malocclusions, finding that the right and left-sides exhibited significantly different values in the posterior and SJSs [20]. This research suggested that patients with malocclusion may have a preferred side for mastication, which could contribute to altered morphology and volume, accounting for the asymmetry in condylar placement between the left and right-sides of the glenoid fossa [12,19].
The difference in age groups in the present study was not significant, which is consistent with the study conducted by Vankadara S et al., [10]. However, the findings of Nithin I et al., study did not align with ours, as they reported that 119 patients showed linear measurements of anterior, posterior and superior space that gradually declined with age [12]. This discrepancy could be attributed to differences in sample size between the studies.
The difference in sagittal RGF and coronal RGF between both genders was statistically significant, which is in agreement with the findings of Khojastepour L et al., and Alkoshab M et al., [3,11]. Conversely, Soydan D et al., found that the gender difference was not statistically significant, possibly due to variations in the total number of joints included in their study [16]. In the side-wise comparison analysis, the mean values of RGF thickness were 1.78 mm on the right-side and 1.73 mm on the left-side. Park H-J et al., reported that the mean thickness of the RGF was greater on the left-side (0.77±0.44 mm) than on the right-side (0.74±0.33 mm) [27]. Although this difference was not statistically significant, it was consistent with the results of the present study. However, Nithin I et al., and Rodrigues AF et al., found significant variation between the two sides [12,26]. Changes in TMJ structure and positioning asymmetries can be caused by factors such as tooth loss, dental abrasion, premature occlusal contact points, functional mandibular deviations and unilateral posterior crossbite.
In the age-wise comparison, the statistical analysis showed no significant difference between the two age groups, which aligns with the findings of Nithin I et al., [12]. Nevertheless, the results published by Park H-J et al., indicated that RGF thickness varied statistically between age groups- 0.73 mm for those aged ≤40 years and 0.86 mm for those >40 years [27]. These results suggest that the glenoid fossa undergoes age-related alterations. The glenoid fossa may remodel in response to dysfunction or disuse, as well as changes in articular dynamics linked to adaptive musculoskeletal behaviour [20,27]. The differences in results from the studies may be attributed to variations in age and the smaller number of participants included in their research.
Limitation(s)
Considering that the present study focuses on only one ethnicity, the findings cannot be generalised to a larger population. Further research is recommended, comparing healthy participants with TMD patients. Additionally, studies are needed for various age groups under 18 years.
Conclusion(s)
The findings of the present investigation demonstrated that males had significantly larger condylar widths, SJSs, MJSs, LJSs and sagittal and coronal thicknesses of the glenoid fossa roof compared to females. A detailed CBCT analysis of the TMJ would aid in precisely evaluating morphological variations in various maxillofacial alignments, as well as in analysing positional and morphological TMJ changes following extraction and non extraction orthodontic treatment, facemask therapy, functional appliances (orthopaedic) and orthognathic surgical procedures. Considering the anatomical variability in dimensions, it is concluded that morphometric TMJ evaluation using CBCT is necessary for the diagnosis and management of TMDs.
n=Total number of participants in the study
p=level of significance (>0.05=non significant; <0.05=significant), *=significant
SJS: Superior joint space; AJS: Anterior joint space; and PJS: Posterior joint space; MJS: Medial joint space; LJS: Lateral joint space; RGF: Roof of the glenoid fossa
CL: Condylar length; CW: Condylar width; CH: Condylar height; SJS: Superior joint space; AJS: Anterior joint space; and PJS: Posterior joint space; MJS: Medial joint space; LJS: Lateral joint space; SRGF: Sagittal roof of the glenoid fossa; CRGF: Coronal roof of the glenoid fossa; OA: Osteo arthritis
CL: Condylar length; CW: Condylar width; CH: Condylar height; SJS: Superior joint space; AJS: Anterior joint space; and PJS: Posterior joint space; MJS: Medial joint space; LJS: Lateral joint space; SRGF: Sagittal roof of the glenoid fossa; CRGF: Coronal roof of the glenoid fossa; OA: Osteo arthritis