Introduction
The Quality of Life (QoL) is an important aspect of tool development studies. QoL is defined as the degree or level to which a person is able to enjoy all the important possibilities of life. It is highly subjective and measures happiness, which is an essential component of many financial decisions. QoL reflects an individual’s overall perception and satisfaction with their own life. It is a broad concept that encompasses physical health and mental health, and it is also affected by locality, geographical boundaries, and personal beliefs. QoL is a crucial parameter for assessing health standards, and it may vary from person to person [1].
Numerous QoL tools are available worldwide. Before using a standardised tool, cross-cultural adaptation, content modification, and language translation are required. The measurement and evaluation of an individual’s QoL depend on multiple factors, such as the availability of health facilities and the knowledge and attitudes of people regarding health services [2].
The key objective of present paper is to sensitise new researchers about the development of a standardised tool. Many existing tools, such as EuroQol-5 Dimensions-5 Levels (EQ-5D-5L), McGill Pain Questionnaire, Affect and Balance Scale, Optimistic-Pessimistic Scale, and Quality of Life in Childhood Epilepsy 55 (QOLCE-55), are not applicable in the Indian context [2]. Thus, the demand for the development of new, valid, and standardised tools is increasing day by day. Currently, there is a high demand for the creation of regional, local, and standardised tools that address linguistic and socio-cultural factors [3].
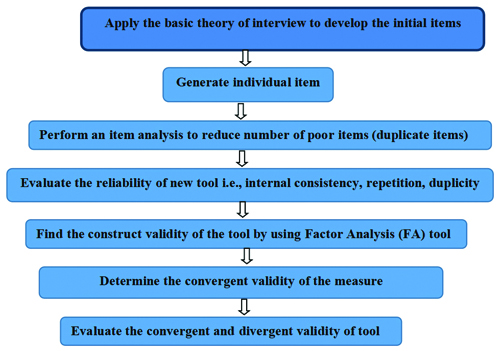
The the process of scale development is tricky and complex and has been depicted in [Table/Fig-1]. It requires systematic planning and methodological understanding. The steps in the scale development process are as follows:
Process of tool development.
Construction of tools based on existing tools.
Construction of a new tool for a specific disease.
Construction of Tools Based on Existing Tools
Construction of tool is a complex process. A researcher can develop a QoL tool using the following methods:
Review of literature: In this process, researchers search for, read, and review studies related to tool development. Currently available tools for the desired topic can be identified [4].
Translation of standardised tools: A standardised tool can be translated into the local language by a language expert. This process is also known as the cross-cultural adaptation of the tool [5]. The validity and reliability of the tool are checked after translation. This includes forward translation, backward translation, and preliminary pilot testing, which are important steps in the translation of the tool and questionnaire [6].
Shortened versions of standardised tools: The aim of this process is to reduce the number of items and develop a short version. For example, QOLCE-89 can be converted to QOLCE-55 or QOL-10. The shortened version of any tool involves the steps of item reduction and item deletion, which are carried out in two different phases. In the first phase, information is gathered through item-impact scores from the participants using the Delphi technique or focus group interview technique. In the second phase, the collected information is presented to a panel of experts who decide which items to include in the short form. Once developed, the newly created shortened version needs to be administered among the target participants of the study [7].
Construction of a New Tool for a Specific Disease
The development of a new tool becomes necessary when there is no preexisting tool available, when the concept of the disease is new, or when tools are non standardised. Three basic methods [7,8] can be followed:
Item Generation
Theoretical Analysis: Theoretical analysis is an important step in tool development. It is a way to understand phenomena in an organised manner. It can affect the design and methodology of research.
Psychometric Analysis
Item generation: This is one of the most important steps in tool development. It helps in formulating a pool of items based on participant responses. Each item should be short, simple, clear, and comprehensive. It should be written in the local language and should not be double-barelled [8].
The first step in tool development is “item generation.” The researcher should be thorough in the steps of item generation. Methods for initial item generation can be classified based on their nature as inductive and deductive.
Deductive methods help in item generation and involve an extensive literature review of existing scales. The deductive method is based on predetermined concepts and the frequency of their occurrence in the field [9].
Inductive methods, on the other hand, gather information through qualitative means, such as focus groups, interviews, and expert opinions. The main difference between inductive and deductive methods is that inductive methods help to generalise findings from specific results, whereas deductive methods are used for testing existing theories.
The following steps are required for forming a pool of items [10]:
Review of existing literature
Interviews with participants
Expert opinions
1. Review of existing literature: In the first phase, an extensive review of the literature is necessary to identify existing standardised tools and their acceptability within the Indian or local population. Some databases and sources for literature searches include Scopus, Embase, Medical Literature Analysis and Retrieval System (MEDLINE), ProQuest, Cumulative Index to Nursing and Allied Health Literature (CINAHL), and PsycINFO [11].
Researchers need to compare participants’ responses with standardised tools to determine whether the tools adequately encompass the information provided by the patients. This comparison will help researchers identify whether any new responses have emerged. For example, the above [Table/Fig-2] explains children’s anxiety when they first go to school. Here, statement 3 is similar to the Revise Chidren Anxiety and Depression Scale (RCADS) tool [12,13], while statement 2 aligns with the Spence Child’s Anxiety Scale (SCAS) tool [14]. No statement corresponds to the School Child Anxiety Scale Teacher’s Report (SAS-TR) scale [15]. Statements 1, 4, and 5 are not part of any standardised tool, so they can be added as new responses to the tool after consultation with an expert.
Comparison between participant response and existing QoL tool.
| Statement | Revise Chidren Anxiety and Depression Scale (RCADS) | Spence Child’s Anxiety Scale (SCAS) | School Child Anxiety Scale-Teacher’s Report (SAS-TR) |
|---|
| 1. I feel anxious when I go to school | No | No | No |
| 2. School teachers are less cooperative | No | Yes | No |
| 3. I feel sad or empty | Yes | No | No |
| 4. I do not want to continue my studies | No | No | No |
| 5. I worry about being away from my parents | Yes | No | No |
2. Interview with participants: There are two methods of interviewing: in-depth individual interviews and focus group interviews. The duration of an in-depth interview depends on the interview guide and the purpose of the study [16].
Focus group discussions involve 4-6 people who sit together to freely discuss a given topic or share their life experiences regarding an incident. Participants are guided by a facilitator. All sessions are recorded and discussed among a team of experts [17].
An interview schedule should be prepared in consultation with an expert before conducting the participants’ interviews. Participants will be asked to discuss how the disease affects their daily activities and QoL. The interviews will be recorded, and notes will be taken by the researcher. In a later phase, the recordings will be transcribed onto paper. Conventional content analysis will help in the extraction of themes, subthemes, and codes. Colaizzi’s method is a way of data analysis that is generally used to extract, organise, and analyse participants’ information and data. Researchers can use the Colaizzi method for item generation [18].
3. Expert opinions: Based on participants’ interviews, the investigator has created the initial items for the item pool. The next step is to have a panel of subject experts review these items in terms of content, comprehension, understanding, and adequacy. Items may be deleted due to irrelevance, duplicity, or repetition. The language of many items may be modified for clarity and comprehensiveness. Items that could create confusion among respondents should be avoided. Both positive and negative response questions should be added to the questionnaire. It is advisable to avoid words like “never” or “except” in statements. Always start with a simple question, and then progress to more complex questions [19].
Theoretical analysis: Theoretical analysis ia an important step in tool development. It is a way to understand phenomena in an organised manner. It can affect the design and methodology of research.
Psychometric analysis: The step where researchers must focus on psychometric analysis, construct validity, and reliability in Factor Analysis (FA) is crucial. It includes various statistical methods like construct validity and FA. This powerful scientific tool helps researchers assess the cognitive capabilities, personality, and behaviour of participants [20].
The components of psychometric analysis include:
Validity of items
Reliability of items
Item analysis
Factor analysis
1. Validity of items: Validity refers to whether a tool measures the intended output accurately. The methods for assessing validity include face validity, content validity, construct validity and criterion validity [21].
a. Face validity: Face validity is the degree to which a test appears to measure what it claims to measure. This is the simplest type of validity, and no real statistical test is available for face validation [22].
b. Content validity: Content validity assesses whether the content of the measurement is up to date and easily understandable. The Item-Content Validity Index (I-CVI) and the Scale-Content Validity Index (S-CVI) are used to measure content validity. Researchers typically consult a panel of experts to gather their viewpoints [9]. It is recommended that the value of I-CVI be close to 1.00, and it should not be less than 0.79 [23]. The S-CVI is calculated to ensure the content validity of the overall scale. ICV values range from 0 to 1, with an Item-CVI above 0.79 indicating that the items are relevant [23].
c. Construct validity: Construct validity defines the extent to which a test or tool accurately evaluates what it is supposed to measure. For example, a blood pressure measuring instrument assesses blood pressure accurately [24]. There are two main types of construct validity:
i) Convergent validity: This refers to how strongly two tests are correlated with each other. For instance, low self-esteem may correlate with episodes of depression.
ii) Discriminant validity: This shows a poor or negative correlation between the variables. It demonstrates that one scale is unrelated to another scale. For example, the variable of motivation is poorly correlated with the variable of failure [25].
d. Criterion validity: This type of validity involves comparing newly developed instruments with a gold standard tool. It helps to establish a standard for the tool or item. Criterion validity can be further divided into two types: concurrent validity and predictive validity [26].
i) Concurrent validity: This indicates the degree of agreement between two different measurement tools. In this case, one assessment scale is new, while the other is the gold standard scale [26].
ii) Predictive validity: This type of validity demonstrates future behaviour or results based on current outcomes. For example, poor performance in an examination may lead to failure [27].
2. Reliability of items: Reliability relates to the repeatability, consistency, and stability of a newly developed tool. One important type of reliability is internal consistency, which is measured by the value of Cronbach’s alpha (coefficient alpha). Internal consistency indicates how well an instrument measures the expected variables. A higher alpha value indicates greater reliability of the tool. If the Cronbach’s alpha value is below 0.7, it suggests poor reliability of the tool [28].
Reliability is measured by the following methods:
Internal Consistency Reliability (Cronbach’s Alpha)
Test-retest Reliability
a. Internal consistency reliability (Cronbach’s Alpha): This method gauges how well a test or survey measures what it intends to measure. Cronbach’s alpha is used to assess the reliability of a psychometric test. A low Cronbach’s alpha (<0.7) indicates poor correlation between the items on a tool or scale. An alpha value above 0.8 is considered acceptable, while a value exceeding 0.95 may indicate redundancy among items. Along with alpha, the KMO value can also be calculated [28].
b. Test–retest reliability: It helps to assess the stability of a tool, commonly referred to as a test of reliability, repeatability, or reproducibility. The same tool is administered to the same participants two times, with an interval of 7 to 10 days between the tests, to measure the scores. The researcher expects to obtain the same results in both tests. A correlation coefficient (r) value between 0.8 and 0.9 is considered acceptable in this context [29].
3. Item analysis: It helps to understand the difficulty level of an item. This includes inter-item correlation, item-total correlation, Cronbach’s alpha values, and reliability.
Inter-item correlation
Item-total correlation
a. Inter-item correlation: It is a method used to assess the internal consistency of a tool. It measures each item’s contribution to a test, ensuring appropriate, precise, and consistent results [30]. In [Table/Fig-3], item number 4 shows a correlation value above 0.8, indicating duplication; therefore, it should be deleted. Nearly all item-total correlations fall between 0.1 and 0.6, indicating good internal consistency [31].
Inter-item correlation matrix.
| Items | Item 1 | Item 2 | Item 3 | Item 4 | Item 5 |
|---|
| Item 1 | 1.000 | 0.525 | 0.501 | 0.810 | 0.400 |
| Item 2 | | 1.000 | 0.610 | 0.899 | 0.495 |
| Item 3 | | | 1.000 | 0.845 | 0.540 |
| Item 4 | | | | 1.000 | 0.774 |
| Item 5 | | | | | 1.000 |
b. The item-total correlation: This test is used to assess internal consistency by determining whether an item or questionnaire is inconsistent with the average behaviour of the other items in the test, which may warrant its deletion. Ideally, item-total correlations should not be less than 0.3. After deleting an item, the value of Cronbach’s alpha should increase [32].
According to [Table/Fig-4], the item value for item number 4 is less than 0.3. If we delete this item, the reliability (Cronbach’s alpha) increases to 0.872 [32].
Total correlation values of all items.
| Items | Corrected item-to item total correlation | Cronbach’s alpha if item deleted |
|---|
| Item 1 | 0.679 | 0.707 |
| Item 2 | 0.667 | 0.735 |
| Item 3 | 0.651 | 0.721 |
| Item 4 | 0.214 | 0.872 |
| Item 5 | 0.510 | 0.748 |
Factor Analysis (FA): It is a technique used to reduce a large number of variables into a smaller number based on the analysis of underlying factors. This technique extracts the maximum common variance from all available variables, providing a common score. When researchers are dealing with large datasets, FA can be used to group several variables into a few limited categories. It results in identifying only the important components of each variable [33].
Factor analysis consists of two parts: factor extraction and factor rotation.
Factor extraction helps to determine the number of factors to retain.
Factor rotation is a method that helps to mimimise the number of factors needed to explain each variable.
a. Factor extraction: In this there are two approaches to reduce the number of components: one is based on factor loadings, and the other is based on eigenvalues, as indicated by the scree plot [34].
i) Components as per factor loading: The purpose of PCA (Principal Component Analysis) is to identify a set of items related to a particular factor or domain, also referred to as a component. All related items will load onto one factor, while other items will load onto different factors, and so on. Based on these FA and factor loadings, the researcher must determine which items from the tool should be included in the pool or omitted. Items that do not load onto any component or have poor loadings will be deleted [34].
All seven items are divided into three major components [Table/Fig-5]. Component one includes three items (3,4,5), component two includes two items (1, 2), and component three covers two items (6,7), as per the component matrix [35].
Factor Analysis (FA) of all items.
| Rotated component matrix |
|---|
| Component |
|---|
| Item number | 1 | 2 | 3 |
|---|
| Item 1 | 0.215 | 0.680 | 0.145 |
| Item 2 | 0.175 | 0.738 | 0.256 |
| Item 3 | 0.812 | 0.123 | 0.145 |
| Item 4 | 0.986 | 0.375 | 0.356 |
| Item 5 | 0.734 | 0.254 | 0.278 |
| Item 6 | 0.124 | 0.189 | 0.783 |
| Item 7 | 0.156 | 0.257 | 0.896 |
ii) Components as per Eigen value/variance: Many times FA, Exploratory Factor Analysis (EFA), and Principal Components Analysis (PCA) are considered the same. However, in statistical analysis, PCA is most commonly applied. PCA helps to segregate the items based on variance. An eigenvalue above 1 indicates a higher percentage of variance accounted for by each component. The first component covers most of the variance, while the second, third, and subsequent components account for progressively less variance. Exploratory FA can be run only when there are sufficient number of samples are available [36].
The above [Table/Fig-6] shows that all seven items are divided into three components based on eigenvalue. Principal Component Analysis (PCA) helps in factor analysis where all items are pooled in a component. It would be helpful in instrument development in health sciences. Here, The first three components account for 94% of the variance [37].
Factor Analysis (FA) based on Eigen value.
| Initial eigen values | Rotation sums of squared loadings |
|---|
| Component | Total | % of variance | Cumulative % | Total | % of variance | Cumulative % |
|---|
| 1 | 4.131 | 52.0 | 52 | 4.131 | 50.0 | 50 |
| 2 | 3.027 | 37.0 | 89 | 3.027 | 39.0 | 89 |
| 3 | 1.468 | 5.0 | 94 | 1.468 | 5.0 | 94 |
| 4 | 0.733 | 3 | 97 | 0.733 | 3 | 97 |
| 5 | 0.612 | 2 | 99 | 0.612 | 2 | 99 |
| 6 | 0.589 | 0.60 | 99.6 | 0.589 | 0.60 | 99.6 |
Scree plot and Eigen value: A scree plot always displays the eigenvalues in a downward curve. It is determined by the eigenvalue, which is a measure of the amount of variance accounted for by a single factor. The eigenvalues are ordered from highest to lowest. An eigenvalue above one indicates a higher percentage of variance accounted for by each component. Factors that are above the “elbow” of the graph are considered components. A pool of items is allocated to a specific domain based on the matrix calculation, which is part of EFA [38].
The above [Table/Fig-7] explains the number of factors generated through the scree plot based on eigenvalue. It shows that two factors are generated, which account for 89% of the variance [Table/Fig-6]. The number of factors required for FA can be evaluated by studying the correlation matrix and the factors in the scree plot [39].
Scree plot showing eigenvalues.
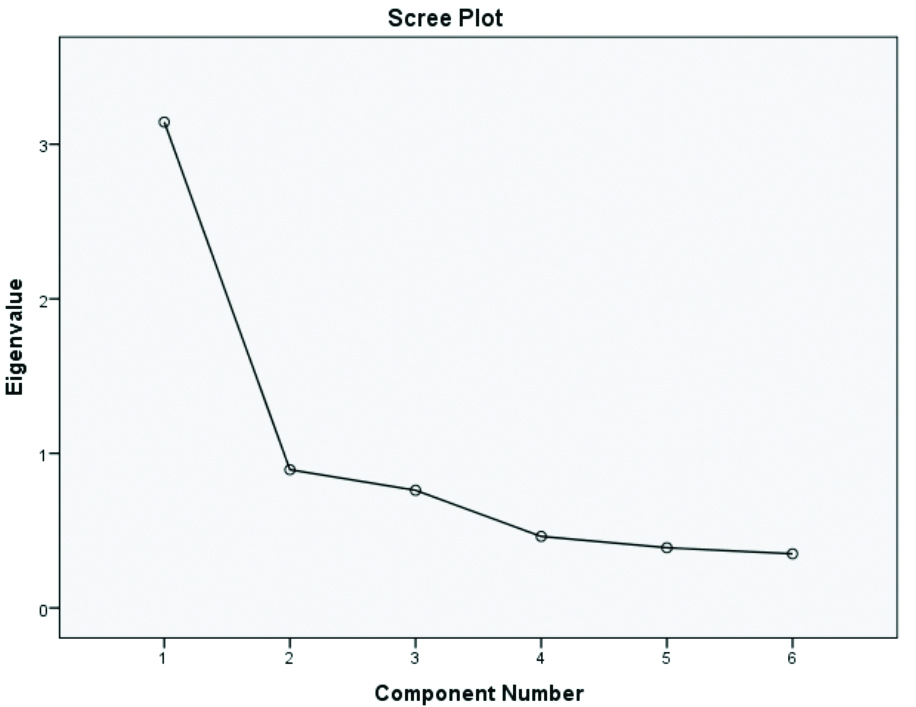
A scree plot is a statistical analysis that shows the amount of variance explained by a single factor in confirmatory FA. Suppose two factors explain the variance in five variables; in that case, those five items can be represented by the two factors. If it takes four factors to explain the variance in five variables, it is preferable to retain the original variables instead of replacing them with another factor. Inter-item correlation and item-total correlation play an important role in FA [40-42].
Conclusion(s)
The article explained the steps to be adopted for tool development and helps to understand the FA method for psychometric tool studies. The study concluded that item pool generation, review of existing tools, and expert opinion are required for the development of a preliminary draft. Face validity, content validity, and construct validity are primary steps for validating the tool. The reliability of the tool is measured by Cronbach’s alpha. Factor analysis helps to reduce the number of factors, while eigenvalues help determine the number of components in the tool. Researchers are advised to adopt a strategic plan to complete the study on time.
[1]. Haraldstad K, Wahl A, Andenæs R, Andersen JR, Andersen MH, Beisland E, A systematic review of quality of life research in medicine and health sciencesQual Life Res 2019 28(10):2641-50. [Google Scholar]
[2]. Sen S, Quality of life questionnaire applied in IndiaIn: Encyclopedia of Quality of Life and Well-Being Research 2023 ChamSpringer International Publishing:5730-32. [Google Scholar]
[3]. Morgado FFR, Meireles JFF, Neves CM, Amaral ACS, Ferreira MEC, Scale development: Ten main limitations and recommendations to improve future research practicesPsicol Reflex Crit 2017 30(1):3Available from: https://doi.org/10.1186/s41155-016-0057-1 [Google Scholar]
[4]. de Oliveira CAS, Firmino RT, de Morais Ferreira F, Vargas AMD, Ferreira EFE, Development and validation of the quality of life in the neighborhood questionnaire for children 8 to 10 years of age (QoL-N-Kids 8–10)Child Indic Res 2022 15(5):1847-70. [Google Scholar]
[5]. Vidhubala E, Kannan RR, Mani CS, Karthikesh K, Muthuvel R, Surendran V, Validation of quality of life questionnaire for patients with cancer- Indian scenarioIndian J Cancer 2005 42(3):138-44. [Google Scholar]
[6]. Tsang S, Royse CF, Terkawi AS, Guidelines for developing, translating, and validating a questionnaire in perioperative and pain medicineSaudi J Anaesth 2017 11(Suppl 1):S80-89. [Google Scholar]
[7]. Geerinck A, Beaudart C, Reginster JY, Locquet M, Monseur C, Gillain S, Development and validation of a short version of the sarcopenia quality of life questionnaire: The SF-SarQoLQual Life Res 2021 30(8):2349-62. [Google Scholar]
[8]. Boateng GO, Neilands TB, Frongillo EA, Melgar-Quiñonez HR, Young SL, Best practices for developing and validating scales for health, social, and behavioral research: A primerFront Public Health 2018 6:149 [Google Scholar]
[9]. Kiani Z, Simbar M, Hajian S, Development and psychometric evaluation of a quality of life questionnaire for infertile women: A mixed method studyReprod Health 2020 17(1):140-43. [Google Scholar]
[10]. MacKenzie SB, Podsakoff PM, Podsakoff NP, Construct measurement and validation procedures in MIS and behavioral research: Integrating new and existing techniquesMIS Q 2011 35(2):293 [Google Scholar]
[11]. Becker SP, Schindler DN, Holdaway AS, Tamm L, Epstein JN, Luebbe AM, The Revised Child Anxiety and Depression Scales (RCADS): Psychometric evaluation in children evaluated for ADHDJ Psychopathol Behav Assess 2019 41(1):93-106.10.1007/s10862-018-9702-6 [Google Scholar] [CrossRef]
[12]. Hinkin TR, A review of scale development practices in the study of organizationsJ Manag 1995 21(5):967-88. [Google Scholar]
[13]. Radez J, Waite P, Chorpita B, Creswell C, Orchard F, Percy R, Using the 11-item Version of the RCADS to Identify Anxiety and Depressive Disorders in AdolescentsRes Child Adolesc Psychopathol 2021 49(9):1241-57.10.1007/s10802-021-00817-w [Google Scholar] [CrossRef]
[14]. Reardon T, Spence SH, Hesse J, Shakir A, Creswell C, Identifying children with anxiety disorders using brief versions of the Spence Children’s Anxiety Scale for children, parents, and teachersPsychol Assess 2018 30(10):1342-55. [Google Scholar]
[15]. Hajiamini Z, Mohamadi A, Ebadi A, Fathi-Ashtiani A, Tavousi M, Montazeri A, The School Anxiety Scale-Teacher Report (SAS-TR): Translation and psychometric properties of the Iranian versionBMC Psychiatry 2012 12:82 [Google Scholar]
[16]. Tavakol M, Wetzel A, Factor analysis: A means for theory and instrument development in support of construct validityInt J Med Educ 2020 11:245-47. [Google Scholar]
[17]. Wong EL, Coulter A, Cheung AW, Yam CH, Yeoh EK, Griffiths S, Item generation in the development of an inpatient experience questionnaire: A qualitative studyBMC Health Serv Res 2013 13(1):265 [Google Scholar]
[18]. Wirihana L, Welch A, Williamson M, Christensen M, Bakon S, Craft J, Using Colaizzi’s method of data analysis to explore the experiences of nurse academics teaching on satellite campusesNurse Res 2018 25(4):30-34. [Google Scholar]
[19]. Vinik EJ, Vinik AI, Neumann SA, Lamichhane R, Morrison S, Colberg SR, Development and validation of the norfolk Quality of Life Fatigue Tool (QOL-F): A new measure of perception of fatigueJ Am Med Dir Assoc 2020 21(9):1267-72.e2. [Google Scholar]
[20]. Shamsalinia A, Moradi M, Rad RE, Ghadimi R, Farahani MA, Masoudi R, Design and psychometric evaluation of epilepsy-related apathy scale (E-RAS) in adults with epilepsy: A sequential exploratory mixed methods designBMC Neurol 2021 21(1):121Published 2021 Mar 17 [Google Scholar]
[21]. Patino CM, Ferreira JC, Internal and external validity: Can you apply research study results to your patients?J Bras Pneumol 2018 44(3):183 [Google Scholar]
[22]. Mousazadeh S, Rakhshan M, Mohammadi F, Investigation of content and face validity and reliability of Sociocultural Attitude towards Appearance Questionnaire-3 (SATAQ-3) among female adolescentsIran J Psychiatry 2017 12(1):15-20. [Google Scholar]
[23]. Shrotryia VK, Dhanda U, Content validity of assessment instrument for employee engagementSAGE Open 2019 9(1):21582440188 [Google Scholar]
[24]. Burckhardt CS, Anderson KL, The Quality of Life Scale (QOLS): Reliability, validity, and utilizationHealth Qual Life Outcomes 2003 1:60 [Google Scholar]
[25]. Verstraete J, Ramma L, Jelsma J, Item generation for a proxy health related quality of life measure in very young childrenHealth Qual Life Outcomes 2020 18(1):11Published 2020 Jan 1410.1186/s12955-020-1271-1 [Google Scholar] [CrossRef]
[26]. Vageriya V, Sharma A, Development of quality of life tool for children diagnosed with epilepsy- A pilot trialJ Clin of Diagn Res 2021 15(3):VC08-12. [Google Scholar]
[27]. De Silva SH, Jayasuriya AR, Rajapaksa LC, de Silva AP, Barraclough S, Development and validation of a measure of quality of life for the young elderly in Sri LankaAsia Pac J Public Health 2016 28(1 Suppl):115S-125S. [Google Scholar]
[28]. Tavakol M, Dennick R, Making sense of Cronbach’s alphaInt J Med Educ 2011 2:53-55. [Google Scholar]
[29]. Pandey S, Singhi P, Bharti B, Prevalence and treatment gap in childhood epilepsy in a north Indian city: A community-based studyJ Trop Pediatr 2014 60(2):118-23. [Google Scholar]
[30]. DeVon HA, Block ME, Moyle-Wright P, Ernst DM, Hayden SJ, Lazzara DJ, A psychometric toolbox for testing validity and reliabilityJ Nurs Scholarsh 2007 39(2):155-64. [Google Scholar]
[31]. Bukhsh A, Lee SWH, Pusparajah P, Schmitt A, Khan TM, Psychometric properties of the Diabetes Self-Management Questionnaire (DSMQ) in UrduHealth Qual Life Outcomes 2017 15(1):200 [Google Scholar]
[32]. Vedsted P, Sokolowski I, Heje HN, Data quality and confirmatory factor analysis of the Danish EUROPEP questionnaire on patient evaluation of general practiceScand J Prim Health Care 2008 26(3):174-80. [Google Scholar]
[33]. Bujang MA, Omar ED, Baharum NA, A review on sample size determination for Cronbach’s Alpha test: A simple guide for researchersMalays J Med Sci 2018 25(6):85-99.10.21315/mjms2018.25.6.9 [Google Scholar] [CrossRef]
[34]. Falcão F, Pereira DM, Gonçalves N, De Champlain A, Costa P, Pêgo JM, A suggestive approach for assessing item quality, usability and validity of automatic item generationAdv Health Sci Educ Theory Pract 2023 28(5):1441-65.10.1007/s10459-023-10225-y [Google Scholar] [CrossRef]
[35]. Skytt B, Högberg H, Engström M, An explorative and confirmative factor analysis of the Leadership and Management Inventory-II among staff working in elderly careLeadersh Health Serv (Bradf Engl) 2023 ahead-of-print(ahead-of-print):66-83.10.1108/LHS-01-2023-0004 [Google Scholar] [CrossRef]
[36]. Ledesma RD, Valero-Mora P, Macbeth G, The scree test and the number of factors: A dynamic graphics approachSpan J Psychol 2015 18:E11 [Google Scholar]
[37]. Pett MA, Lackey NR, Sullivan JJ, Making sense of factor analysis: The use of factor analysis for instrument development in health care research 2003 Thousand OaksSAGE PublicationsAvailable from: https://dx.doi.org/10.4135/9781412984898 [Google Scholar]
[38]. Boivin J, Takefman J, Braverman A, The fertility quality of life (FertiQoL) tool: Development and general psychometric propertiesHuman Reprod 2011 26(8):2084-91. [Google Scholar]
[39]. Maike R, Factor analysis: A short introduction, part 1, The Analysis Factor. PhD Maike R 2007 Available from: https://www.theanalysisfactor.com [Google Scholar]
[40]. Nie M, Liu C, Pan YC, Jiang CX, Li BR, Yu XJ, Development and evaluation of oral Cancer quality-of-life questionnaire (QOL-OC)BMC 2018 18(1):523 [Google Scholar]
[41]. Larsson F, Engström Å, Strömbäck U, Gustafsson S, Development and psychometric evaluation of the feeling safe during Surgery ScaleNurs Open 2021 8(5):2452-60.10.1002/nop2.1003 [Google Scholar] [CrossRef]
[42]. Dabaghi S, Zandi M, Ebadi A, Abbaszadeh A, Rohani C, Development and psychometric evaluation of the safety feeling scale in adult patients at hospital: Exploratory sequential mixed methodNurs Open 2023 10(9):6165-74.10.1002/nop2.1850 [Google Scholar] [CrossRef]