Introduction
Diabetes is a significant public health problem in India, with an estimated 74 million Indian adults suffering from the condition as of 2021, and the prevalence is continuing to grow.
Aim
To investigate the prevalence and forecasted trends of Diabetes Mellitus (DM) in India through time series analysis and forecasting models.
Materials and Methods
A cross-sectional study was conducted in the Department of Statistics at Manonmaniam Sundaranar University, Tirunelveli, Tamil Nadu, India, from January 2024 to March 2024. The prevalence of diabetes in India was forecasted from 2023 to 2035 using existing diabetes prevalence data from 2009 to 2021, with the help of Gretl software and the Autoregressive Intregated Moving Average (ARIMA) model.
Results
Authors observed a consistent upward trajectory in DM prevalence, with rates steadily increasing from 7.1% in 2009 to 9.6% in 2021. Time series analysis reveals non stationarity in the data, necessitating the use of ARIMA models for forecasting. Among the models considered, ARIMA (2,1,2) emerges as the best fit, demonstrating strong explanatory power with an R-squared value of 0.80. Forecasting projections indicate a continued rise in DM prevalence, with rates projected to increase from 10.35% in 2023 to 13.46% by 2035, which translates to an increase from 97.5 million in 2023 to 139 million in 2035.
Conclusion
These findings underscore the urgent need for comprehensive public health interventions to address the escalating burden of diabetes in India, emphasising the importance of prevention, early detection, and effective management strategies.
Introduction
The prevalence of Diabetes Mellitus (DM) represents a major and escalating global public health issue, marked by its rising incidence and the severe health complications it engenders. According to the International Diabetes Federation (IDF), approximately 536 million adults were living with diabetes worldwide in 2021, and this figure is anticipated to surge to 783 million by 2045 (IDF, 2019) [1]. This increase poses a substantial burden on health systems, economies, and societies, underscoring the critical need for effective preventive and management strategies.
In the context of India, the situation is particularly alarming. As one of the most populous countries in the world, India is experiencing an unprecedented rise in diabetes cases. The number of Indian adults with diabetes in 2021 was 74 million and is projected to reach 125 million by 2045 (IDF, 2021) [2]. Historical data from the Indian Council of Medical Research (ICMR) indicate that the number of adults with diabetes in India escalated from 26 million in 1990 to 65 million in 2016 [3]. Projections suggested that this number will reach 98 million by 2030 (ICMR, 2017) [4]. This dramatic rise can be attributed to a complex interplay of factors, including rapid urbanisation, sedentary lifestyles, unhealthy dietary patterns, and genetic susceptibility [5].
The increasing prevalence of diabetes in India not only strains healthcare resources but also has profound socio-economic implications. India has committed to reducing premature mortality due to Non Communicable Diseases (NCDs) by one-third, as per the Sustainable Development Goals (SDGs) target [6,7]. The National Health Policy of India (NHP-India), rolled out in 2017, aims to reverse the incidence of NCDs through preventive and curative approaches and commits to the free availability of drugs for selected NCDs through the public healthcare system, facilitated by the National Programme for NCDs [8,9].
Among the NCDs, diabetes was chosen because of its public health importance and the availability of reliable prevalence data from the IDF. Given the gravity of the diabetes epidemic, accurate forecasting of its prevalence is essential for informed healthcare planning and policymaking. Time series analysis and forecasting models, particularly the Autoregressive Integrated Moving Average (ARIMA) model, have proven to be invaluable tools in this regard. The ARIMA model, which integrates Autoregressive (AR) and Moving Average (MA) components with differencing to achieve stationarity, is renowned for its effectiveness in analysing and forecasting non-stationary time series data [10,11]. By leveraging historical data, these models can provide critical insights into future trends, enabling healthcare providers and policymakers to anticipate and address emerging challenges.
A comprehensive review of the existing literature reveals several key insights into the diabetes epidemic. Globally, the prevalence of diabetes has been on a steady rise, influenced by demographic shifts, lifestyle changes, and increasing life expectancy (NCD Risk Factor Collaboration, 2016) [12]. Studies have shown that urbanisation and associated lifestyle changes, such as reduced physical activity and unhealthy diets, are major drivers of the diabetes epidemic, particularly in developing countries [13,14]. In India, the burden of diabetes is exacerbated by specific socio-economic factors. For instance, the transition from traditional diets to high-calorie, low-nutrient foods has been linked to increased diabetes prevalence [15]. Additionally, genetic predisposition plays a significant role, with studies indicating a higher susceptibility to diabetes among South Asian populations [16].
Predictive models, such as ARIMA, have been extensively used in epidemiology to forecast disease trends. For example, studies by Chaurasia V and Pal S, Zhang X et al., have demonstrated the efficacy of ARIMA models in predicting the incidence of infectious diseases [17,18]. These models have also been applied to chronic diseases, providing valuable foresight for healthcare planning and resource allocation [17-19].
In present study, authors analysed the historical trends in the prevalence of diabetes in India from 2009 to 2021 using time series analysis and forecast the future prevalence up to 2035 utilising the ARIMA model. The objectives were to identify the best-fitting ARIMA model for the dataset, estimate future trends in diabetes prevalence, and discuss the implications of these projections for public health planning and policy. The significance of present study lies in its contribution to the existing body of knowledge by providing updated and precise estimates of diabetes prevalence in India. It also reinforces the importance of predictive modeling in public health, particularly in the context of chronic disease management.
Materials and Methods
A cross-sectional study was conducted in the Department of Statistics at Manonmaniam Sundaranar University, Tirunelveli, Tamil Nadu, India, from January 2024 to March 2024. In present study, data on the prevalence of DM data was used to predict the future trends in diabetes prevalence.
Study Procedure
The data was collected from the Internationals Diabetes Federation (IDF) annual report (https://diabetesatlas.org/data/en/). To predict the prevalence of DM cases, the ARIMA model was employed, which incorporates both AR and MA components. The ARIMA model is a widely used statistical technique for time series forecasting. It is characterised by three parameters: p, the order of the AR part; d, the degree of differencing needed to make the time series stationary; and q, the order of the MA part. The general form of the ARIMA model is expressed as ARIMA (p,d,q),

Where yt is the value at time t, φ is the parameter of AR and θ is parameter of the MA. AR component (p): This parameter represents the number of lagged observations included in the model. It quantifies the relationship between an observation and a number of lagged observations (previous values) [20,21].
Differencing (d): This parameter indicates the number of times the raw observations are differenced to make the time series stationary, meaning that it has a constant mean and variance over time.
MA component (q): This parameter represents the number of lagged forecast errors in the prediction equation. It captures the relationship between an observation and a residual error from a MA model applied to lagged observations.
Model selection and validation:
Stationarity check: The time series data must be stationary to apply the ARIMA model effectively. Stationarity implies that the statistical properties of the series do not change over time. The Augmented Dickey-Fuller (ADF) unit root test was used to assess stationarity. If the time series was not stationary, differencing was applied until stationarity was achieved.
Identifying AR and MA components: The Autocorrelation Function (ACF) and Partial Autocorrelation Function (PACF) plots help identify the appropriate values for p and q. ACF measures the correlation between observations at different lags, while PACF measures the correlation at a lag that is not accounted for by shorter lags.
Model fitting: Various ARIMA models were fitted, and the optimal model was selected based on the minimal Akaike Information Criterion (AIC) and Mean Squared Error (MSE). AIC provides a measure of model quality by balancing goodness of fit with model complexity, whereas MSE assesses the average squared difference between observed and predicted values.
Model diagnostics: The residuals of the selected model were analysed using ACF and PACF plots to ensure no significant autocorrelation remains. This step confirms that the model effectively captures all patterns in the data.
Forecasting: The selected ARIMA model was used to forecast future values of the time series. The accuracy of these forecasts was then validated against the testing set to ensure reliability.
Forecasting the Indian population: The age distribution of the Indian population between 20-79 years was 65.9%, according to the population pyramid published on PopulationPyramid.net, which is also consistent with National Sample Registration System (SRS) data [22,23]. Although SRS did not provide exact data on the proportion of the population between 20-79 years, it did present that 15-65 years accounted for 70% [23]. The total population of the country was derived by multiplying the 2023 population (1,428,626,763) by the Indian growth rate (0.9%) [24]. The population that will be affected by diabetes was calculated by multiplying the prevalence rate by the estimated population between 20-79 years.
Results
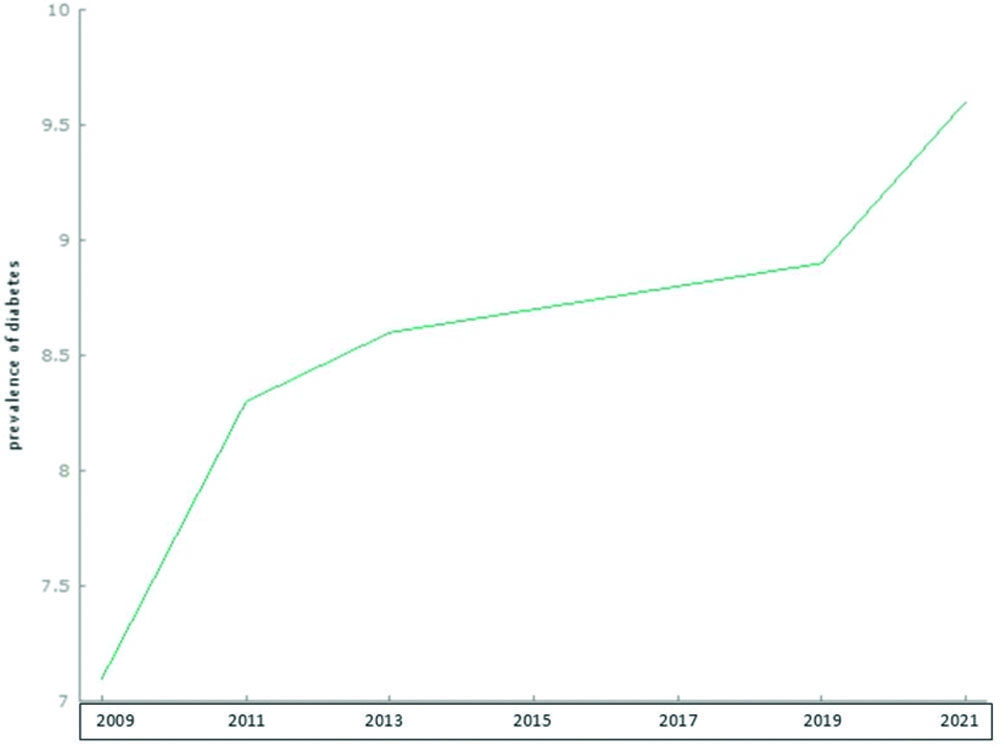
In 2009, the prevalence stood at 7.1%, serving as a baseline for understanding subsequent trends. By 2011, the prevalence had risen notably to 8.3%, indicating a significant increase of 1.2 percentage points over the span of two years. Continuing this trend, the prevalence climbed to 8.6% in 2013, representing a more modest but sustained increase of 0.3% points from 2011. By 2015, the prevalence reached 8.7%, indicating a slight uptick of 0.1% points compared to 2013. Although the rate of increase appears to decelerate, the overarching upward trend remains unequivocal. This trend persists into 2017, with the prevalence rising to 8.8%. This incremental increase of 0.1% points from 2015 reaffirms the pattern of gradual escalation in diabetes prevalence. By 2019, the prevalence surged further to 8.9%, underscoring a consistent upward trajectory in diabetes incidence. The most striking escalation occurs by 2021, when the prevalence sharply spikes to 9.6%. This substantial surge of 0.7% points from 2019 marks an accelerated pace in diabetes prevalence [Table/Fig-1].
Time series plot on prevalence of Diabetes Mellitus (DM) in India from 2009 to 2015.
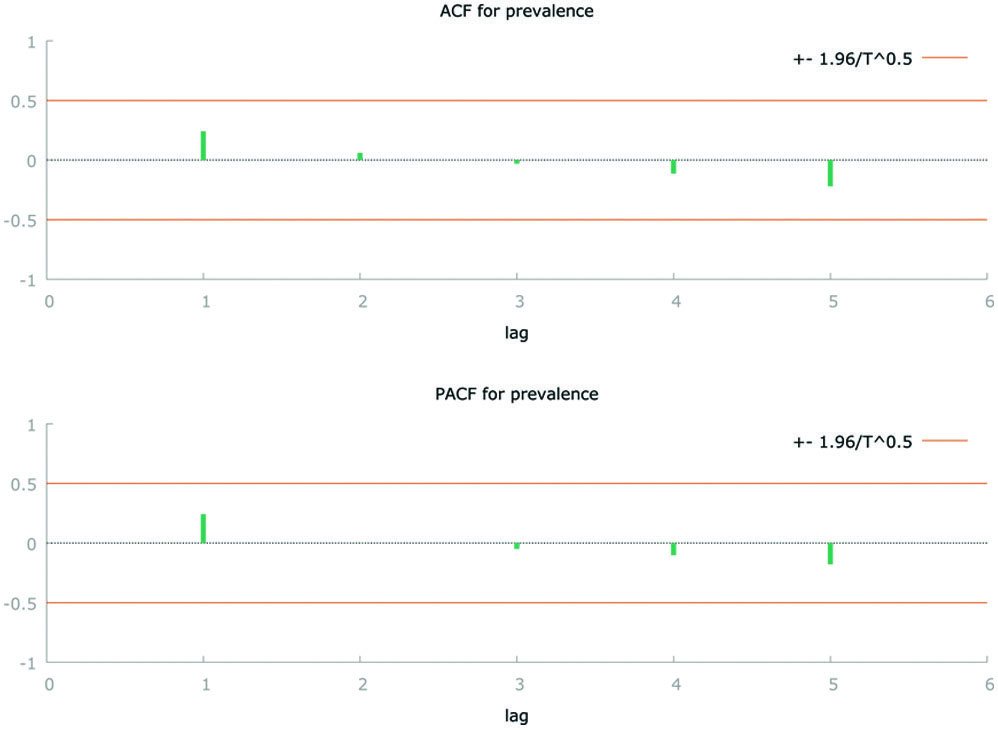
The stationarity of the data was assessed using the ACF and PACF, along with the ADF test [Table/Fig-2]. The analysis revealed that the data were non stationary, with the ACF indicating exponential decay. To achieve stationarity, the data needed to be transformed using differencing. Following the stationarity check, the best ARIMA model was selected based on the minimum AIC and MSE, as presented in [Table/Fig-3]. Among the models considered, ARIMA (2,1,2) stands out with the highest R-squared value of 0.80, indicating that it explains 80% of the variance in the data. This suggests a strong fit to the observed data, implying that the model captures a significant portion of the underlying patterns and dynamics in the time series.
Autocorrelation Function (ACF) and Partial Autocorrelation Function (PACF).
Selection of appropriate model for forecasting prevalence of DM in India from 2023 to 2035.
| Model | AIC | R-squared |
|---|
| ARIMA (1,0,1) | 19.98 | 0.66 |
| ARIMA (1,1,1) | 13.48 | 0.58 |
| ARIMA (2,1,1) | 15.24 | 0.64 |
| ARIMA (2,1,2) | 15.31 | 0.80 |
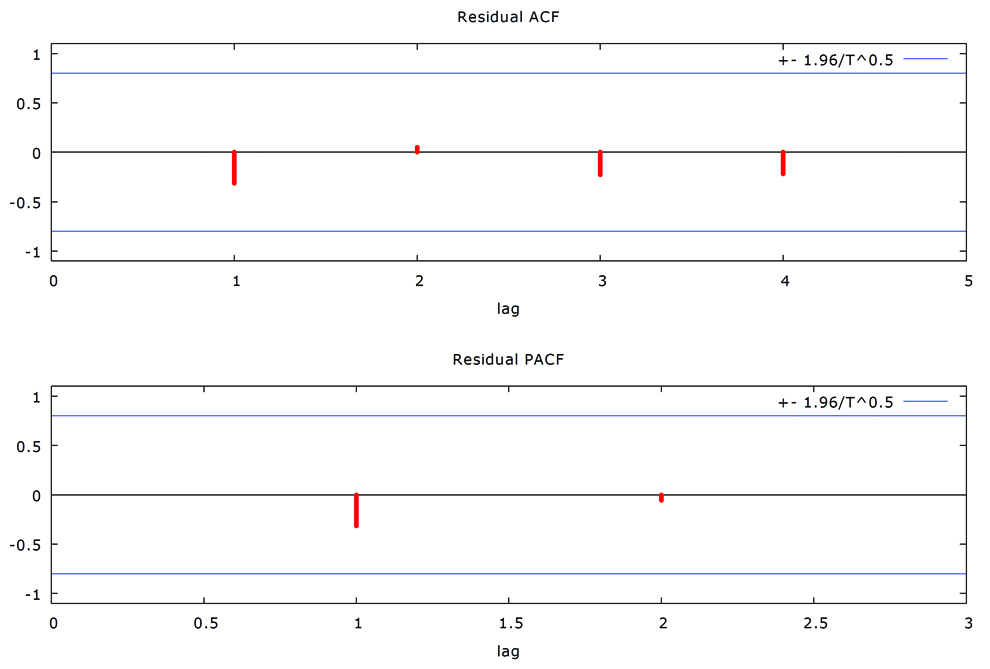
After selecting the optimal model, the parameters were estimated. Subsequently, the stationarity of the residuals was examined using the residual ACF and PACF plots [Table/Fig-4]. Finally, the selected ARIMA (2,1,2) model was utilised to forecast the prevalence of diabetes from 2023 to 2035.
Residual autocorrelation and partial autocorrelation function.
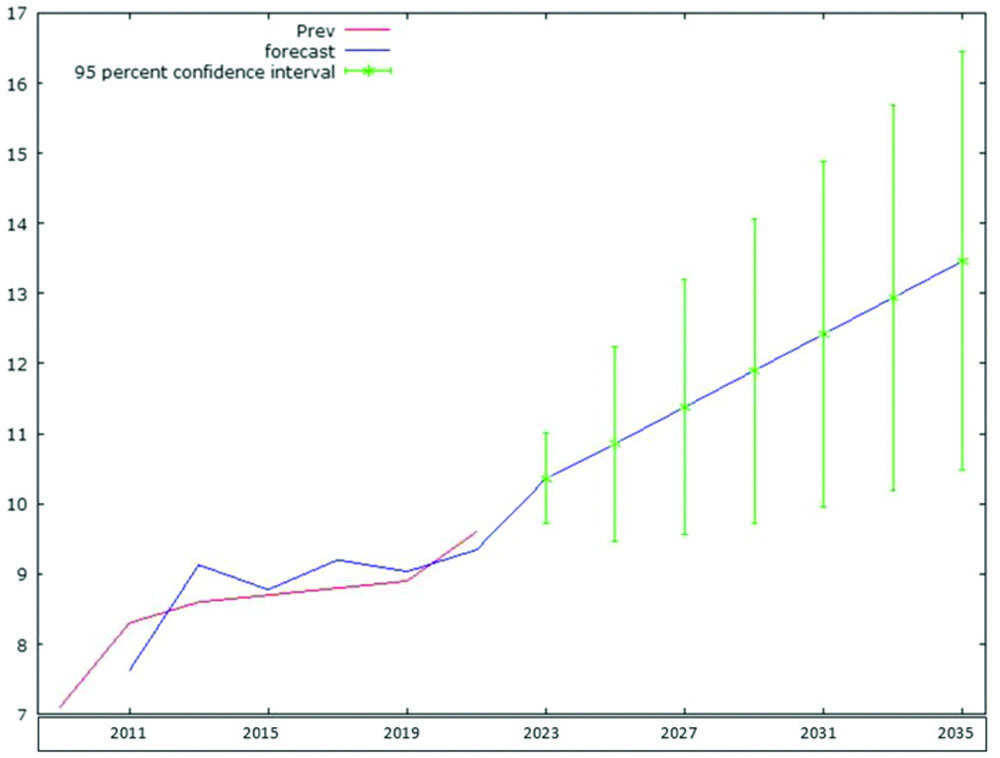
The analysis was conducted using Gretl software version 1.7.9. The forecasting data is plotted in a graph and shown in [Table/Fig-5]. The forecasted prevalence of diabetes is projected to rise from 10.35% in 2023 to 13.46% by 2035 [Table/Fig-6]. The 95% Confidence Intervals (CI) for each forecasted year provide a range within which the true prevalence is expected to lie. These intervals indicate a widening range, reflecting increasing uncertainty in long-term predictions but consistently pointing towards a higher prevalence.
Forecasted prevalence of DM in India from 2023 to 2035 with 95% Confidence Intervals (CI).
Forecasted prevalence of DM from 2023 to 2035 in India with 95% Confidence Intervals (CI).
| Year | Forecasted prevalence (%) | 95% CI | Estimated total Indian population | Total population in 20-79 year | No of people expected to be having DM |
|---|
| 2023 | 10.35 | (09.7, 11.0) | 1,428,627,663 | 941,465,630 | 97,527,366 |
| 2025 | 10.85 | (09.5, 12.2) | 1,454,606,724 | 958,585,831 | 104,082,291 |
| 2027 | 11.38 | (09.6, 13.2) | 1,479,578,522 | 975,042,246 | 110,962,733 |
| 2029 | 11.90 | (09.7, 14.1) | 1,503,470,597 | 990,787,123 | 117,909,612 |
| 2031 | 12.42 | (09.9, 14.9) | 1,526,208,889 | 1,005,771,658 | 124,927,903 |
| 2033 | 12.94 | (10.2, 15.7) | 1,547,689,834 | 1,019,927,601 | 131,993,930 |
| 2035 | 13.46 | (10.5, 16.4) | 1,567,802,259 | 1,033,181,689 | 139,086,919 |
Discussion
The findings of present study on the prevalence and forecasted trends of DM in India align with and contribute to the existing literature on the subject. The observed upward trend in diabetes prevalence, as well as the projected increases in the coming years, is consistent with findings by Anjana RM et al., who conducted a study in India and reported a significant rise in the prevalence of diabetes over the past decade, with rates increasing from 5.9% in 2005 to 7.7% in 2015 among adults aged 20 to 79 years [25]. Similarly, the IDF has projected a substantial increase in the number of individuals affected by diabetes in India, estimating that the country will have over 125 million adults with diabetes by 2045 (IDF, 2021) [2].
The forecasted trends in diabetes prevalence presented in present study are consistent with global projections and trends reported in other regions. For instance, a study by Bommer C et al., conducted a systematic review and meta-analysis of global diabetes prevalence trends and projected a significant increase in diabetes prevalence worldwide, particularly in low- and middle-income countries [26]. The selection of the ARIMA (1,2,1) model for forecasting diabetes prevalence aligns with recommendations from previous studies on time series analysis and forecasting. For example, a study by Hyndman and Athanasopoulos (2018) [27] provides comprehensive guidance on time series forecasting techniques, including the use of ARIMA models, and emphasises the importance of model selection based on criteria such as the AIC and MSE. The use of Gretl software for conducting the analysis also reflects a common approach employed in time series forecasting research (Gretl Team, 2022) [28].
The consistent increase in both prevalence rates and the absolute number of affected individuals highlights an urgent need for enhanced public health strategies. Efforts must focus on both the prevention and effective management of diabetes. The data suggest that without significant intervention, diabetes will continue to impose a growing economic and healthcare burden. This includes increased healthcare costs, greater demand for medical services, and a higher incidence of diabetes-related complications. Policymakers and healthcare providers must prioritise diabetes prevention programs, particularly targeting lifestyle modifications such as diet and physical activity. Investments in healthcare infrastructure, including widespread access to diabetes screening and management, are crucial. Public health campaigns to raise awareness about diabetes risk factors and the importance of early diagnosis and treatment will be vital in curbing this trend.
The discussion of the implications of rising diabetes prevalence for public health policy and practice aligns with recommendations from various global health organisations and initiatives. The World Health Organisation (WHO) has identified diabetes as a major public health priority, calling for multisectoral action to prevent and control the disease (WHO, 2021) [29]. Similarly, the IDF advocates for comprehensive strategies to address diabetes, including health promotion, early detection, and access to quality care and treatment (IDF, 2021) [2].
In summary, the findings of present study contribute to the growing body of evidence on the epidemiology and public health implications of diabetes in India and globally. By aligning with existing literature and recommendations from global health organisations, the present study underscores the urgent need for proactive measures to address the rising burden of diabetes and improve health outcomes for affected individuals and populations. Population-based screening and management should be strengthened through our National Health Program, especially for rural and underserved populations [9,30,31].
Limitation(s)
The IDF publishes prevalence data once every two years; however, yearly data would provide a more robust forecast than data collected biennially. The prevalence and incidence of diabetes can vary due to many modifiable factors such as exercise, diet, alcohol consumption, and smoking. In present analysis, authors had considered a short time frame (until 2035), which may result in minimal changes in lifestyle modification and could affect present model predictions. In present data, authors found that 65.9% of the population falls within the age group of 20-79 years, based on information from the Indian SRS and PopulationPyramid.net. However, the IDF has used a figure of 55% for the population in this age group. According to IDF data, in 2021, diabetes cases among individuals aged 20-79 years in India totaled 74.2 million, resulting in a prevalence rate of 0.096. Given that the total population of India was 1,402 million, this translates to 55%. Using 55% of the population in the age group of 20-79 years would likely lead to an underestimation of the absolute number of diabetes cases. In contrast, present analysis utilised the figure of 65.9% based on the SRS and data published on PopulationPyramid.net.
Conclusion(s)
The analysis of diabetes prevalence in India from 2009 to 2021 reveals a troubling and persistent upward trend, with the prevalence rising from 7.1% in 2009 to 9.6% in 2021. Utilising the ARIMA (1,2,1) model, authors projected that this trend will continue, with the prevalence expected to reach 13.46% by 2035. These findings underscore the escalating diabetes epidemic in India and highlight the urgent need for comprehensive public health interventions. By leveraging predictive models like ARIMA, stakeholders can anticipate trends and implement timely measures to curb the diabetes epidemic and improve health outcomes for the population.
[1]. International Diabetes FederationIDF Diabetes Atlas-9th Edition 2019 [Internet] 2019 [cited 2020 Feb 29]. Available from: https://www.diabetesatlas.org/en/ [Google Scholar]
[2]. International Diabetes FederationIDF Diabetes Atlas 10th Edition [Internet] 2021 [cited 2024 Feb 23]. Available from: https://diabetesatlas.org/idfawp/resource-files/2021/07/IDF_Atlas_10th_Edition_2021.pdf [Google Scholar]
[3]. Tandon N, Anjana RM, Mohan V, Kaur T, Afshin A, Ong K, The increasing burden of diabetes and variations among the states of India: The Global Burden of Disease Study 1990-2016Lancet Glob Heal 2018 6:e1352-62. [Google Scholar]
[4]. Indian Council of Medical Research-Ansari Nagar New DelhiICMR guidelines for management of type 2 diabetes 2018 [Internet] 2018 [cited 2024 May 28]. Available from: https://main.icmr.nic.in/sites/default/files/guidelines/ICMR_GuidelinesType2diabetes2018_0.pdf [Google Scholar]
[5]. Ramachandran A, Snehalatha C, Ma RCW, Diabetes in South-East Asia: An updateDiabetes Res Clin Pract 2014 103:231-37. [Google Scholar]
[6]. The United Nations Development ProgrammeSustainable Development goals [Internet] 2015 [cited 2020 Mar 11]. Available from: https://www.undp.org/content/dam/undp/library/corporate/brochure/SDGs_Booklet_Web_En.pdf [Google Scholar]
[7]. World Health OrganizationWorld health statistics 2016: Monitoring health for the SDGs sustainable development goals 2016 1st edGenevaWorld Health Organization [Google Scholar]
[8]. Ministry of Helath and Family Welfare-Government of IndiaNational Health Policy 2017 [Internet] 2018 [cited 2019 Dec 21]. Available from: https://mohfw.gov.in/sites/default/files/9147562941489753121.pdf [Google Scholar]
[9]. Ministry of Health and Family Welfare-Goverment of IndiaOperational Guidelines for National Programme for Prevention and Control of Non-Communicable Diseases 2023-2030 [Internet] 2023 New DelhiAvailable from: https://www.slideshare.net/meetdrahmedmostaque/revised-operational-guidelines-of-npncd-20232030pdf [Google Scholar]
[10]. Box GEP, Jenkins GM, Reinsel GC, Ljung GM, Time series analysis: Forecasting and control 2015 John Wiley & Sons [Google Scholar]
[11]. Manikandan M, Prasad V, Mishra AK, Konduru RK, Newtonraj A, Forecasting road traffic accident deaths in India using seasonal autoregressive integrated moving average modelInt J Community Med Public Heal 2018 5:3962 [Google Scholar]
[12]. Zhou B, Lu Y, Hajifathalian K, Bentham J, Di Cesare M, Danaei G, Worldwide trends in diabetes since 1980: A pooled analysis of 751 population-based studies with 4.4 million participantsLancet (London, England) 2016 387:1513-30. [Google Scholar]
[13]. Hu FB, Globalization of diabetes: The role of diet, lifestyle, and genesDiabetes Care 2011 34:1249-57. [Google Scholar]
[14]. Newtonraj A, Vincent A, Gowtham PJ, Haritha S, Ilaveyini S, Level of insufficient physical activity among adults in a rural area of South India: A population-based cross-sectional studyJ Curr Res Sci Med 2019 5:105 [Google Scholar]
[15]. Misra A, Khurana L, The metabolic syndrome in South Asians: Epidemiology, determinants, and preventionMetab Syndr Relat Disord 2009 7:497-514. [Google Scholar]
[16]. Unnikrishnan R, Anjana RM, Mohan V, Diabetes in South Asians: Is the phenotype different?Diabetes [Internet] 2014 [cited 2024 May 28] 63:53-55.Available from: https://pubmed.ncbi.nlm.nih.gov/24357697/ [Google Scholar]
[17]. Chaurasia V, Pal S, Application of machine learning time series analysis for prediction COVID-19 pandemicRes Biomed Eng 2020 38:35-47. [Google Scholar]
[18]. Zhang X, Zhang T, Young AA, Li X, Applications and comparisons of four time series models in epidemiological surveillance dataPLoS One 2014 9:88075 [Google Scholar]
[19]. Zhao D, Zhang H, Cao Q, Wang Z, He S, Zhou M, The research of ARIMA, GM(1,1), and LSTM models for prediction of TB cases in ChinaPLoS One 2022 17:e0262734 [Google Scholar]
[20]. Fuqua School of Business Duke UniversityARIMA models for time series forecasting [Internet][cited 2024 Aug 7]. Available from: https://people.duke.edu/~rnau/411arim.htm [Google Scholar]
[21]. Newtonraj A, Mani M, Autoregressive integrated moving average model for forecasting COVID-19 in IndiaJournal of Postgraduate Medicine, Education and Research 2020 54(3):122-25. [Google Scholar]
[22]. Creative CommonsPopulation Pyramid [Internet][cited 2024 Aug 7]. Available from: https://www.populationpyramid.net/india/2024/ [Google Scholar]
[23]. Office of the Registrar General & Census Commisioner-Ministrty of Home Affairs-Government of IndiaSample registration system statistical report 2020 [Internet][cited 2024 Mar 20]. Available from: https://censusindia.gov.in/nada/index.php/catalog/44376/download/48048/SRS_STAT_2020.pdf [Google Scholar]
[24]. WorldometerIndian Polpulation Live [Internet] 2024 [cited 2024 May 28]. Available from: https://www.worldometers.info/world-population/india-population/ [Google Scholar]
[25]. Anjana RM, Deepa M, Pradeepa R, Mahanta J, Narain K, Das HK, Prevalence of diabetes and prediabetes in 15 states of India: Results from the ICMR-INDIAB population-based cross-sectional studyLancet Diabetes Endocrinol 2017 5:585-96. [Google Scholar]
[26]. Bommer C, Sagalova V, Heesemann E, Manne-Goehler J, Atun R, Bärnighausen T, Global economic burden of diabetes in adults: Projections from 2015 to 2030Diabetes Care 2018 41:963-70. [Google Scholar]
[27]. Hindman RJ, Athanasopoulos G, Forecasting: Principles and Practice[Internet] 2021 3rd EdAustraliaOTexts[cited 2024 Aug 7]. Available from: https://otexts.com/fpp3/ [Google Scholar]
[28]. Gretl TeamGNU regression, Econometrics and Time-series Library [Internet] 2024 [cited 2024 May 27]. Available from: https://gretl.sourceforge.net/ [Google Scholar]
[29]. World Health OrganizationWHO Global report on diabetes [Internet] 2024 [cited 2024 Aug 7]. Available from: https://www.who.int/publications/i/item/9789241565257 [Google Scholar]
[30]. Newtonraj A, Arun S, Bazroy J, Tovia S, Lay perspectives on causes and complications of hypertension; and barrier to access health care by known hypertensive patients: A qualitative study from a rural area of South IndiaInt J Community Med Public Heal 2017 4:704-07. [Google Scholar]
[31]. Newtonraj A, Selvaraj K, Purty AJ, Nanda SK, Arokiaraj MC, Vincent A, Feasibility and outcome of community-based screening for cardiovascular disease risk factors in a remote rural area of South India: The Chunampet rural-Cardiovascular health assessment and management programIndian J Endocrinol Metab 2019 23:628 [Google Scholar]