Gestation, defined as the period between conception and delivery, is associated with an increased dietary protein demand. During pregnancy, a female undergoes numerous physiological changes, along with the rapid growth of the foetus and the placenta [1]. Therefore, from this perspective, the nutritional status during pregnancy is considered a determinant factor for maternal and neonatal health outcomes [2,3].
If pregnancy is associated with an improper diet leading to protein deficiency, the prospects for maternal and foetal outcomes may be catastrophic. Protein and vitamin deficiencies are common among pregnant women belonging to lower socioeconomic groups, which can adversely affect serum protein concentrations [4]. From a biochemical viewpoint, nutritional status is assessed through various tests that measure levels of haemoglobin, circulating iron, vitamins, and trace elements [5,6].
To ensure the development of the foetus, the body undergoes a series of physiological changes. Progesterone and estrogen levels increase throughout pregnancy, which suppresses the hypothalamus and, consequently, menstrual cycles [7]. These alterations, necessary to cope with adaptations, are reflected in the biochemical profiles and are distinct from the non-pregnant state.
Protein status is typically evaluated by measuring levels of total serum proteins, albumin, or the plasma ratio of non-essential to essential amino acids [8]. Albumin constitutes 41-53 g/L of plasma proteins in normal non-pregnant females [9] and plays a major role in stabilising extracellular fluid volume by contributing to the oncotic pressure of plasma. Albumin levels generally decrease during pregnancy due to increased blood volume and transfer to the foetus. However, significant deviations from the expected decrease could indicate underlying issues such as protein malnutrition or liver dysfunction [10].
Globulins are a group of proteins found in blood and are synthesised by the liver. They play important roles in liver function, blood clotting, and fighting infections [11]. Levels of alpha-1 and alpha-2 globulins typically increase during pregnancy, particularly in the third trimester [12,13]. This rise is attributed to the production of pregnancy-associated proteins like alpha-fetoprotein and alpha-1-antitrypsin, which contribute to foetal development and maternal health [10]. Significant deviations from the expected rise could warrant further investigation. Beta globulin levels, particularly transferrin, may increase during pregnancy due to the heightened iron demands of the developing foetus [14]. However, significant deviations could indicate underlying conditions such as infections or liver disease. Gamma globulin levels may not significantly change during pregnancy, but the specific types of immunoglobulins can be altered [15].
Gel electrophoresis is a widely recognised technique used to separate and identify serum protein fractions, namely albumin, α1-globulin, α2-globulin, β-globulin, and γ-globulin, based on charge, size, and isoelectric point [16]. It is a convenient, fast, and inexpensive method, as it requires only microgram quantities of protein [17]. The electrophoretic patterns of serum proteins in pregnant women have also been previously investigated. Brown T reported decreased total serum protein and serum albumin in the third trimester of pregnancy [18]. Kulkarni BS et al., also reported a decline in total protein due to a decrease in the albumin fraction [19].
Pregnancy represents the most anabolic period of a female’s life cycle. Protein, as a nutrient, is an essential component for the proper development of a growing foetus. Despite the importance of maintaining adequate levels of plasma proteins in pregnant women, there are not enough studies on the prevalence of protein deficiencies, and data from descriptive and analytical assessments remain insufficient. This study focuses on pregnant women in Central India and aims to contribute valuable data on protein profiles specific to this underrepresented population. Additionally, this study examines protein patterns within defined gestational age ranges (e.g., 1st, 2nd, and 3rd trimesters) rather than throughout the entire pregnancy, providing a more detailed picture of how protein levels change during pregnancy in this population.
Therefore, in light of these considerations, the present study was undertaken to assess serum protein levels and their fraction patterns using gel electrophoresis in healthy pregnant women attending an antenatal clinic in a tertiary care hospital setting.
Materials and Methods
This was a cross-sectional study conducted in the Department of Medical Biochemistry in collaboration with the Department of Obstetrics and Gynecology at Sultania Zanana Hospital, associated with Gandhi Medical College, Bhopal, Madhya Pradesh, India. A total of 70 pregnant women who attended the antenatal care clinic between January 2021 and February 2021 were screened for enrolment in the study. Out of these, 50 pregnant women agreed to participate and were deemed eligible in the first trimester, yielding a response rate of 71.42%. These same 50 pregnant women were followed up for investigations in the second and third trimesters. Along with this, 50 normal non-pregnant healthy women of childbearing age were also included in this study. Normal pregnant women in their first trimester, aged between 20 and 30 years, with singleton pregnancies, and who were normotensive and normoglycaemic, were included in the study. Pregnant women with pre-existing medical conditions such as thyroid problems, hypertension, gestational diabetes, urinary tract infections, renal disease, or any history of obstetric or medical complications were excluded from the study. Enrolment of study participants was conducted after obtaining approval from the Institutional Ethics Committee (Letter No. 11595/MC/IEC/2020, Bhopal, dated 14/05/2020) at Gandhi Medical College, Bhopal, and written informed consent was obtained from all study participants. After enrolment, all participants underwent a detailed clinical history, general physical examination, systemic examination, and data were recorded in a case proforma sheet. The Body Mass Index (BMI) was calculated, and the study participants were categorised based on their BMI according to the criteria of the World Health Organisation (WHO) [25]. The socio-economic status of the study participants was classified according to the BG Prasad socio-economic classification [26,27]. For the convenience of statistical calculation the upper class and upper middle class were categorised as “upper class”, the middle class were categorised as “middle class” and lower middle class and lower class were categorised as “lower class”.
Sample collection and lab investigations: A 5 mL fasting blood sample was collected in a plain test tube and an EDTA tube. To separate the serum, the blood was centrifuged, and the serum was stored in an Eppendorf tube at 2-8°C for the study of electrophoretic patterns of serum proteins in the Department of Medical Biochemistry. Routine laboratory investigations, such as a Complete Blood Count (CBC with haemoglobin) and serum glucose, were conducted in the clinical lab and recorded in the case sheets. Serum total protein, albumin, and globulin levels were estimated using a fully automated chemistry analyser in the clinical biochemistry laboratory and the Multidisciplinary Research Unit. To study the electrophoretic pattern of serum protein fractions (albumin, alpha-1 globulin, alpha-2 globulin, beta globulin, and gamma globulin), serum proteins were analysed using an automated gel electrophoresis apparatus (HYDRASCAN, SEBIA, France) for all blood samples.
Statistical Analysis
The Epi-info statistical software was used for data analysis. Descriptive statistics were calculated using frequencies and percentages for categorical data, and means and standard deviations for continuous data. Data were presented as Mean±SD, number (n), and percentage (%). Differences were assessed using student’s t-tests for continuous data and Chi-square tests for categorical data. An ANOVA (Analysis of Variance) test was also employed to assess differences among groups. Statistical significance was considered to be p<0.05.
Results
According to [Table/Fig-1], the mean age of women in the non-pregnant participant group was 25.14±3.72 years, while the mean age for women in the pregnant participant group was 24.18±3.35 years. Out of 100 participants, the majority of women, 72 (72%), belonged to rural areas, while only 28 (28%) were from urban areas. Eleven out of the 100 women were from a higher socio-economic background, while 27% and 62% belonged to middle and lower socio-economic groups, respectively. Additionally, most of the participants (62%) were non-vegetarian, while 38% were vegetarian.
Demographic, clinical and biochemical characteristics of all healthy non-pregnant and pregnant women.
| Parameters | Healthy non-pregnant women (n=50) | Pregnant women (n=50) | χ2 | p-value |
|---|
| First trimester | Second trimester | Third trimester |
|---|
| Age (Years) | 25.14±3.72 | 24.18±3.35 | | 0.178 |
| Urban/Rural {n (%)} | 17 (34%)/33 (66%) | 11 (22%)/39 (78%) | 1.785 | 0.181 |
| Vegetarian/Non-vegetarian {n (%)} | 20 (40%)/30 (60%) | 18 (36%)/32 (64%) | 0.169 | 0.680 |
| Socio-economic status (Upper/Middle/Lower) (n (%)) | 6 (12%)/14 (28%)/30 (60%) | 5 (10%)/13 (26%)/32 (64%) | 0.192 | 0.908 |
| Primigravida/Multigravida {n (%)} | | 21 (42%)/29 (58%) | | |
| Height (m) | 1.58±0.06 | 1.56±0.06 | | 0.098 |
| Weight (Kg) | 57.38±5.14 | 52.60±9.30 | 53.05±10.05 | 54.48±8.35 | | 0.022 |
| BMI (kg/m2) | 23.03±2.23 | 21.45±5.02 | 21.76±4.13 | 22.45±2.96 | | 0.150 |
| SBP (mmHg) | 124.24±5.43 | 116.10±12.06 | 113.84±11.34 | 116.68±10.1 | | ≤0.001 |
| DBP (mmHg) | 81.84±5.64 | 76.12±10.99 | 75.52±10.79 | 77.76±9.11 | | 0.003 |
| Haemoglobin (g/dL) | 12.1±1.32 | 11.2±1.11 | 11.0±0.98 | 10.23±1.21 | | ≤0.001 |
| Fasting serum glucose (mg/dL) | 84.3±8.21 | 86.0±6.67 | 89.12±7.76 | 102.1±4.53 | | ≤0.001 |
BMI: Body mass index; SBP: Systolic blood pressure; DBP: Diastolic blood pressure; Data is presented as mean±SD percentage (%) and number of individuals (n), ANOVA (Analysis of Variance) test, Student t-test and Chi-square test are applied for analysis; p<0.05 is considered as significance level
However, no significant difference was found between the groups for the aforementioned variables. A significant difference was reported for Systolic Blood Pressure (SBP), Diastolic Blood Pressure (DBP), haemoglobin, and serum glucose levels among the groups. There was no significant difference found in BMI among the groups. According to [Table/Fig-2], the majority of women (67%) had a normal BMI. Fourteen percent were underweight, 17% were overweight, and 2% were classified as obese.
Distribution of study subjects based on their Body Mass Index (BMI) status.
| Study group | BMI (Kg/m2) | Number (n) | Percentage (%) |
|---|
| Under weight | <18.5 | 14 | 14.00% |
| Normal weight | 18.5-24.9 | 67 | 67.0% |
| Over weight | 25-29.9 | 17 | 17.00% |
| Obese | ≥30 | 2 | 2.0% |
BMI: Body mass index; Number (n); Percentage (%)
The serum protein levels among normal non-pregnant women and pregnant women in the first, second, and third trimesters are presented in [Table/Fig-3].
Values of serum total protein, albumin and globulin in non-pregnant and pregnant women trimester wise.
| Group | Total protein (g/dL) (Mean±SD) | Serum albumin (g/dL) (Mean±SD) | Serum globulin (g/dL) (Mean±SD) | A/G ratio (Mean) |
|---|
| Non-pregnant women (n=50) | 6.36±0.40 | 3.90±0.30 | 2.46±0.28 | 1.60 |
| First trimester pregnant women (n=50) | 8.1±0.40 | 4.24±0.38 | 3.86±0.22 | 1.10 |
| Second trimester pregnant women (n=50) | 8.0±0.42 | 4.58±0.14 | 3.42±0.20 | 1.34 |
| Third trimester pregnant women (n=50) | 6.36±0.43 | 3.87±0.36 | 2.49±0.24 | 1.56 |
| p-value | ≤0.001 | ≤0.001 | ≤0.001 | |
Data is presented as mean±SD, ANOVA test is applied for analysis of groups; p<0.05 is considered as significance level
The mean total serum protein concentration in non-pregnant women was 6.36±0.40 g/dL, while in pregnant women, it was reported as 8.01±0.40 g/dL, 8.00±0.42 g/dL, and 6.36±0.43 g/dL in the first (T1), second (T2), and third (T3) trimesters, respectively. The mean serum albumin levels were noted to be 3.90±0.30 g/dL for non-pregnant women, while they were 4.24±0.38 g/dL, 4.58±0.34 g/dL, and 3.87±0.36 g/dL for pregnant women in T1, T2, and T3, respectively. The total globulin levels in non-pregnant women were 2.46±0.28 g/dL, whereas the values reported for pregnant women in T1, T2, and T3 were 3.86±0.22 g/dL, 3.42±0.20 g/dL, and 2.49±0.24 g/dL, respectively. The differences in serum protein, albumin, and globulin levels among the groups were found to be statistically significant. Data regarding the various fractions of proteins as a percentage of total proteins are detailed in [Table/Fig-4].
Electrophoretic patterns of serum proteins in healthy non-pregnant and pregnant women.
| Group | Total protein mean value (gram/100 mL) | Albumin (%) | Globulin | Total globulin (%) | A/G ratio |
|---|
| α1 Globulin (%) | α2 Globulin (%) | β Globulin (%) | γ Globulin (%) |
|---|
| Non-pregnant women (n=50) | 6.4 | 61.5 | 2.8 | 10.8 | 11.1 | 13.8 | 38.5 | 1.60 |
| Pregnant women first trimester (n=50) | 8.1 | 52.4 | 4.8 | 16.7 | 8.5 | 17.6 | 47.6 | 1.10 |
| Pregnant women second trimester (n=50) | 8.0 | 57.3 | 4.2 | 9.0 | 18.6 | 10.9 | 42.7 | 1.34 |
| Pregnant women third trimester (n=50) | 6.4 | 60.9 | 3.4 | 10.9 | 12.1 | 12.7 | 39.1 | 1.56 |
Data is presented as mean, Percentage (%) and Number of individuals (n)
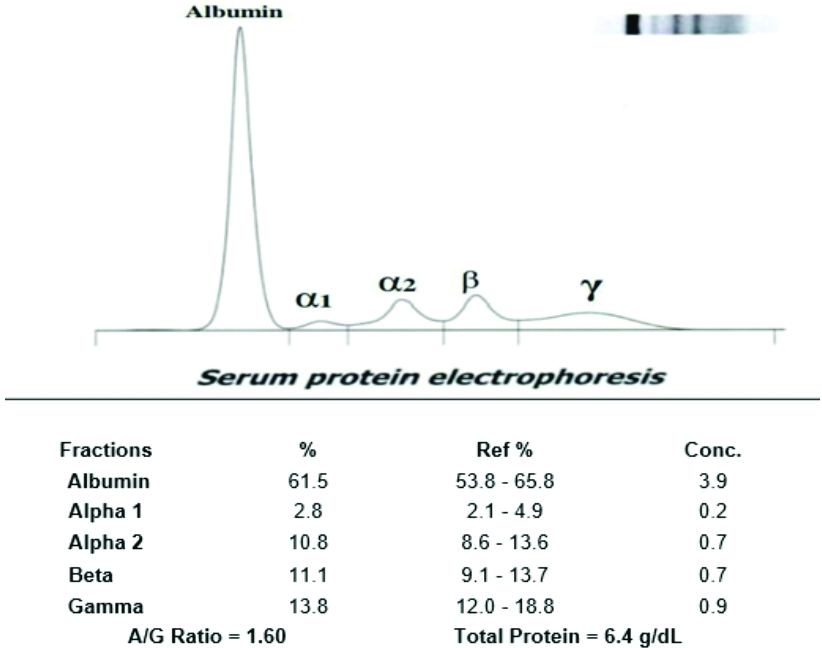
The alpha-1 globulin levels were found to be 2.8 gm% for non-pregnant subjects, 4.8 gm% for the first trimester (T1), 4.2 gm% for the second trimester (T2), and 3.4 gm% for the third trimester (T3). The alpha-2 globulin fractions were reported to be 10.8 gm% for non-pregnant women, while they were 16.7 gm%, 9.0 gm%, and 10.9 gm% for pregnant women in T1, T2, and T3, respectively. The beta globulin levels were 11.1 gm% for non-pregnant women, 8.5 gm% for T1, 18.6 gm% for T2, and 12.1 gm% for T3 in pregnant women. Gamma globulin levels were reported to be 13.8 gm% for non-pregnant women, 17.6 gm% for T1, 10.9 gm% for T2, and 12.7 gm% for T3. The A:G ratio was found to be 1.60 for non-pregnant women, while for pregnant women, it showed a steady increment with increasing gestational age, measuring 1.10, 1.34, and 1.56 for T1, T2, and T3, respectively, as shown in [Table/Fig-4]. The representative image of serum protein electrophoresis for non-pregnant women is shown in [Table/Fig-5].
Representative image of serum protein electrophoresis (non-pregnant women).
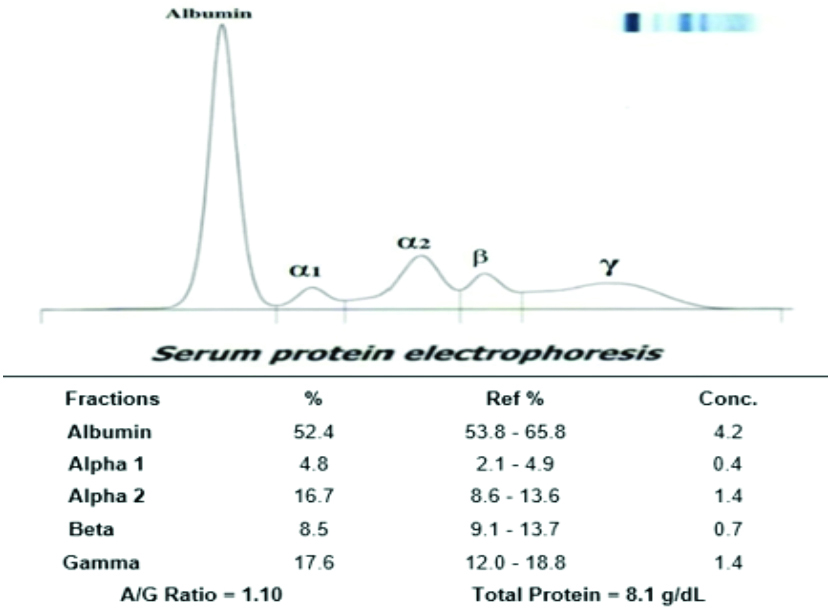
In normal pregnant women, all fractions, such as albumin, alpha-1 globulin, alpha-2 globulin, beta globulin, and gamma globulin, did not show any deviation from the normal values. The representative image of serum protein electrophoresis for pregnant women in the first trimester showed a decrease in albumin and beta globulin levels, along with an increase in alpha-2 globulin levels, as demonstrated in [Table/Fig-6]. The representative image of serum protein electrophoresis for pregnant women in the second trimester is shown in [Table/Fig-7].
Representative image of serum protein electrophoresis (first trimester pregnant women).
Representative image of serum protein electrophoresis (second trimester pregnant women).
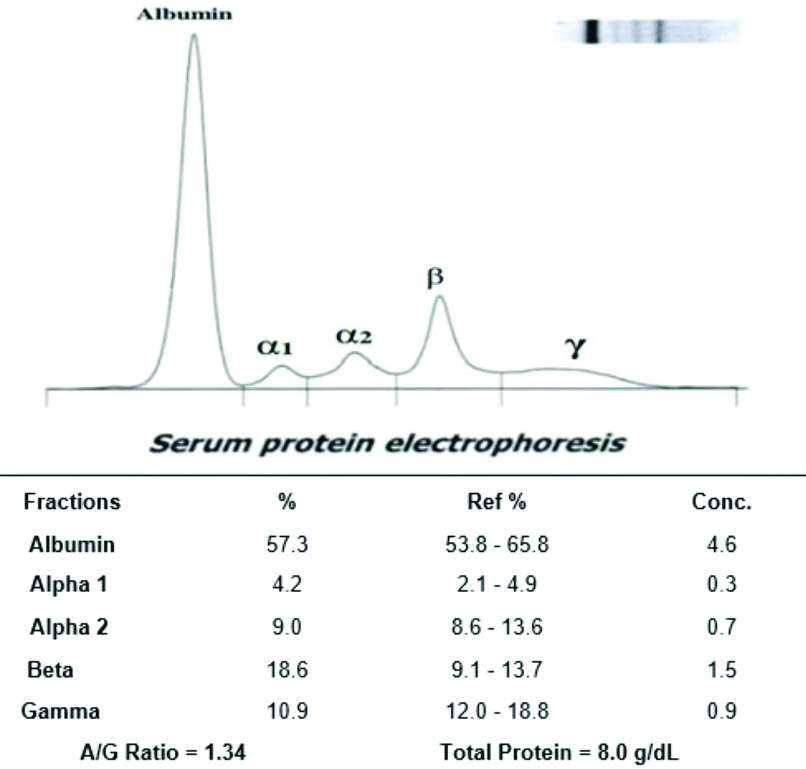
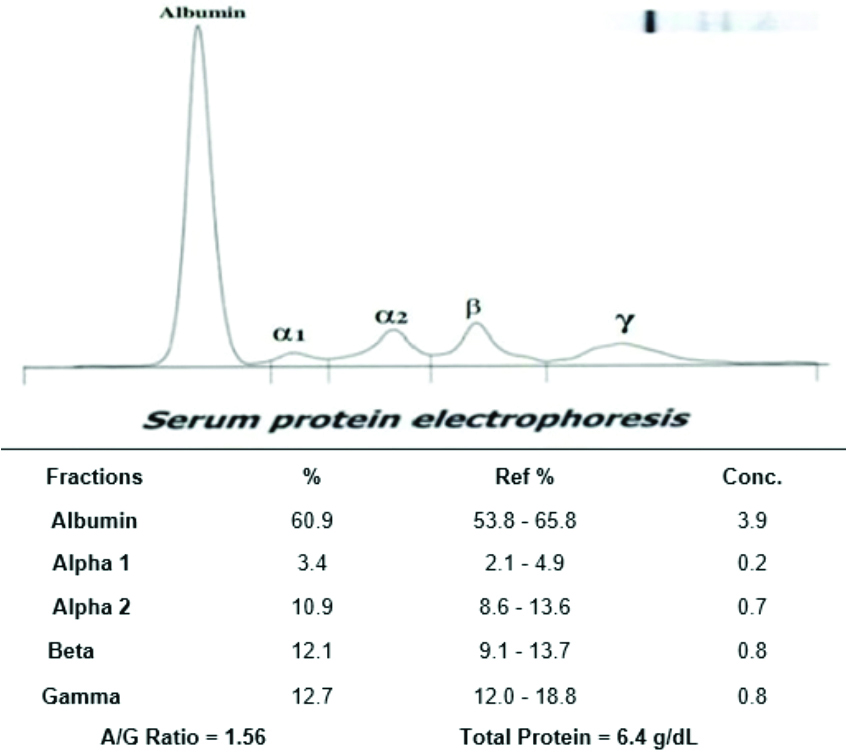
The serum protein electrophoresis analysis in the second trimester revealed an increased beta globulin level and a decrease in gamma globulin level; however, other fractions did not show significant alterations. The representative image of serum protein electrophoresis for pregnant women in the third trimester is shown in [Table/Fig-8], where all the serum protein fractions were found to be within normal ranges; however, a slight increase in gamma globulin levels was observed.
Representative image of serum protein electrophoresis (third trimester pregnant women).
Discussion
In the present study, a cohort of pregnant and non-pregnant women from different age groups, socioeconomic backgrounds, and dietary patterns was examined. As shown in [Table/Fig-1], most of the women (47%), both pregnant and non-pregnant, belong to the age group of 20-23 years. The mean age of pregnant women was 24.18±3.35 years, while for non-pregnant women, it was 25.14±3.72 years. Most of the women belong to middle and lower socioeconomic groups, where early marriages and conception are common. According to the National Family Health Survey-III, the occurrence of pregnancy at a young age is more prevalent among women with no education than among those with 12 or more years of education [28]. Besides the lack of education, the prevalence of religious and cultural beliefs also promotes marrying and conceiving at a young age. However, other studies show that advanced maternal age can lead to an increased frequency of adverse pregnancy outcomes [29,30]. Higher educational levels, career-oriented thinking, and shifts in cultural values are some reasons that contribute to delaying pregnancy [31].
From [Table/Fig-1], it has been observed that the majority of women (62%) who participated in this study consumed a non-vegetarian diet. This reflects the customary dietary patterns prevalent in the region. Despite the higher prevalence of a non-vegetarian diet, the protein content in the serum of non-pregnant women is on the lower end of the spectrum, indicating poor nutritional status and inadequate dietary intake. During pregnancy, these protein levels are found to be increased, as proper nutrition is provided to pregnant women. [Table/Fig-2] gives us insight into the BMI of the study subjects. Most women (67%) from both the pregnant and non-pregnant groups were classified as having a normal weight. Meanwhile, 17% were reported to be overweight, and 14% were categorised as underweight. Only 2% of the women were obese. When compared to socioeconomic factors, women from upper socioeconomic groups were typically classified as normal weight or overweight, whereas women from middle and lower socioeconomic statuses were more likely to be in the normal or underweight categories.
According to [Table/Fig-3], the mean total serum protein concentration in non-pregnant women was 6.36±0.40 g/dL, while in pregnant women, it was reported to be 8.01±0.40 g/dL, 8.00±0.42 g/dL, and 6.36±0.43 g/dL in the First (T1), Second (T2), and Third (T3) trimesters, respectively. The decline in total serum protein levels was consistent with the data reported by Smith EK et al., and MacGillivray I and Tovey JE [32,33]. A significant decrease in total protein levels was observed in the third trimester. This can be attributed to the extensive maternal-to-foetal transfer of nutrients during this period, owing to the higher rates of foetal growth [34]. The lower values of total serum protein levels in non-pregnant women indicate the poor nutritional status of women in the nearby region. A similar finding was reported by Alemnji G et al., [35]. The decreasing values of total proteins were more pronounced in women from middle and lower socioeconomic backgrounds, for both pregnant and non-pregnant subjects. Similar findings were also reported by Gómez-Cantarino S et al., [36]. A few studies have reported changes in total serum protein, typically observed during dehydration or fluid overload, with insignificant changes in the albumin-to-globulin (A:G) ratio [37,38]. Lund CJ and Donovan JC, have also reported that plasma volume steadily increases during pregnancy, from the sixth to the thirty-sixth week, by about 50% [39]. Thus, when interpreting serum concentrations of protein during pregnancy, factors that alter plasma volumes and cause haemodilution should be considered [40,41]. The decline in total protein levels may be associated with hydremia during pregnancy, as stated by Brown T in their study [18].
The mean concentration of serum albumin levels was found to be 3.90±0.30 g/dL for non-pregnant women, while it was 4.24±0.38 g/dL, 4.58±0.34 g/dL, and 3.87±0.36 g/dL for pregnant women in the first, second, and third trimesters, respectively. The level of maternal serum albumin was found to decrease significantly with advancing gestational age. A certain degree of decline in serum albumin levels during the progression of pregnancy is considered normal [41,42]. The decrease in the third trimester is particularly significant. This trend is similar to previous studies [34,43]. Low serum albumin values in the third trimester have often been linked to an increased risk of infant and maternal mortality and morbidity, as reported by O’Connell TX et al., and Sufrin S et al., [44,45]. The decline in serum albumin was notably significant among women from lower socioeconomic categories. This finding is consistent with studies carried out by Caso G et al., and Butte NF et al., [46,47]. The total globulin level in non-pregnant women was 2.46±0.28 g/dL, while the values reported for pregnant women in the first (T1), second (T2), and third (T3) trimesters were 3.86±0.22 g/dL, 3.42±0.20 g/dL, and 2.49±0.24 g/dL, respectively. The elevated globulin levels in pregnant women compared to non-pregnant women were significantly noted. This increase can be attributed to a compensation for the fall in serum albumin levels with advancing gestational age. However, Knopp RH et al., reported that there was no significant change in globulin levels due to pregnancy [48]. Similarly, Xydas NP et al., found no significant difference in maternal serum protein levels due to advancing gestational age [49]. According to [Table/Fig-4], the alpha-1 globulin level was found to be 2.8 gm% for non-pregnant women, and 4.8 gm%, 4.2 gm%, and 3.4 gm% for pregnant women in T1, T2, and T3, respectively. In this study, pregnant women exhibited higher levels of alpha-1 globulin in their serum than non-pregnant women, which may be due to the involvement of pregnancy-associated proteins. The alpha-2 globulin fractions were reported to be 10.8 gm% for non-pregnant women, while they were 16.7 gm%, 9.0 gm%, and 10.9 gm% for pregnant women in T1, T2, and T3, respectively. These findings do not align with previous studies conducted by Brown T [18] and MacGillivray I and Tovey JE, which reported a significant and steady rise in alpha-1 and alpha-2 globulin levels throughout pregnancy [33]. The beta globulin levels were reported as 11.1 gm% for non-pregnant women, 8.5 gm% for T1, 18.6 gm% for T2, and 12.1 gm% for T3. A similar increase in beta globulin levels has been reported by Brown T, Kulkarni BS et al., and Coryell et al., [18,19,50]. The gamma globulin level was found to be 13.8 gm% for non-pregnant women, and 17.6 gm%, 10.9 gm%, and 12.7 gm% for T1, T2, and T3, respectively. Brown T and Coryell Mn et al., also reported a similar decline in gamma globulin levels [18,50]. As corroborated by Menon MK et al., higher levels of gamma globulins may suggest a probable chronic infection during childhood or adolescence [51]. It was observed that the mean values of total proteins, serum albumin, and globulins were higher for women belonging to upper socioeconomic groups compared to those from middle and lower socioeconomic groups. This data aligns with previous studies conducted by Gómez-Cantarino S et al., [36]. There has been no study on changes in maternal serum protein levels during pregnancy in our region for a considerable time. Therefore, the observations from this study suggest novel laboratory findings and may encourage further research into maternal health during pregnancy.
Limitation(s)
This study had a smaller sample size, which may not represent the entire population of India or, more specifically, our region as a whole. Regional variations could affect the data elsewhere.
Conclusion(s)
In conclusion, socio-economically, women from middle and lower socioeconomic groups were in poorer condition. This indicates an overall low protein level in both pregnant and non-pregnant women from the Central India region. A significant difference was found among the groups for serum total protein, serum albumin, and serum globulin levels; however, the serum globulin levels showed a slight increase, indicating compensation for the decrease in albumin levels. This study also demonstrated that globulin fractions did not show any distinct pattern during pregnancy; however, the alterations in globulin fractions according to the trimester highlight the importance of pregnancy-associated proteins. Further large-scale studies are needed to analyse and address these findings.
BMI: Body mass index; SBP: Systolic blood pressure; DBP: Diastolic blood pressure; Data is presented as mean±SD percentage (%) and number of individuals (n), ANOVA (Analysis of Variance) test, Student t-test and Chi-square test are applied for analysis; p<0.05 is considered as significance level
BMI: Body mass index; Number (n); Percentage (%)
Data is presented as mean±SD, ANOVA test is applied for analysis of groups; p<0.05 is considered as significance level
Data is presented as mean, Percentage (%) and Number of individuals (n)