Hypotension after a subarachnoid block is a common occurrence due to sympathetic blockade. Sympathetic blockade causes vasodilation, which consequently decreases the preload of the heart, leading to a reduction in cardiac output. Early detection of hypotension induced by sympathetic blockade and prompt treatment are the primary responsibilities of the anaesthesiologist. It is desirable to find ways to predict the occurrence of hypotension in the preoperative period so that preventive measures can be implemented to decrease the incidence and severity of hypotension following a subarachnoid block [1].
Perfusion Index (PI) is directly proportional to vasodilation and serves as a non invasive, simple, and safe monitoring tool [2]. Although Non Invasive Blood Pressure (NIBP) measurement is routinely used in patients undergoing surgery, it is intermittent and may fail to identify hypotension in real-time. PI assesses the pulsatile strength of arterial flow at the monitoring site and is calculated using a pulse oximeter, which expresses the pulsatile signal as a percentage of the non pulsatile signals; both signals are derived from the amount of infrared light absorbed [3]. With the improved sensitivity of pulse oximeters, the reliability of PI has also improved. Clinicians can explore various ways to utilise PI in patient care. The accuracy of optimal pulse oximetry depends on the selection of a monitoring site, such as the fingertip, hand, toe, foot, forehead, or ear, which should be characterised by good perfusion with oxygenated blood. With the help of PI, instant and continuous feedback regarding the perfusion status of the selected monitoring site can be obtained [3].
In the neonatal care unit, PI serves as an accurate and objective measure of critical illness. PI measurement can also be used to assess peripheral perfusion and circulatory status using near-infrared spectroscopy [4,5]. The monitoring of PI warrants further exploration, such as predicting the success of reimplanted body parts, estimating volume status in trauma patients, and restoring peripheral perfusion after cardiopulmonary bypass [5].
Although a few studies in the literature have addressed the association between PI and hypotension following sympathectomy in caesarean sections, the results are contradictory [1,6].
Authors tested the hypothesis that an above-normal PI value in the preoperative period can accurately predict the occurrence and estimate the degree of hypotension during caesarean delivery under subarachnoid block. Thus, the present study aimed to evaluate and validate PI as a predictor of hypotension following subarachnoid block in patients undergoing LSCS and to assess the usefulness of perioperative pulse oximetry-derived PI as a monitoring tool for the degree of sympathetic blockade following subarachnoid block in caesarean delivery.
Materials and Methods
A prospective hospital-based observational study was conducted in the Department of Anaesthesiology at BJMC Ahmedabad, Gujarat, India, over a period from March 2020 to February 2021. A pilot study was performed on 15 patients to verify the expected proportion of hypotension incidence in both groups: Group A (PI <3.5) and Group B (PI >3.5). For the main study, a total of 60 cases of LSCS were included, with 30 in each group. The baseline PI cut-off of 3.5 was suggested by Toyama S et al., Total 30 eligible cases with a PI value <3.5 and thirty eligible cases with a PI value >3.5 were included in the study after receiving approval from the Institutional Ethics Committee (57/2020), and written informed consent was obtained from the patients [6].
Inclusion criteria: We included 60 ASA II pregnant patients undergoing elective caesarean delivery under regional anaesthesia.
Exclusion criteria: Exclusion criteria included patient refusal, failed spinal anaesthesia, emergency caesarean sections, cerebrovascular or cardiovascular co-morbidities, preeclampsia, eclampsia, placenta previa, any contraindication to regional anaesthesia, and patients with a BMI greater than 40 kg/m2.
Study Procedure
A preprocedural anaesthetic evaluation of the patients, including history, general examination, and systemic examination with all required investigations (complete blood count, coagulation profile, renal function tests, and liver function tests), was conducted before the surgery. We chose a cut-off value of baseline PI at 3.5 for predicting hypotension following a subarachnoid block, based on a study conducted by George J et al., and Toyama S et al., who performed regression analysis and Receiver Operating Characteristic (ROC) analysis. They concluded that a baseline PI cut-off point of 3.5 could be used to identify parturients at risk for hypotension [1,6].
Patients were divided into two groups based on their baseline PI value: Group A with PI <3.5 and Group B with PI >3.5. Baseline PI was measured using a pulse co-oximeter, with the fingertip as the standard monitoring site for pulse oximetry. Haemodynamic parameters, including Heart Rate (HR), Non Invasive Blood Pressure (NIBP), SpO2, and PI, were recorded in the supine position by an anaesthesiologist who was not involved in the further intraoperative monitoring of the patient.
In the preoperative room, each parturient was preloaded with 500 mL of Ringer’s lactate, and aspiration prophylaxis was administered. A subarachnoid block was performed in the left lateral position with a wedge under the right buttock or a left lateral tilt of 15-20° to prevent supine hypotension syndrome. A 25 G Quincke needle was used to perform the subarachnoid block according to the standard protocol, administering 2 mL of 0.5% hyperbaric bupivacaine at the L3-L4 or L2-L3 interspace in all patients. The block height achieved was at the T6 dermatomal level in all parturients.
Various parameters, including heart rate, MAP, and PI, were recorded initially at 1, 5, and 10 minutes, and then every five minutes until the completion of the LSCS. Hypotension was defined as a decrease in mean arterial pressure greater than 20% occurred in 60 patients. Hypotension was treated with intravenous fluids and boluses of 6 mg mephentermine intravenously as required. The parturients were monitored until the completion of the LSCS.
Statistical Analysis
All statistical analyses of the data were conducted using the statistical programming software SPSS (Statistical Package for the Social Sciences) version 20.0.0 (SPSS Inc., Chicago, Illinois, USA). Categorical data were presented as numbers (percentages) and compared among groups using the Chi-square test. Quantitative data were presented as means and standard deviations and compared using the Student’s t-test. A probability value of less than 0.05 was considered significant.
Results
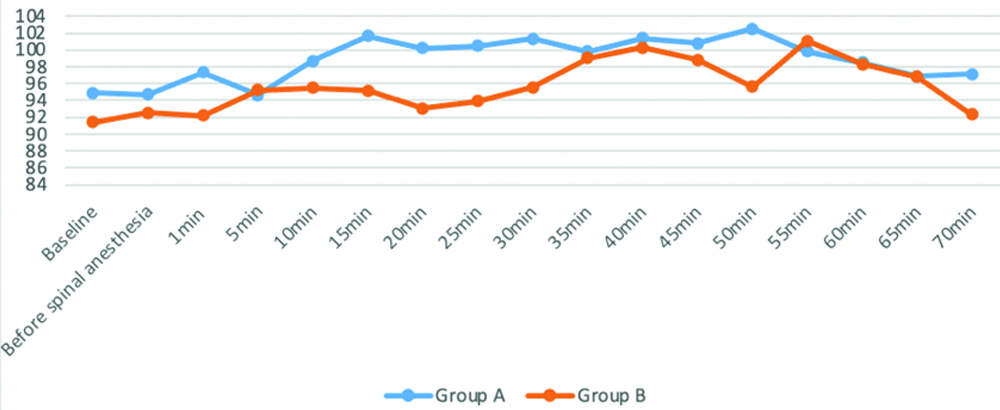
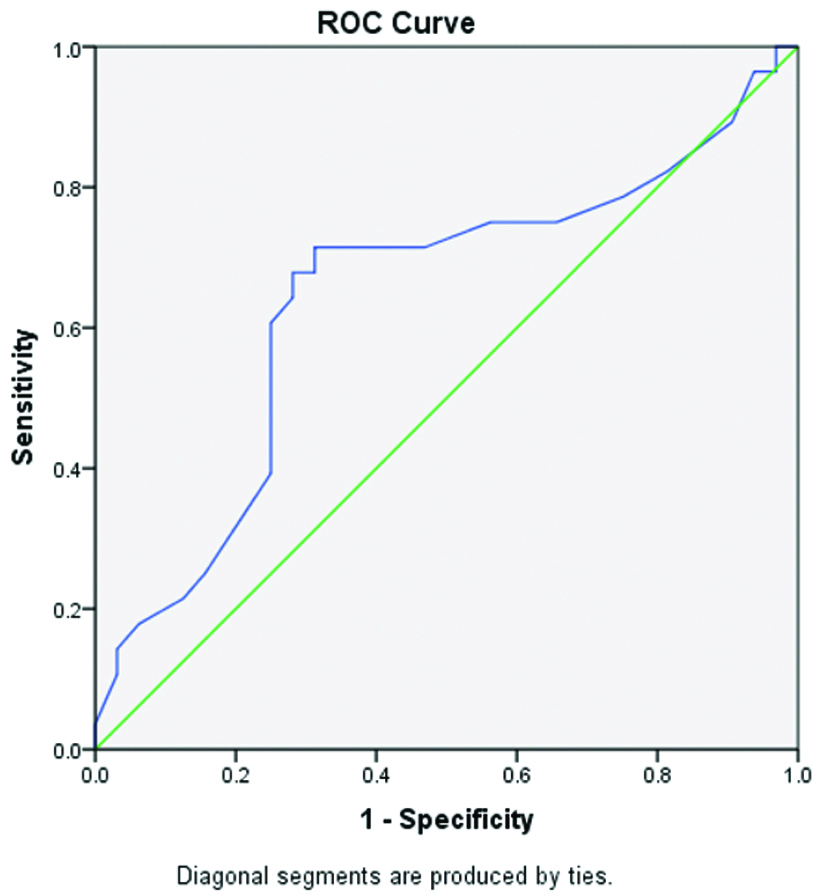
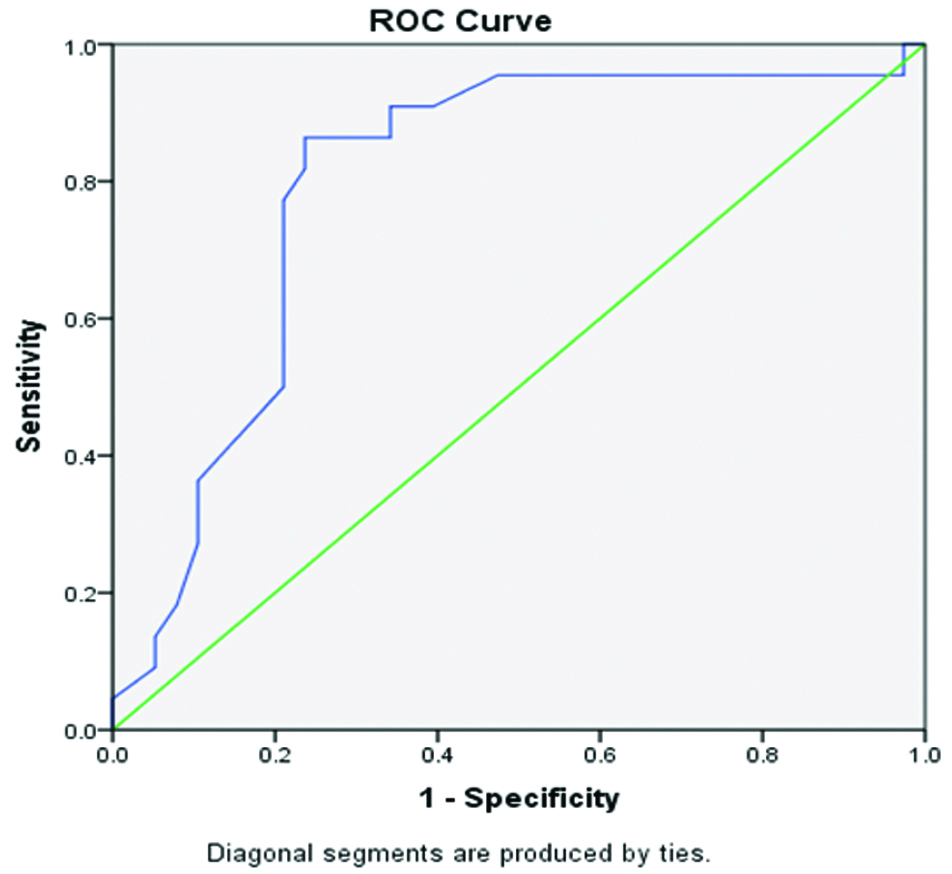
The demographic parameters were comparable between the two groups [Table/Fig-1]. Baseline values were similar for both groups. There was a statistically significant drop in Mean Arterial Pressure (MAP) in both Group A and Group B after induction, from one minute to 70 minutes (p <0.05) compared to the baseline values, as shown in [Table/Fig-2]. MAP values were significantly lower in Group B compared to Group A at five minutes (p=0.00001), 10 minutes (p=0.00002), and 15 minutes (p=0.0001). The decrease in MAP was well within normal limits (less than 20% from the baseline), with the maximum fall in MAP being 15.35% from the baseline at 50 minutes after induction in Group A. None of the patients in Group A had a MAP less than 65 mmHg at any time. The maximum fall in MAP was 24.04% at 10 minutes after the subarachnoid block in Group B. A total of 28 out of 30 patients in Group B had a MAP less than 65 mmHg at some point during the study period and required pharmacological intervention. The total fluid administered was higher in Group B to maintain blood pressure compared to Group A (p=0.000019). The number of episodes of decreased MAP that required intervention was higher in Group B compared to Group A, and this difference was statistically significant. The SpO2 was 99% throughout the procedure. In Group B, 28 out of 30 patients required mephenteramine (in 21 patients, 6 mg of mephenteramine was used, while in seven patients, 12 mg was used) versus none in Group A. The number of episodes of hypotension and the total dose of mephenteramine were significantly higher in Group B (Chi-square=52.500 with 2 degrees of freedom; p <0.001) than in Group A. In parturients with hypotension, 20 (71.43%) had a baseline Perfusion index ≥3.50, as shown in [Table/Fig-3]. The difference in the proportion of PI between the hypotension groups (A & B) was statistically significant (p=0.002). A baseline PI of 3.5 and above had a sensitivity of 71.43% in predicting hypotension. The specificity was 68.75%, the false positive rate was 31.25%, the false negative rate was 28.57%, the positive predictive value was 66.67%, the negative predictive value was 73.33%, and the total diagnostic accuracy was 70.0%, as shown in [Table/Fig-4]. Following the subarachnoid block, Group A showed an increase in HR from baseline, and this increase was statistically significant from 15 minutes to 60 minutes after induction (p <0.05). When comparing Group A and Group B, there was an increase in HR in both groups compared to baseline, but the increase was more pronounced in Group B compared to Group A (p <0.05), as shown in [Table/Fig-5]. The baseline PI had poor predictive validity in predicting hypotension at 10 minutes and 15 minutes, as indicated by the area under the curve of 0.641 (p=0.061) and 0.796 (p <0.001), as shown in [Table/Fig-6,7].
| Variables | Group A | Group B | p-value |
|---|
| Age (years) | 26.93±3.24 | 28.33±4.02 | 0.14 |
| Height (cm) | 155.56±4.29 | 155.17±4.31 | 0.88 |
| Weight (kg) | 62.70±5.87 | 60.36±5.00 | 0.10 |
| BMI (kg/m2) | 25.92±2.42 | 25.01±2.14 | 0.12 |
| Gestation (weeks) | 36.03±0.32 | 36.53±0.32 | 1.00 |
Values are presented as Mean±SD
Fluctuation in MAP following subarachnoid block.
| Time period | MAP (mmHg) |
|---|
| Group A | Group B | Intergroupp-value |
|---|
| Mean±SD | % change from baseline | Intragroupp-value | Mean±SD | % change from baseline | Intragroupp-value |
|---|
| Baseline | 97.70±06.70 | | | 97.20+06.40 | | | |
| After SAB |
| 1 min | 91.10±08.95 | -6.66 | 0.00005 | 84.80±10.20 | -12.64 | <0.00001 | 0.01 |
| 5 min | 90.90±06.40 | -6.85 | 0.00003 | 78.80±12.10 | -18.87 | <0.00001 | 0.00001 |
| 10 min | 85.90±08.80 | -11.99 | <0.00001 | 73.80±11.40 | -24.04 | <0.00001 | 0.00002 |
| 15 min | 87.50±07.90 | -10.07 | <0.00001 | 75.60±14.10 | -22.12 | <0.00001 | 0.0001 |
| 20 min | 87.60±09.50 | -10.03 | 0.00003 | 80.40±11.60 | -17.00 | <0.00001 | 0.011 |
| 25 min | 85.40±08.90 | -12.32 | <0.00001 | 80.80±10.30 | -16.48 | <0.00001 | 0.07 |
| 30 min | 83.70±10.20 | -14.13 | <0.00001 | 83.70±09.97 | -13.56 | <0.00001 | 0.97 |
| 35 min | 83.90±10.03 | -14.07 | <0.00001 | 80.50±10.30 | -16.76 | <0.00001 | 0.20 |
| 40 min | 83.20±10.10 | -14.84 | <0.00001 | 83.70±08.60 | -13.58 | <0.00001 | 0.82 |
| 45 min | 83.40±10.70 | -14.51 | <0.00001 | 82.70±07.93 | -14.58 | <0.00001 | 0.78 |
| 50 min | 82.50±09.90 | -15.35 | <0.00001 | 84.50±09.60 | -12.81 | <0.00001 | 0.44 |
| 55 min | 83.10±08.50 | -14.66 | <0.00001 | 84.50±06.30 | -12.77 | <0.00001 | 0.47 |
| 60 min | 82.80±08.40 | -15.07 | <0.00001 | 84.60±06.90 | -12.74 | <0.00001 | 0.36 |
| 65 min | 85.70±06.80 | -12.00 | <0.00001 | 85.20±09.20 | -12.22 | <0.00001 | 0.79 |
| 70 min | 89.50±06.40 | -8.10 | 0.00011 | 83.80±09.08 | -13.67 | <0.00001 | 0.006 |
Comparison of hypotension with PI (N=60).
| PI | Hypotension | Chi-square | p-value |
|---|
| Yes (≤78) (n=28) | No (>78) (n=32) |
|---|
| ≥3.50 | 20 (71.43%) | 10 (31.25%) | 9.643 | 0.002 |
| <3.50 | 8 (28.57%) | 22 (68.75%) |
Predictive validity of PI in predicting hypotension (N=60).
| Parameters | Values | 95% Confidence Interval (CI) |
|---|
| Lower bound | Upper bound |
|---|
| Sensitivity | 71.43% | 51.33% | 86.78% |
| Specificity | 68.75% | 49.99% | 83.88% |
| False positive rate | 31.25% | 16.12% | 50.01% |
| False negative rate | 28.57% | 13.22% | 48.67% |
| Positive predictive value | 66.67% | 47.19% | 82.71% |
| Negative predictive value | 73.33% | 54.11% | 87.72% |
| Diagnostic accuracy | 70.00% | 56.79% | 81.15% |
ROC analysis of predictive validity of baseline PI in predicting hypotension (at 10 minutes) (N=60).
ROC analysis of predictive validity of baseline PI in predicting hypotension (at 15 minutes) (N=60).
Discussion
Monitoring hypotension due to sympathetic blockade-induced vasodilation is vital for any surgery performed under subarachnoid block. This becomes even more important in caesarean sections, where the probability of a decrease in blood pressure is higher due to supine hypotension syndrome and anaesthetic agents. Episodes of hypotension can be particularly detrimental in pregnant patients due to the associated risks to both the mother and the foetus.
However, the most commonly used monitoring method in these patients is NIBP. NIBP is preferred over invasive blood pressure monitoring to avoid the complications associated with invasive techniques. The use of NIBP may result in late recognition of hypotensive events, potentially leading to delayed administration of corrective measures by caregivers.
In recent times, the perfusion index been established as an effective and reliable tool for rapidly predicting hypotension [6]. While PI can be used for continuous monitoring, it is free from the complications associated with invasive monitoring [7]. This was the reason we selected PI as a monitoring tool for detecting the likelihood of developing hypotension during caesarean sections, allowing for timely proactive measures to prevent adverse events [8].
Pulse oximetry evaluates the degree of pulsatile flow by automatically deriving the pulse wave amplitude. The built-in software of the pulse oximeter automatically displays the PI of the sampled arterial bed. Changes in pulse wave amplitude and PI, as determined by intraoperative pulse oximetry, represent a rapid and attractive monitoring tool for assessing changes in blood flow after sympathetic blockade. This monitoring method is inexpensive, readily available, portable, and requires no additional steps for data interpretation. Therefore, there is no doubt that PI is a valuable parameter for assessing the degree of vasodilation after sympatholysis and the subsequent fall in blood pressure [9,10].
In present study, patients with a baseline Perfusion Index (PI) greater than 3.5 experienced significantly more hypotensive episodes compared to those with a PI less than 3.5. These findings align with the results of studies conducted by Toyama S et al., Duggappa DR et al., Kumar U et al., Inamanamelluri R et al., and Lal J et al., [6,11-14]. In the present study, the sensitivity and specificity of a PI greater than 3.5 in predicting hypotensive episodes were found to be 71.43% and 68.75%, respectively. Toyama S et al., reported a sensitivity and specificity of 81% and 86%, respectively, for baseline PI with a cut-off value of 3.5 to predict hypotension [6]. Duggappa DR et al., conducted a study on 126 parturients divided into two groups based on baseline PI. Their findings showed that hypotension was higher in Group II (71.42%) compared to Group I (10.5%), with PI yielding a specificity of 89.29% and sensitivity of 69.84% in their study [11]. Kumar U et al., studied 60 parturients undergoing elective LSCS who received spinal anaesthesia with 2 mL of 0.5% bupivacaine heavy at the L3-L4 or L4-L5 interspace using a 25 G Quincke needle. Their findings correlated with a 34.5% incidence of hypotension among parturients and also demonstrated a sensitivity of 37% and specificity of 97% in patients with a baseline PI value of 3.5 [12]. Inamanamelluri R et al., reported a sensitivity of 80% and specificity of 75% with a baseline PI of 2.85 [13].
During the intraoperative period, heart rates were comparable in both groups, and the difference was statistically significant, consistent with the study conducted by Duggappa DR et al., [11]. In present study, MAP values were significantly lower in Group B compared to Group A at 5 minutes (p=0.00001), 10 minutes (p=0.00002), and 15 minutes (p=0.0001). Present observations align with those of George J et al., and Toyama S et al., Duggappa DR et al., who reported that the fall in mean arterial pressure was more pronounced in patients with higher PI index values [1,6,11].
In terms of fluid consumption, a higher fluid infusion was needed in Group B (p=0.000019) compared to Group A to correct hypotension. The number of episodes of hypotension and the total dose of Mephenteramine were significantly higher in Group B (Chi-square=52.500 with 2 degrees of freedom; p <0.001) than in Group A. Thus, parturients with a higher PI are expected to have lower peripheral vascular tone and are, therefore, more prone to develop hypotension following a subarachnoid block. The finding of higher consumption of intravenous fluids in the PI group with a PI greater than 3.5 is consistent with the study conducted by Toyama S et al., [6].
In present study, authors used inj. Mephenteramine and fluid boluses to treat hypotension, while they used only inj. Phenylephrine. The consumption of Mephenteramine was found to be higher in Group B with a high PI (>3.5). The requirement for vasopressors (ephedrine, phenylephrine, or Mephenteramine) was found to be greater in the group with a higher PI. The study showed a highly significant correlation between a baseline PI greater than 3.5 and the number of episodes of hypotension (r=0.416, p <0.001), the total dose of ephedrine used (r=0.567, p <0.001), and the total intravenous fluid used (r=0.249, p=-0.019) [11]. These findings are similar to those of studies conducted by Inamanamelluri R et al., Lal J et al., and Elfeil YE et al., [13-15]. Elfeil YE et al., compared PI before and after administering an ephedrine bolus, showing a significant decrease in the median of PI from 10 (5.5-15) to a median of PI after 7.5 (6-15.5) [13].
Hence, the results of the present study demonstrate that a higher baseline PI is associated with a greater decrease in arterial pressure, leading to a more frequent requirement for doses of Mephenteramine.
Limitation(s)
The study was a single-centred investigation with a limited sample size. The baseline PI value is susceptible to artifacts caused by patient movement, shivering, nail polish, low ambient temperature in the operating theater, anxious patients, and an unfamiliar operating room environment.
Conclusion(s)
There was a statistically significant difference in the decrease in mean arterial pressure, the total dose of mephentermine used intraoperatively, the incidence of hypotension, and the amount of fluid used in Group B compared to Group A. These parameters were greater in Group B than in Group A. The Pleth Variability or Perfusion Index (PI) can be used as a reliable monitoring tool for predicting hypotension in healthy parturients undergoing an elective caesarean section under subarachnoid block. Parturients with a baseline Perfusion Index greater than 3.5 were at a higher risk of developing hypotension following a subarachnoid block compared to those with a baseline Perfusion Index of less than 3.5. Therefore, appropriate preventive measures can be instituted preoperatively to prevent hypotension and improve outcomes in such patients.
Values are presented as Mean±SD