One of the predominant challenges in the field of physiotherapy across various paediatric populations, including those with conditions such as Cerebral Palsy (CP), traumatic brain injury, and developmental coordination difficulties, is a deficit in postural control. Identifying these deficits is crucial for developing effective treatment plans, as they significantly impact children’s daily activities and motor development [1,2].
Clinicians commonly rely on functional assessment tools to evaluate postural control due to their ease of use, affordability, and ability to simulate the functional deficits experienced by children in their daily lives. Postural control is defined as the capacity to manage the body’s position in space for postural orientation and within the base of support for stable posture [3]. This definition is widely accepted among researchers and clinicians. While there are different approaches, such as the task-oriented approach, the systems approach by Shumway-Cook and Woollacott [4], and the International Classification of Functioning, Disability and Health (ICF) framework, there is ongoing disagreement regarding the theoretical construct of postural control. The absence of a gold standard has led to a diverse range of functional paediatric postural control assessments [4]. Therefore, guidance is needed to select the most suitable functional postural control test based on quality, feasibility, and the underlying construct. It is crucial for the chosen test to accurately reflect the underlying construct to effectively identify postural control deficiencies, considering the involvement of multiple systems in postural control [5].
The specificity of tasks and the recognition that different tasks engage different systems allow for a better understanding of the underlying construct of the test by identifying postural control systems based on the type of task [6]. Tests that cover multiple systems are more likely to evaluate postural control as a holistic construct, enhancing the ability to uncover lacking underlying systems compared to tests that focus on a single system [7].
The quality of a test, including its reliability, validity, and responsiveness, is determined by its psychometric properties [8-10]. Feasibility, defined as the ease of applying the test within specified constraints such as population type, cost, time, or equipment requirements, is a crucial aspect that lacks formal measurement attributes [11]. Despite numerous examinations of the psychometric qualities of available functional paediatric postural control tests, such as the reach test, structural validity and responsiveness have not been adequately demonstrated. The objective of this systematic review was to investigate the psychometric properties of reach tests in children.
Materials and Methods
Selection criteria and eligibility process: The Population, Intervention, Comparison, Outcome (PICO) framework for healthy children aged between 5 and 17 years is provided in [Table/Fig-1].
Population Intervention Comparison Outcome (PICO) for healthy children aged between 5 and 17 years.
| Population | School going children Healthy children or children with any disease aged between 5 and 17 years
|
| Intervention | Balance tests Forward reach test Nintendo Wii Fit Multidirectional reach test Paediatric Reach Test (PRT)
|
| Comparator | Lower extremity strength Multicomponent agility test Activity specific balance confidence scale Maximum lateral reaching distance Anthropometric characteristics
|
| Outcomes | Psychometric properties of reach tests Reliability studies Validity studies
|
To be included in the review, each study’s title or abstract had to contain at least one term from the search strategy. The terms included in the search strategy were “multidirectional reach tests,” “balance measurement among children,” “balance abilities among children,” “PRTs,” and “tools used for balance measurement.” Five electronic databases were searched for the review: PubMed/MedLine, SCOPUS, OVID-SP, Cochrane Library, and Physiotherapy Evidence Database. Additionally, Google Scholar was explored to gather supplementary information, and manual searches were conducted, including reviewing the references in identified publications.
Inclusion criteria: The inclusion criteria were as follows: (1) peer-reviewed research articles focusing on determining psychometric properties; (2) published from inception to November 2023; (3) focusing on children aged 5 to 17 years; (4) including healthy children as well as children suffering from any disease or disorder; (5) determining at least one of the psychometric properties, such as reliability, validity, responsiveness, etc.; and (6) written in English.
Exclusion criteria: The exclusion criteria were as follows: (1) studies exclusively focused on adults or the elderly population; (2) any intervention study using reach tests only as one of the outcome measures; (3) standalone book chapters and articles that were not available for open access to readers.
Search strategy and source of information: The search strategy for the present review involved the amalgamation of key terms and their synonyms. These terms were selected based on the research questions and were identified during the initial literature review of studies focusing on reach tests in children. The search terms included “children,” “paediatric,” “child,” “adolescents,” and “school-going children,” in association with “reliability,” “validity,” “psychometric properties,” and “clinimetric properties.” Types of studies included were “observational studies,” “cross-sectional studies,” “reliability studies,” “review studies,” and “clinical trials.” The search was conducted using Boolean operators ‘AND,’ ‘OR,’ and ‘NOT.’ The combinations used for the search strategy are mentioned in [Table/Fig-2].
| Database | Search terms | Articles extracted |
|---|
| MEDLINE/PubMed | “children” and “reach test$” and (“psychometric” or “clinimetric”) | 357 |
| “children” and “reach test$” and (“reliability study” or “reliability”) and (“observational studies” or “review articles”) | 25 |
| “children” and “reach test$” and (“validation study” or “validity”) and (“observational studies” or “review articles”) | 29 |
| “children” and “reach test$” and (“psychometric” or “clinimetric” (“validation study” or “validity”) or (“reliability study” Or “reliability”) and (“observational studies” or “review articles”) and full text | 43 |
| “children” and “reach test$” and (“psychometric” or “clinimetric” (“validation study” or “validity”) or (“reliability study” Or “reliability”) and (“observational studies” or “review articles”) and free full text | 09 |
| SCOPUS | “Reach test” and “children” | 124 |
| “children” and “reach test$” and (“psychometric” or “clinimetric” (“validation study” or “validity”) or (“reliability study” Or “reliability”) and (“observational studies” or “review articles”) and free full text | 04 |
| OVID-SP | (“reach test*” and “psychometric properties*” and “child*”) | 441 |
| (“reach test*” and (“psychometric properties*” or “validity” or “reliability”) and “child*” And articles only And full text | 11 |
| Cochrane Library | “reach test” and “children” and (“psychometric properties*” or “validity” or “reliability”) | 16 |
| PEDro | “Reach test” and “children” and (“psychometric properties*” or “validity” or “reliability”) | 1 |
| Hand picked articles | Reach test, balance tests in children, Psychometric properties | 5 |
It is a search term strategy used for advanced search
Selection of studies: During the initial screening stage, studies were considered based on their titles and abstracts. In the second stage, approval was based on a full-text review. Articles discovered through manual searches were also included in the full-text screening stage. At each stage of the selection process, two independent reviewers screened and selected articles, resolving differences through discussion until consensus was reached. The agreement between the two reviewers before consensus discussions ranged from 94% at the abstract level to 92% at the full-text level.
Data Extraction
The selected studies that met the inclusion criteria provided descriptive psychometric information, which was gathered and categorised based on measurement terms, objectives, age groups, scope/population, and psychometric properties. In a contemporary context, “validity” can be defined as the assurance that an inference or decision drawn from a measurement is appropriate. Ongoing assessment of validity is paramount, and it should be viewed as a unified concept.
Various dimensions of empirical evidence for validity, including concurrent, predictive, construct, known group/discriminative, convergent, and face validity, were sought. Concurrent validity assesses how effectively a measure aligns with a well-established test, often considered a standardised “gold standard” test; this data is usually collected simultaneously with the target measurement. Predictive validity is often described in terms of sensitivity and specificity. Sensitivity pertains to the ability of a measurement to identify individuals with a particular condition (e.g., children with impaired balance), while specificity concerns the capability to accurately distinguish individuals without the condition (e.g., typically developing children). The recommended benchmarks for sensitivity are >80%, and for specificity, >90%.
Construct validity is linked to the overall perceived validity of the measurement and is characterised by the theoretical foundation for employing the measurement, which often involves factor analysis. Known group validity examines whether a test can differentiate between a group of individuals known to have balance impairment and a group of typically developing individuals. Discriminative validity confirms that measures or tests that should not be related are indeed unrelated. Convergent validity measures the extent to which two constructs that should theoretically be related are, in fact, related. Known group validity, discriminative validity, and convergent validity are all considered subcategories of construct validity.
To evaluate validity, a comparison of score-level attributes or measurement constructs between the original and adapted versions is conducted, assessing whether the scale operates similarly across diverse populations (measurement invariance and differential item functioning). Face validity relates to the degree to which one or more individuals subjectively perceive that a questionnaire effectively addresses the concept it purports to measure.
Reliability represents the overall consistency of a measure, indicating how stable it is when repeated under consistent conditions. Initially, test-retest reliability examines the relative stability of an assessment over time, assessing how consistent the scores from the measurement tool are from one test administration to the next. Second, inter-rater reliability assesses the level of agreement between two raters. Third, internal consistency evaluates how effectively the items in the questionnaire measure the same underlying construct. Measures exceeding 0.80 are regarded as excellent, with a minimum acceptable value of 0.70.
Assessment of methodological quality: The quality of the selected articles was assessed using the GRADE methodology.
Please note that the GRADE criteria must be modified for the present review, as they are typically used for evaluating interventions and diagnostic tools [12]. For instance, randomised trials with no significant limitations are categorised as providing high-quality evidence, while observational studies lacking significant strengths or substantial limitations are considered to provide low-quality evidence. To determine the appropriate psychometric qualities, the COSMIN criteria were utilised.
Results
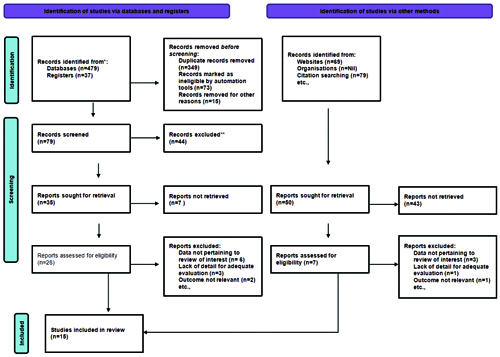
A total of 944 articles were identified from different databases using the search terms “child$” AND “reach test$” AND (“psychometric” OR “validity” OR “reliability”) NOT “adults,” applying Boolean operators AND, OR, and NOT. Out of the 944 studies, 357 articles were retrieved from MedLine/PubMed, 124 from SCOPUS, 441 from OVID-SP, 16 from the Cochrane Library, and one from PEDro. Additionally, five articles were hand-picked that were not included in any of these databases.
From these articles, 629 studies were found to be duplicates. Furthermore, 113 articles were excluded because they were experimental, standalone, book chapters, or conference proceedings. Studies were also excluded due to reports that could not be retrieved (n=94) and records marked as ineligible by automation tools (n=73). This left a total of 35 articles that were screened for eligibility.
Out of these 35 articles, 15 were finally included, as data in nine studies did not pertain to the review, four articles lacked adequate detail for evaluation, and outcomes were not relevant in five studies and two as they were literature review and systematic review studies [Table/Fig-3].
Prisma flow diagram.
*Consider, if feasible to do so, reporting the number of records identified from each database or register searched (rather than the total number across all databases/registers)
**If automation tools were used, indicate how many records were excluded by a human and how many were excluded by automation tools
Data Synthesis
The characteristics of the included studies were compiled in [Table/Fig-4], in which the study design, population, sample size, age, aim of the study, outcome measures, and main findings were categorised according to the respective authors and publication years. The psychometric properties of the outcome measures and the quality of the studies were represented in [Table/Fig-5]. An adapted version of the COSMIN checklist for the representation of psychometric properties is depicted in [Table/Fig-6].
Study characteristics and quality appraisal* [13-27].
| Article reference number | Author/Year | Study design | Population | Sample size (n) | Age (years) (mean±SD | Aim | Outcomes | Main findings |
|---|
| [26] | Erden A et al., 2021*GRADE- High quality | Observational study | Children with balance impairment | 34 | 11.68±3.53 years | To analyse reliability and validity of Turkish version of paediatric balance scale | Functional Reach Test (FRT), Gross Motor Function Classification System (GMFCS) | The Turkish version of the scale is a valid and reliable tool to evaluate children with balance impairments. |
| [13] | Castro-Piñero J et al., 2009GRADE- Moderate quality | Cross-sectional | Healthy boys and girls | 87 | Children (6-12 years old) adolescents (13-17 years old) | To examine the criterion-related validity of the Sit-and-Reach Test (SRT) and the Modified SRT (MSRT) for estimating hamstring flexibility in children and adolescents as well as to determine whether the MSRT is more valid than the SRT | Sit-and-reach and modified sit-and-reach, Hamstring flexibility | The main important finding observed in this study was that the (MSRT) is not a more valid method of measuring hamstring flexibility than the Sit-and-Reach Test (SRT). |
| [14] | De Moraes ACF et al., 2019GRADE- Low quality | Cross-sectional | Paediatric population (children and adolscent) aged 3 to 17 years | 200 | Children 6.7±2.1 years and adolescents 14.6±1.8 years | To determine the reliability and validity of the criteria and constructs of the International Fitness Scale (IFIS), Portuguese version, in Brazilian paediatric populations | International Fitness Scale, Portuguese version | The Portuguese version of the International Fitness Scale is a reliable and valid method for measuring physical fitness in paediatric populations. |
| [15] | Patterson P et al., 1996GRADE- Low quality | Cross-sectional | Healthy boys and girls | 84 | School going boys and girls in the age group of 11-15 years | To examine the validity and reliability of the back saver sit-and-teach test | Back saver sit-and reach test as a measure of hamstring and lower back flexibility | The study concluded that the back saver sit-and reach test was moderately related to hamstring flexibility, but its relationship to lower back flexibility was quite low and non significant in both boys and girls. |
| [24] | Randall KE et al., 2014GRADE- Low quality | Cross-sectional | Children with primary diagnosis of Cerebral palsy | 28 | 56±23.7 months | To evaluate the reliability of the Paediatric Reach Test (PRT) and the Early Clinical Assessment of Balance (ECAB) measures of postural stability of young children with CP and their construct validity | Postural Stability, Basic Motor Abilities | The study concluded that both (PRT and ECAB) tests demonstrated strong psychometric properties; however, on comparison, the ECAB demonstrated stronger validity and reliability than the PRT, with lower measurement error and the potential to be the better measure to detect change over time. |
| [16] | Muyor JM et al., 2014GRADE- High quality | Clinical trial | Healthy children and adolescents | 118 | Children (6-12 years old) and adolescents (13-18 years) | 1) To evaluate the hamstring muscle flexibility in children and adolescents;2) To examine the relative contribution of the spinal curvatures, pelvic tilt and hamstring flexibility on the Sit-and-Reach (SR) score; and 3) to determine the validity of the SRT through both active and passive hip flexion tests | Sit and-Reach (SR), Passive Straight Leg Raise (PSLR)and Active Straight Leg Raise (ASLR) | There are significant differences in the hamstring muscle flexibility regarding gender. Females showed significantly greatervalues in the score reached in the SR test, and angular values inthe PSLR test and the ASLR test. |
| [17] | Radtka S et al., 2017GRADE- Moderate quality | Cross-sectional | Typically developing children (8 females, 7 males) | 15 | 9.30±4.10 years | 1. To determine the test-retest reliability of trunk and pelvis joint angles, arm distance and the COP excursion for the seated FRT in typically developing children; and 2. to compare these same variables during the seated FRT with and without foot support in these children | Trunk and pelvis joint angle measurements, Maximum arm reach distance, Centre Of Pressure (COP) measurement, | Excellent reliability was found for maximum arm distance reached in all four directions in the seated FRT with and without foot support. Most trunk and pelvis joint angles and COP excursions during maximum reach in all four directions showed excellent to fair reliability. |
| [18] | Volkman KG et al., 2007GRADE- Low quality | Cross-sectional | Children with typical development (n=40 boys and n=40 girls) | 80 | 7-8 years(n=29)11-12 years(n=26)15-16 year (n=25) | To analyse test-retest reliability coefficients of FRT scores under four different conditions | Four methods of FRT (i.e., one-arm finger-to-finger, two-arm finger-to finger, one-arm toe-to-finger, and two-arm toe-to-finger) | In the present study using toe-to-finger FRT measurement methods and without changing the biomechanics of the test, reliability coefficients improved over previously reported values for children who are developing typically. |
| [27] | Rajendran V et al., 2012GRADE- Low quality | Cross-sectional | Children with medical diagnosis of hearing impairment with vestibular hypofunction | 65 | 8.26±2.16 | To evaluate the reliability of PRT in children with hearing impairment | Paediatric Reach Test (PRT) | This study indicates that PRT can reliably measure the limits of stability in children with hearing impairment. Using the PRT, balance deficits can be identified and a reliable baseline measures may be established for hearing impaired children before initiating interventions. |
| [19] | Amado-Pacheco JC et al., 2019GRADE- Moderate quality | Cross-sectional | Preschoolers in the third to fifth year of elementary school (90 healthy preschool children; 48 boys and 42 girls) | 90 | 4.0±0.82 | To assess the feasibility and reliability of physical fitness field tests used in the “Fuprecol kids” study among Colombian preschool children aged 3-5 years | Four components of the “Fuprecol kids” battery of tests:i) CRF component: the PREFIT 20 m shuttle run test (PREFIT 20 m-SRT); ii) musculoskeletal component: standing long jump and handgrip strength tests; iiii) speed-agility component: 4×10 m shuttle run test (4×10 m SRT); iv) flexibility component: sit and reach test | The main finding of the study shows that the “Fuprecol kids” battery of tests administered by physical education teachers is reliable for assessing the levels of physical fitness in preschoolers in a school environment in the Colombian setting. |
| [20] | Tucker J et al., 2015GRADE- High quality | Cross-sectional | Cohort 1 (n=25) “children who are non obese”; cohort 2 (n=25) “children who are obese | 50 | Cohort 1: 121.53±16.42; cohort 2: 126.64±16.29 (in months) | To determine intrarater and inter-rater reliability of common measures of lower extremity alignment among children with obesity | Craig test; Foot Posture Index; SRT; tibiofemoral angle | This study demonstrates that a series of lower extremity measurements and a measure of general flexibility can be completed with moderate reliability on children with obesity aged 8 to 12 years. |
| [21] | Ramírez-Vélez R et al., 2015GRADE- Moderate quality | Cross-sectional | Colombian youth (boys n=124 and girls n=105) aged 9 to 17.9 years old | 229 | 12.8±2.4 years | To examine the reliability of health-related physical fitness tests that were used in the Colombian health promotion “Fuprecol study” | Three components of the “Fuprecol kids” battery of tests: i) musculoskeletal component: standing broad jump, handgrip, vertical jump;ii) motor: sit and reach,4×10 m shuttle run (4×10 m SRT);iii) cardiorespiratory: 20-m shuttle run | The study’s main finding shows that the “Fuprecol study” of health-related fitness battery administered by physical education teachers is reliable for assessing the levels of physical fitness in youth in a school environment in the Colombian setting. |
| [23] | Katz-Leurer M et al., 2008GRADE- Low quality | Cross-sectional | 24 children with Traumatic Brain Injury (TBI) and 24 children with Typical Development (TD) matched | 24 | TBI (n=24) 8.7±3.5 and TD (n=24) 8.5±3.0 | To assess the within-session reliability of the Modified FRT (MFRT) and the Timed Up and Go (TUG) test in children with Traumatic Brain Injury (TBI) and children with Typical Development (TD). | MFRT; Timed Up and Go | The results of the study concluded that the MFRT has excellent within-session reliability and the TUG had good within-session reliability in both children with TBI and children with TD. |
| [22] | Dewar R et al., 2019GRADE- Low quality | Cross-sectional | Children (ambulant CP n=17, Typically Developing [TD] n=41) | 58 | CP: 11.7±2.7 and TD; 10.9±2.3 (years) | To evaluate the validity of the Kids-Balance Evaluation Systems Test (Kids-BESTest) clinical criteria for the Functional Reach Test (FRT) forward and lateral with laboratory measures of postural control in children with Cerebral Palsy (CP) | FRT forwards (FRTFORWARD), FRT lateral preferred (FRTLATERAL(P)), and FRT lateral nonpreferred (FRTLATERAL(NP)) | The FRTFORWARD demonstrated face, concurrent, and content validity. The FRTLATERAL(P/NP) demonstrated concurrent validity, but partial face and content validity. |
| [25] | Gan SM et al., 2008GRADE- Moderate quality | Cross-sectional | Children diagnosed with cerebral palsy | 30 | 102.5±24.3 months | To evaluate the psychometric properties of the BBS, FRT, and TUG for children with CP | Functional Reach Test (FRT), Berg Balance Scale (BBS), and Timed Up and Go (TUG) | The results indicated the strong reliability of the BBS, FRT, and TUG for children with CP. |
*Guyatt GH, Oxman AD, Vist GE, Kunz R, Falck-Ytter Y, Alonso-Coello P, Schünemann HJ. GRADE Working Group. GRADE: An emerging consensus on rating quality of evidence and strength of recommendations. BMJ. 2008;336(7650):924-26. Doi: 10.1136/bmj.39489.470347.AD. PMID: 18436948; PMCID: PMC2335261
Psychometric properties of outcome measures and quality as per adapted version of COSMIN checklist.
| Outcome measure | Studies analysing metric properties | Reference citation | Age group | Criterion validity | Construct validity | Test-retest reliability | Internal consistency | Intrarater reliability | Inter-rater reliability | Accuracy | Sensitivity | Specificity | Responsiveness |
|---|
| Functional Reach Test (FRT)COSMIN: + (Good quality) | Functional Reach Test (FRT) Erden A et al., 2020 | [26] | 4-18 years | NA | NA | r=0.75-0.98 | Cronbach’s α=0.70 | ICC=0.927 | ICC=0.915 | NA | NA | NA | NA |
| Functional Reach Test (FRT) Radtka S et al., 2017 | [17] | 5-15 years | NA | NA | ICCs=0.40-0.75 | NA | ICC=0.75 | NA | NA | NA | NA | SEM=1.58-9.38 (with foot support)SEM=1.50 to 9.79 (without foot support) |
| Functional Reach Test (FRT) Volkman KG et al., 2007 | [18] | 7-16 years | NA | NA | ICCs=0.83-0.98 | Cronbach’s α=0.80 | ICC=0.97-0.98 | ICC=0.83-0.93 | NA | NA | NA | NA |
| Functional Reach Test (FRT)Gan SM et al., 2008 | [25] | 5-11.10 years | ρ=0.84 | NA | ICC=0.89-0.98 | NA | NA | ICC=0.97-0.99 | p<0.01 | NA | NA | NA |
| Functional Reach Test (FRT) Dewar R et al., 2017 | [31] | 7-18 years | FRTLATERAL (both P/NP) (88%-100%); FRTFORWARD (86%-88%) | FRTFORWARD(ρ=0.68);FRTLATERAL (NP) (ρ=0.57) | NA | NA | NA | NA | p<0.001 (Frtforward);p=0.12/0.03 (Frtlateral (both P/NP) | NA | NA | NA |
| Paediatric Reach Test (PRT), COSMIN: - (Poor quality) | Paediatric Reach Test (PRT) Randall KE et al., 2014 | [24] | 2-7 years | R=0.42-0.77 | R=-0.88 | ICCs=0.875-0.972 | NA | ICCs=0.765-0.944 | ICC=0.747-0.940 | NA | NA | NA | Effect size=0.95 |
| Paediatric Reach Test (PRT) Rajendran V et al., 2012 | [27] | 6-11 years | NA | NA | NA | NA | ICCs=0.94-0.98 | ICC=0.90-0.97 | 95% | NA | NA | SEM=0.29-0.51 |
| Sit and Reach (SR)COSMIN:- (Good quality) | Sit and reach (SR)Patterson P et al., 1996 | [15] | 11-15 years | R=0.51-0.72 (hamstring flexibility); R=0.10.0.25 (lower back flexibility) | NA | NA | NA | r=0.96-0.99 | r=0.95-0.99 | p=0.01 | NA | NA | SE variation between left and right side is 5.50-5.68 |
| Sit and reach (SR)Tucker J et al., 2015 | [20] | 8-12 years | NA | NA | NA | NA | ICC=0.982-0.998 (non obese);ICC=0.978-0.997 (obese) | ICC=0.995-0.999 (non obese);ICC=0.999-1.0 (obese) | NA | NA | NA | NA |
| Sit and reach (SR)Ramírez-Vélez R et al., 2015 | [21] | 9-17.9 years | NA | NA | ICC=-0.0435-0.0228 | NA | NA | r=0.9 (boys);r=0.4 (girls) | p=0.056-0.064 | NA | NA | NA |
| Sit and reach (SR)Muyor JM et al., 2014 | [16] | 6-18 years | r=0.70-0.72 (in females);r=0.57-0.59 (in males) | NA | NA | NA | NA | NA | p=0.000 | NA | β=0.68 | SE=0.04 |
| Sit and reach (SR)Amado-Pacheco JC et al., 2019 | [19] | 3-5 years | NA | NA | NA | NA | ICCs=0.964 | NA | p=0.412 | NA | NA | Effect size=0.087 |
| Sit and reach (SR)Castro-Piñero Jet al., 2009 | [13] | 6-17 years | r=0.377 (in children); r=0.375 (adolescent) | NA | NA | NA | NA | NA | p=0.001 (in children); p=0.004 (adolescent) | NA | β=1.089 (in children); β=0.690 (adolescent) | SE=0.308 (in children); SE=0.220 (adolescent) |
| Modified sit-and-reachCOSMIN:- (Poor quality) | Modified sit-and-reachCastro-Piñero Jet al., 2009 | [13] | 6-17 years | r=0.337 (in children); r=0.259 (adolescent) | NA | NA | NA | NA | NA | p <0.001 (in children); p=0.027 (adolescent) | NA | β=1.296 (in children); β=0.588 (adolescent) | SE=0.345 (in children); SE=0.252 (adolescent) |
| Modified Functional Reach TestCOSMIN: - (Poor quality) | Modified functional reach testKatz-Leurer M et al., 2008 | [23] | 7-14 years | NA | NA | NA | NA | ICC=0.90-0.99 (TBI);0.74-0.99 (TD) | ICC=0.7-0.9 | p=0.01 | NA | NA | SEM=0.90-0.97 (TBI); 0.97-1.41 (TD) |
Psychometric properties of Tertiary outcome measures were not reported as they are not co-related with the objective of the study and there are limited literatures available for the same; r=Pearson’s correlation coefficient; ICC: Intraclass correlation coefficient; NA: Not available; SEM: Standard error mean; SRM: Standard response mean; SE: Standard error
Adapted version of COSMIN checklist.
| Outcome measure | Internal consistency | Construct validity | Criterion validity | Test-retest reliability | Intrarater reliability | Inter-rater reliability | Accuracy | Responsiveness | Total |
|---|
| Functional reach test | + | + | + | + | + | + | + | + | + |
| Modified functional reach test | ? | ? | ? | ? | + | + | + | + | ? |
| Seated functional reach test | ? | ? | - | + | + | - | - | + | - |
| Sit-and-Reach Test (SRT) | + | + | + | + | + | + | + | + | + |
| Back-and-Saver Sit and Reach Test (BS-SRT) | - | ? | + | - | + | + | + | + | + |
| Paediatric Reach Test (PRT) | ? | + | + | + | + | + | + | + | + |
‘+’ sign represents ‘good’ quality, ‘?’ indicates ‘unclear’ quality, and a ‘-’ sign denotes ‘poor’ quality of the outcome measure
In total, 15 studies using the ‘reach test’ as one of the outcome measures were systematically reviewed, consisting of 14 cross-sectional studies and one clinical trial. Among the 15 included articles, 11 recruited typically developing or healthy children [13-22], one included children with traumatic brain injury [23], two involved children with Cerebral Palsy (CP) [24,25], one focused on children with balance impairment [26], and another targeted children with hearing impairment [27].
The reach tests used in the studies included the Forward Reach Test (FRT) [14,26,23], modified FRT (mFRT) [23], seated FRT (sFRT) [26,18], Sit and Reach Test (SRT) [15,16,21], Back-and-Saver Sit and Reach Test (BS-SRT) [13,20], and the Progressive Reach Test (PRT) [24,27].
For the FRT, face validity was compared between Typically Developing (TD) children and children with CP, revealing a significant difference with a p-value <0.05 for both forward and lateral directions. The concurrent validity for the lateral direction of the FRT was found to be between 88-100%, while for the forward direction, it was observed to be 86-88%. Content validity was established by correlating the values with the centre of pressure, which showed moderate to high correlations, with coefficients of correlation observed between 0.5 and 0.7 for both lateral and forward directions [22]. Another study determined the test-retest reliability, internal consistency, intrarater reliability, and inter-rater reliability of the FRT among children with balance impairments, which were depicted as ranging from 0.75 to 0.98, 0.70 to 0.80, 0.92 to 0.98, and 0.83 to 0.93, respectively [18]. Criterion validity and accuracy were also predicted, with inter-rater and test-retest reliability yielding a correlation coefficient of 0.84, and a significance level of less than 0.01 for accuracy, indicating excellent reliability [25]. The intrarater, inter-rater, accuracy, and responsiveness of the mFRT were evaluated for TD children and children with Traumatic Brain Injury (TBI), showing excellent reliability (ICC=0.90-0.99) and a significance level of 0.01 for accuracy. The Standard Error of Measurement (SEM) for responsiveness ranged from 0.90 to 1.4 [23].
A study determined the test-retest reliability and intrarater reliability of the seated FRT among TD children, with the intraclass correlation coefficient indicating moderate to good reliability, with values of ICC=0.40-0.75. Responsiveness was also assessed in terms of Standard Error of Mean (SEM), showing values between 1.58 and 9.38, with and without foot support [17].
The quality of the SRT and BS-SRT was evaluated by six authors, who recruited children aged 3 to 17 years. Among these six articles, four explored the psychometric properties of the SRT, while two evaluated the properties of the BS-SRT. The SRT is typically used to assess the flexibility of the hamstring muscles and/or the physical fitness of individuals. Criterion validity of the SRT was found to be moderate to good for children aged 11-15 years, with an R value ranging from 0.51 to 0.72, while it was found to be fair to moderate among children aged 6-17 years (R=0.37) when compared to the modified SRT [15]. All modifications of the SRT exhibited excellent reliability with significant accuracy (p-value <0.05). Specificity for this test was also determined, showing beta values ranging from 0.58 to 1.2 [13]. Responsiveness was calculated using SEM and effect size, showing an SEM of 5.5 for hamstring flexibility on both the right and left-sides [15], and 0.22 to 0.34 when comparing flexibility between children and adolescents [13]. A very small standard error of 0.04 was observed when comparing flexibility between males and females, with a small effect size of 0.08 [19].
The psychometric properties of the PRT, evaluated for children between two years to 11 years of age, demonstrated ‘moderate to good’ criterion validity with R-values ranging from 0.42 to 0.77. The measure also exhibited excellent construct validity (R=0.88) and excellent test-retest, intrarater, and inter-rater reliability, with ICC values greater than 0.75. Additionally, responsiveness was assessed using effect size, which yielded a large effect size of 0.95 [24]. The standard error of measurement (SEM) for the same outcome measure was calculated to be between 0.29 and 0.51 [27].
Discussion
This review aims to investigate the psychometric attributes of reach tests used with children. To assess the psychometric qualities of the reach tests, eight different tests were identified. Overall, there was considerable variation among the studies in terms of the types of functional postural control tests (one system vs. multiple systems), the demographics, age ranges, and psychometric qualities examined in both healthy children and those with disabilities. The duration of the examinations, test procedures, and required equipment also varied significantly.
Test reliability was assessed at least once for each test, while measurement error, criterion validity, and construct validity were reported frequently, though not consistently [Table/Fig-5]. There remains a lack of research on responsiveness, sensitivity, specificity, internal consistency, accuracy, and test-retest reliability. Despite the fact that the FRT, PRT, SR, MSR, MFRT, PBS, and TUG were the most thoroughly studied, there is still limited evidence regarding their psychometric properties. Strong evidence were reached only for the FRT’s test-retest and inter-rater reliability of the FRT. Additional methodologically rigorous studies are likely to alter the estimates for all other psychometric properties.
Validity
It is postulated that postural control is a multisystemic construct [28], and its assessment instruments should address this. Test batteries were thought to somewhat align with this theoretical framework [Table/Fig-5]; nevertheless, the full multisystemic framework of postural control is covered by eight tests [28]. Understanding the underlying constructs of the tests, which establish the tests’ construct validity, is essential for identifying the postural control systems based on the type of task.
Construct validity was only examined for the FRT and PRT in these paediatric populations [29,30], and not for the Kids-BES Test [4,31]. The PBS does not evaluate reactive postural responses, whereas the FRT assesses the complete multisystemic framework [Table/Fig-5]. However, not all hypothetical systems were statistically converted into true dimensions [30]. The PBS appears to consist of two dimensions [30], and not every task within the PBS falls into the same dimensions [29]. Therefore, it is possible that other factors, such as the populations included, are at play, as these dimensions do not adequately capture the variety of systems required for postural control.
Previous exploratory work consistently demonstrated unidimensionality and task-specificity in studies involving healthy children [29,32,33] or heterogeneous pathological populations [29,34]. This was evidenced by correlations ≥0.70 for similar tasks (e.g., control of dynamics: TUG vs. SWOC [35], vs. FSST [36], and vs. FRT [25]) and small-sized correlations across different tasks (anticipatory, reactive, steady-state, and dynamic balance) [32,33]. While the various tasks appear to be highly related, depending on the task, a different dominant system is depicted by the small-sized significant correlations that represent criterion validity [Table/Fig-5]. The multisystemic nature of postural control [28] is supported, for example, by correlations in typically developing children between TUDS (control of dynamics) and FRT (orientation in space) (r=-0.32), or between BBW (control of dynamics) and SBST (anticipatory postural adjustments, APA) (r=-0.26) [37,38].
According to recent research, a child’s capacity to engage in postural control also depends on their developmental stage [32], which is supported by the availability of various age standards. Significant variations were observed, for instance, between the ages of 3, 4, 5, and 6 for BBW [37], and between 2.5 and 5 years for PBS [39], with significant six-month differences found. Therefore, postural regulation in healthy children is age- and task-specific.
On the other hand, in homogeneous diseased groups, the dimensionality examined through structural validity analysis varies [4,30,40]. The authors define the Functional Assessment of Balance (FAB) in children with Cerebral Palsy (CP) as having two dimensions: “static and quasi-dynamic balance function” and “stability in gait.” The One-Legged Stance (OLS) is included in the final dimension, but it appears to be more closely connected to the first than to the second [30]. It seems that the two dimensions are determined by the perceived difficulty or ease of the tasks, rather than the nature of the work for these children. Other preliminary research has demonstrated this shift in dimensionality: one dimension for the FAB with a modified item hierarchy in stroke patients [40,41], and four dimensions for the BESTest in stroke patients [40]. Therefore, item hierarchy and dimensionality are influenced by each specific pathology.
The results support the notion that the degree of the disease influences postural control performance. Children with mild motor deficits, such as hearing impairment [42], as well as those with severe motor deficits, such as traumatic brain injury with FSST [43], can be distinguished from healthy children. Additionally, children with varying functional levels, like those classified as Gross Motor Function Classification System (GMFCS) levels I-III (CP), also show differences, as indicated by PBS supporting the known-group validity of these tests [44,45] [Table/Fig-4]. In addition, functional postural control tests and GMFM total scores are more correlated in children with CP [25,44,46] than in more diverse groups, such as children with balance disorders [47]. This suggests that as movement disorders worsen, there is a stronger relationship between all motor components and postural control. Consequently, the severity of the underlying condition becomes more significant than the task-specificity observed in healthy individuals. Differences between the two groups should be noted.
Regarding Reliability, Measurement Errors, and Responsiveness
The data supporting the good reliability of all other functional postural control tests is (very) weak, with the exception of the FRT, PRT, SR, MFRT, and PBS. This low evidence is primarily due to a high-risk of bias, although imprecision caused by small sample sizes and inconsistent results-evidenced by either conflicting outcomes or very wide confidence intervals-also contributed. More consistent results were found for children with severe movement disorders like CP or traumatic brain injuries, while more inconsistent results were observed for younger children [48]. This inconsistency may be attributed to the typical day-to-day variability in performance resulting from their developmental stage. Not every form of reliability was examined for every test, which is crucial if measurements must be repeated, shared among healthcare providers, or used to assess the efficacy of interventions [49-51]. While SEM-based measurement errors, derived from test-retest reliability, can be useful in interpreting the results of physiotherapeutic interventions, a modified score can only be ascribed in relation to the degree of error, which means that the change lacks clinical significance (responsiveness). Therefore, if the responsiveness for a given test is not established, the amount of evidence for measurement errors diminishes, according to COSMIN criteria. Currently, only the FRT [52], PRT, SR, MSR, MFRT, and TUG [53,54] have available records, and responsiveness has not been thoroughly studied. Either the Minimal Clinically Important Difference (MCID) using the anchor-based approach [52,53,55] or the Standardised Response Mean (SRM) using the distribution method [52,54,55] have been used to evaluate how responsive a test is. The anchor-based method allows a clinician or researcher to quickly determine whether a change is clinically meaningful, while the distribution method (calculation of SRM) only yields statistically significant results and does not allow for the clinical interpretation of test score changes [56,57]. Additionally, because the distribution approach relies on the population’s standard deviations, the results are not adequately generalisable [57].
Feasibility
In relation to the test’s comprehensiveness, administration times varied, ranging from less than five minutes for some individual tests to 30 minutes for the Kids-BESTest [31,58]. Longer administration times should not be viewed as a limitation. The children were given explanations and demonstrations of each test beforehand and were often allowed a practice run to become comfortable with the procedures. In this way, motor function was evaluated rather than cognitive capacity [36]. Unless otherwise indicated, functional postural control assessments are conducted barefoot to simulate the subject’s ability to balance as naturally as possible [58].
Study Strength(s) and Limitation(s)
The comprehensive search query was used to methodically search three databases. Data extraction and bias risk assessment were conducted by two separate reviewers. By employing hand searching, the likelihood of overlooking potentially relevant articles was reduced. The degree of evidence for each test was determined using the COSMIN checklist, which is recommended for assessing techniques in psychometric studies. Consequently, it is true that a thorough interpretation of the findings from the included research is limited by the low-quality scores. Interpreting test findings is challenging due to the wide range of functional postural control tests available, which has led to various examinations of the different measurement characteristics of these tests.
Recommendations for future research: To draw firm conclusions about how well test scores reflect the dimensionality of the construct being measured, it is imperative that future research focuses on investigating the criterion validity of the most comprehensive test batteries using methodologically sound study designs. It is currently unclear whether the underlying dysfunctional neural pathways are connected to the multisystemic framework. Therefore, a comprehensive evaluation of criterion validity may help clarify if all systems are being addressed as theoretically recommended, ideally in conjunction with brain imaging methods. Both typically developing children and pathologically affected groups, ranging from mild to severe, should be included in this investigation, as they could all benefit from physiotherapeutic treatment planning related to postural control. Age disparities must also be considered. Additionally, emphasis should be placed on the responsiveness of structurally valid tests based on the anchor-based approach.
Conclusion(s)
The conclusions drawn from the review indicate that FRT is the most commonly used “reach test” as an outcome measure in the majority of studies, and it possesses excellent psychometric properties. This is followed by the Sit and Reach Test and the Plank Reach Test among children. Further trials are recommended to establish the psychometric properties of reach tests in multiple directions for a better analysis of balance among children.
It is a search term strategy used for advanced search