Hernia is one of the most common surgical problems that surgeons encounter in Outpatient Departments (OPD). It has been a persistent issue for humans since ancient times, with reports dating back to the era of Hammurabi in Babylon and in Egyptian papyrus [1]. A hernia is traditionally defined as an abnormal protrusion of viscera through the wall that contains it [2].
The Total Extraperitoneal (TEP) and Transabdominal Preperitoneal (TAPP) repair techniques involve nearly identical operative steps, with the primary difference being the surgical access to the hernia sacs [3]. During these approaches, particularly when a direct hernia sac is reduced, a “pseudosac” is often encountered. The pseudosac consists of the transversalis fascia that invaginates into the preperitoneal space during dissection [4,5]. This layer must be separated from the true hernia sac to allow the peritoneum to be returned to the peritoneal cavity [6]. Once the pseudosac is freed, it retracts back into the direct hernia defect. This retraction creates a cavity that can lead to the accumulation of fluids, resulting in seroma [7].
Seroma was defined as a collection of fluid or swelling at the surgical site or in the scrotum. Seroma is a pocket of serous fluid that can develop after surgery or as a result of trauma. It may form gradually over days or weeks and is typically not associated with bruising. On palpation, fluid movement can be detected. The presence of a seroma may increase the risk of infection and prolong the hospital stay. While seromas can resolve spontaneously, this depends on factors such as patient position, mobility and gravity [6].
Every effort should be made to minimise seroma formation during inguinal hernia repair, and various techniques should be explored to reduce its occurrence. Numerous methods have been proposed in the literature to prevent or manage seromas, but there is no clear consensus on which technique is ideal or superior [8]. Plication of the pseudosac is one such method that has been suggested to decrease seroma formation [8]. However, limited research has been conducted on this technique, particularly from the Indian subcontinent. The study hypothesis was fixation of pseudosac during TEP repair decreases the rate of postoperative seroma formation in direct inguinal hernia repair. Therefore, the current study was aimed to compare the role of pseudosac fixation versus non fixation during TEP for direct inguinal hernia repair, with the secondary objective of assessing any differences in postoperative pain experienced by both groups.
Materials and Methods
The present single-blinded randomised controlled trial was conducted in the Department of Surgery, ABVIMS Dr. RML Hospital, Delhi, India, from June 2019 to May 2021. Institutional Ethical Committee (IEC) clearance was obtained (IEC: TP (MD/MS) (100/2019)/IEC/ABVIMS/RMLH/764/19). The present study was registered in the Clinical Trial Registry-India (CTRI) under registration number CTRI/2021/05/033370. A total of 60 patients were enrolled in the current study. Written informed consent was obtained from all patients.
Inclusion criteria: All patients over 18 years of age with direct inguinal hernia were included in the study.
Exclusion criteria: Patients with indirect inguinal hernias, recurrent hernias and complicated hernias were excluded from the study [Table/Fig-1].
Consolidated Standards of Reporting Trials (CONSORT) 2010 flow diagram.
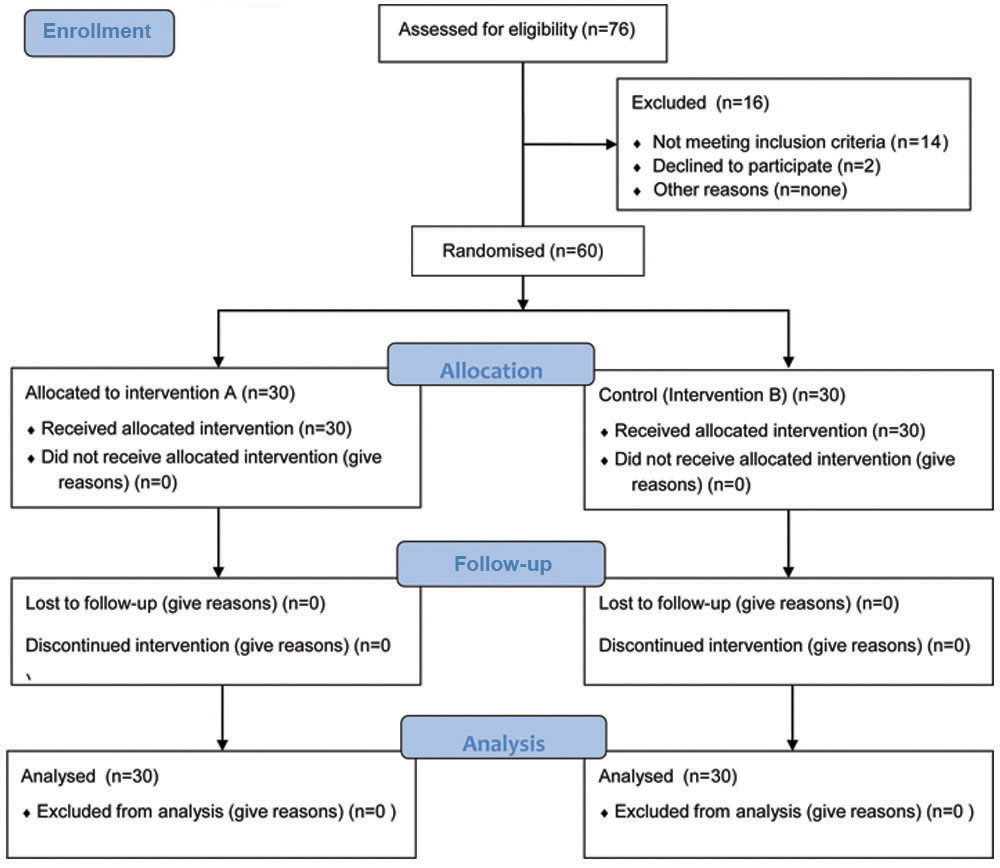
Sample size calculation: The sample size was calculated based on a previous study by Li J and Zhang W [9]. The authors performed fixation of the direct sac in 36 consecutive patients and found a seroma rate of 2.78%. Assuming a similar seroma rate and an estimated difference from the control group (without fixation) of 15% (effect size), with a power of 80% and confidence intervals of 95%, the sample size was calculated to be 60 patients. The formula used was n=Z2P(1-P)/d2, where n is the sample size, Z is the statistic corresponding to the level of confidence, P is the expected proportion, and d is the precision.
Study Procedure
Patients were randomised into two groups using a sealed opaque envelope method: Group A (fixation of the pseudosac, 30 patients) and Group B (non fixation of the pseudosac, 30 patients). Total of 60 sealed opaque envelopes were prepared at the start of the study, with 30 for each group, and were randomly segregated. Subsequently, one random envelope was used for each recruited patient, and the used envelope was discarded to prevent duplication.
After the preoperative work-up and obtaining written informed consent, all patients underwent TEP surgery performed by the same surgical team. All patients received a single dose of prophylactic antibiotics (injection amoxicillin+clavulanic acid 1.2 grams i.v.) at the time of induction. The same antibiotics were continued for three days postoperatively. Patients in group A underwent TEP with pseudosac fixation, while those in group B underwent TEP without pseudosac fixation. In group A, the pseudosac was fixed to Cooper’s ligament using titanium tackers. A large three-dimensional mesh (Bard®) fixed with titanium tackers was used in both groups. Monopolar electrocautery was utilised for dissection in all patients. Postoperatively, scrotal support was prescribed to all patients for atleast three months; however, no hernia compression belts were used.
Postoperative outcomes were assessed in terms of seroma formation, evaluated at the time of discharge, one week, one month and three months following surgery.
Seroma was diagnosed clinically through physical examination during follow-up visits and confirmed by ultrasound. Patients were also assessed for postoperative pain and early recurrences, if any (within three months). Pain was recorded using the Visual Analogue Scale (VAS), which observes a verbal score from 1 to 10. Mild pain was categorised as scores 1 to 3, moderate pain as scores 4 to 7 and severe pain as scores 7 to 10.
Statistical Analysis
The inferences were drawn using the statistical software package SPSS version 22.0. The tests employed were Fisher’s exact test and the t-test. A p-value of less than 0.05 was considered statistically significant.
Results
In this single-blinded randomised controlled trial, conducted over a period of two years from 2019 to 2021, 60 patients were recruited.
Among the 60 patients who were recruited in the present study, no significant differences were observed in age (years) (p-value=0.39), weight (kg) (p-value=0.465), or height (cm) (p-value=0.496) between group A and group B [Table/Fig-2].
Comparison of socio-demographic characteristics among two groups.
| Socio- demographic characteristics | Group A (n=30) | Group B (n=30) | Total | p-value |
|---|
| Age (years) |
| Mean±SD | 60.7±7.26 | 57.5±8.9 | 59.1±8.07 | 0.39* |
| Median (25th-75th percentile) | 63 (56.5-65.75) | 57 (52.75-65.75) | 60 (55-66.25) |
| Range | 45-68 | 43-68 | 43-68 |
| Weight (kg) |
| Mean±SD | 69.9±6.21 | 67.6±7.52 | 68.75±6.81 | 0.465* |
| Median (25th-75th percentile) | 69 (65.5-73.5) | 66.5 (64.25-70) | 68 (65-72.5) |
| Range | 60-80 | 56-82 | 56-82 |
| Height (cm) |
| Mean±SD | 152.4±10.13 | 149.1±11.07 | 150.75±10.47 | 0.496* |
| Median (25th-75th percentile) | 148.5 (147-160.25) | 147 (140.25-157) | 147.5 (141.75-160) |
| Range | 141-171 | 138-171 | 138-171 |
*Independent t-test
There was also no statistically significant difference in the distribution of co-morbidities (diabetes mellitus/hypertension) between the two groups [Table/Fig-3]. The distribution of the side of hernia was comparable between group A and group B (Left: 60% vs. 50%, respectively; Right: 40% vs. 50%, respectively) with a p-value of >0.5. The mean±SD of the size of the hernia (cm) in group A was 4.8±0.79, while in group B it was 5±0.82, showing no significant difference between them (p-value=0.584) [Table/Fig-4].
Comparison of co-morbidities among two groups.
| Co-morbidities | Group A (n=30)n (%) | Group B (n=30)n (%) | Totaln (%) | p-value |
|---|
| Diabetes |
| No | 27 (90%) | 24 (80%) | 51 (85%) | 0.962† |
| Yes | 3 (10%) | 6 (20%) | 9 (15%) |
| Hypertension |
| No | 27 (90%) | 27 (90%) | 54 (90%) | 1† |
| Yes | 3 (10%) | 3 (10%) | 6 (10%) |
| Other co-morbidities |
| None | 30 (100%) | 30 (100%) | 60 (100%) | - |
†Fisher’s exact test
Comparison of side and size of hernia among two groups.
| Side and size of hernia | Group A (n=30)n (%) | Group B (n=30)n (%) | Totaln (%) | p-value |
|---|
| Side of hernia, n (%) |
| Left | 18 (60) | 15 (50) | 33 (55) | 0.98† |
| Right | 12 (40) | 15 (50) | 27 (45) |
| Size of hernia (cm) |
| Mean±SD | 4.8±0.79 | 5±0.82 | 4.9±0.79 | 0.584* |
| Median (25th-75th percentile) | 5 (4-5) | 5 (4.25-5.75) | 5 (4-5.25) |
| Range | 4-6 | 4-6 | 4-6 |
*Independent t-test, †Fisher’s-exact test
I. Comparison of seroma formation between group A and group B: Seroma formation was not found in any of the patients from both groups on postoperative day one or one month after surgery. However, at three months after surgery, three patients from both groups had seroma formation. Three patients from group A and four from group B underwent ultrasonography in the postoperative period due to suspicion of seroma development; however, only three patients from group B had seroma confirmed. This data was found to be statistically insignificant with a p-value=1 [Table/Fig-5].
Comparison of postoperative seroma formation.
| Seroma formation | Group A (n=30)n (%) | Group A (n=30)n (%) | Totaln (%) | p-value |
|---|
| At day 1 | 0 | 0 | 0 | - |
| At 1 month | 0 | 0 | 0 | - |
| At 3 months | 3 (10) | 3 (10) | 6 (10) | 1* |
*Fisher’s exact test
II. Comparison of pain between group A and group B: Total of 21 patients from group A and 18 from group B did not experience any pain, while nine from group A and 12 from group B experienced mild pain (VAS score 1-3). This data was found to be statistically insignificant with a p-value=1 [Table/Fig-6].
Comparison of postoperative pain.
| Pain | Group A (n=30)n (%) | Group A (n=30)n (%) | Totaln (%) | p-value |
|---|
| No | 21 (70) | 18 (60) | 39 (65) | 0.95* |
| Mild (VAS score 1-3) | 9 (30) | 12 (40) | 21 (35) |
| Total | 30 (100) | 30 (100) | 60 (100) |
*Fisher’s exact test
III. Comparison of recurrence between group A and group B: No recurrence was found in any of the patients from both groups assessed at three months postsurgery.
Discussion
In this study, seroma formation was not found in any of the patients from both groups on postoperative day 1 or one month after surgery. However, at three months postsurgery, three patients from each group developed seromas. This data was found to be statistically insignificant, with a p-value=1. Contrasting incidence rates of seroma formation were reported by Cihan A et al., who found that on the first day, first week and first month, seroma formation occurred in 20 out of 30 patients, with only two patients continuing to have seromas by the end of the third month [10]. Similarly, Li J and Zhang W conducted a study on 25 patients and found that after closing the direct hernia sac with barbed sutures around the transversalis fascia, significant seroma developed in only one patient, which took one month to resolve [9]. In contrast, Usmani F et al., studied 241 patients, of whom 159 underwent direct hernia pseudosac fixation [11]. They found that closure of the direct hernia defect significantly reduced seroma formation (12.6% in the non fixation group vs. 6.4% in the fixation group, p-value 0.045). Abraham J conducted a study involving 56 patients and performed pseudosac fixation in 72 patients [8]. At the six-week follow-up, none of the patients developed seromas, which contrasts with the results obtained by Cihan A et al., [10]. The only difference between the two studies was the pseudosac fixation, which suggests that this factor could explain the difference in seroma formation rates. This hypothesis is further supported by a study conducted by Panse M et al., [12]. They studied 150 patients and found that none developed seromas at the one-month follow-up. Furthermore, Zhu Y et al., in their study of 60 patients, found that the incidence of seromas was lower in the pseudosac fixation group compared to the non fixation group at the three-month follow-up (p-value=0.002) [7].
In the present study, nine patients from group A and twelve patients from group B experienced mild pain. This data was found to be statistically insignificant, with a p-value=1. Zhu Y et al., found similar results in their study of 60 patients, where none of the patients experienced chronic pain at the three-month follow-up period, and the incidence of acute pain was statistically insignificant in both groups [7]. Similarly, Li J and Zhang W, in their study of 25 patients, also did not find any patients with chronic pain [9]. Supporting these findings, studies by Panse M et al., with 150 patients and Cihan A et al., with 30 patients did not report any cases of chronic groin pain [10,12].
A study by Köckerling F et al., showed that the use of tacks or glue to secure mesh during TAPP repair of primary unilateral inguinal hernia in male patients is associated with a higher incidence of seroma formation compared to techniques that do not involve mesh fixation [13]. Conversely, a study by Fang H et al., indicated that using drainage for an appropriate period is a feasible approach to decrease seroma incidence in patients with large inguinoscrotal hernias undergoing TAPP repair [14].
Additionally, the impact of other factors, such as the type of energy device used for tissue dissection and haemostasis, on seroma formation also needs to be ascertained. In a study by Liu JW et al., it was found that using monopolar cautery can significantly reduce the incidence of seroma formation [15].
The present study, therefore, highlights that pseudosac fixation seems to be a simple, feasible, and effective technique to reduce the incidence of seroma formation in direct inguinal hernia repair. However, the present study hypothesis has not been confirmed by statistical results.
Limitation(s)
Hernia recurrences can occur even after one year postsurgery. However, in the current study, recurrences were observed only within a three-month period. The present study focused exclusively on early recurrences. Future research should include longer observation periods for recurrence.
Conclusion(s)
Seroma formation after laparoscopic hernia repair is a known and troublesome complication. Pseudosac fixation does not affect the outcome in terms of seroma formation or postoperative pain reduction. Additionally, pseudosac fixation requires extra equipment, such as tacks, glue, endoloops, or the additional effort of intracorporeal suturing. These may be unnecessary, thus saving both time and resources. However, further randomised controlled trials with larger sample sizes need to be conducted to assess its efficacy, considering the multifactorial aetiology of seroma formation. Furthermore, studies comparing various adjunctive techniques should also be performed to evaluate the superiority of one technique over another.
*Independent t-test
†Fisher’s exact test
*Independent t-test, †Fisher’s-exact test
*Fisher’s exact test
*Fisher’s exact test