Spinal anaesthesia has been the most commonly used anaesthesia method for patients undergoing caesarean sections since 1977 [1]. It is preferred over GA as it avoids airway complications, depressant agents, and allows the patient to remain awake to experience the birth. Spinal anaesthesia is also simple, fast, reliable, and cost-effective [2]. However, a major drawback is hypotension, which occurs due to the local anaesthetic in the subarachnoid space [3], reduction in sympathetic tone, and aortocaval compression by the gravid uterus. Various methods are employed in day-to-day practice to combat hypotension, such as preloading with intravenous fluids, using vasopressors, applying lower leg compression, and placing a wedge under the uterus. Although the incidence of hypotension is managed using these methods, it remains a challenging side-effect during spinal anaesthesia [4].
Many trials have reported that patient position plays a significant role in the incidence of hypotension during or after spinal anaesthesia [5-7]. The sitting position is preferred for parturient females, as turning the patient after spinal anaesthesia may be difficult, especially for those with a high Body Mass Index (BMI). Therefore, a sitting position is favoured. When a patient lies down after spinal anaesthesia, aortocaval compression from the gravid uterus [8], epidural venous engorgement, and compression of the dural sac can push the local anaesthetic towards the head end, resulting in a higher level of thoracic dermatome blockade. Allowing the patient to sit for 30 seconds to one minute delays the onset of anaesthesia and decreases the chances of hypotension. Bupivacaine is a long-acting local anaesthetic agent belonging to the amino amide group [9]. It acts by binding to the intracellular part of the voltage-gated sodium channel, thus blocking sodium influx into the nerve cells, preventing depolarisation of the nerve fibers, and inhibiting the conduction of impulses.
Adding glucose (80 mg/mL) to isobaric or plain bupivacaine results in denser (hyperbaric) bupivacaine. The differing densities of the two forms will impact their diffusion and distribution following injection into the intrathecal region [10]. Hyperbaric bupivacaine is heavier than Cerebrospinal Fluid (CSF) and thus prevents the cephalad spread of the drug, limiting its effects to the lower part of the body. The hyperbaricity causes a faster motor blockade and a shorter duration of action compared to isobaric bupivacaine [11].
Present study aimed to determine whether sitting for 30 seconds or one minute, as opposed to immediately lying down after spinal anaesthesia, affects haemodynamics by preventing a drop in blood pressure. Many studies have focused on the immediate lying down position at 1, 2, 4, and 6 minutes; therefore, authors sought to compare the immediate lying down position with sitting for 30 seconds and one minute after spinal anaesthesia [1,12-14].
The present study aimed to compare the incidence of hypotension and the optimal duration of the sitting posture following a subarachnoid block.
Materials and Methods
A randomised double-blind clinical study was conducted at Dr. D. Y. Patil Medical College and Research Centre, Pune, Maharashtra, India, over a period of six months from December 2023 to May 2024. Institute Ethics Committee (IEC) clearance was obtained before the start of the study (IESC/FP/58/2023), and written informed consent was obtained from all patients. The trial was registered under the Clinical Trials Registry of India (CTRI) with the identifier CTRI/2023/11/060261.
Inclusion criteria: The study included patients who meet the following criteria: American Society of Anaesthesiologists (ASA) grade II classification, aged between 18 to 55 years, undergoing elective caesarean section, who are haemodynamically stable, with all routine investigations within normal limits, and who have provided informed consent were included in the study.
Exclusion criteria: Patients who meet any of the following criteria refusal to participate, presence of preeclampsia, chronic hypertension, diabetes, allergy to drugs used in the study, contraindications to neuraxial anaesthesia, blood pressure below 90 mmHg, heart rate below 50 beats per minute, requirement for general anaesthesia, history of addiction or drug abuse, presence of any obstetric emergency, and classification as ASA grade III or above were excluded from the study.
Sample size calculation: Considering the proportion of patients experiencing hypotension during surgery in the immediately sitting position (0.50) and after one minute (0.83) as cited in the article by Hajian P et al., [1], a sample size calculation was performed, with 80% power and a 5% significance level, the calculated sample size was 76, which included 40 patients in the immediately sitting group, 40 in the one-minute group, and an additional 40 for a third group. Thus, the minimum total sample size required was 120, calculated using the software WINPEPI 11.3.
Study Procedure
All patients underwent thorough preoperative evaluation and relevant laboratory investigations. They were kept fasting for eight hours before surgery. Upon arrival in the operating room, the NBM (nothing by mouth) status and consent were verified. Basic monitoring equipment {pulse oximeter, non invasive blood pressure monitor, and Electrocradiogram (ECG) monitor} was connected, and baseline vital parameters were recorded. One hour before entering the operating room, an 18-gauge intravenous line was placed, and each participant received 10 mg of intravenous metoclopramide and 50 mg of intravenous ranitidine. A 500 mL infusion of Ringer’s solution was administered prior to the induction of spinal anaesthesia. While the patient was seated, a 26-gauge Quincke Babcock needle was inserted at the L3-L4 interspace, parallel to the dural fibers, to induce spinal anaesthesia, and 2.2 cc of hyperbaric bupivacaine 0.5% was administered (this is the standard dose used in our institution). The study drug was prepared by an independent anaesthesiologist, while both the patient and the attending anaesthesiologist were unaware of the group allocation. The attending anaesthesiologist assessed the motor and sensory blockade.
The subjects were randomly allocated into three groups through computer-generated random allocation [Table/Fig-1].
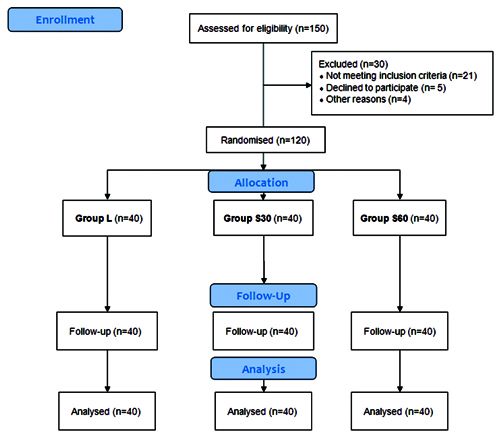
Group L (N=40): Lying down immediately after SAB with 2.2 cc of 0.5% Inj. Bupivacaine.
Group S30 (N=40): Sitting for 30 seconds after SAB with 2.2 cc of 0.5% Inj. Bupivacaine.
Group S60 (N=40): Sitting for one minute after SAB with 2.2 cc of 0.5% Inj. Bupivacaine.
The primary outcome was to assess the impact of sitting for 30 seconds, 60 seconds, and lying down immediately on hypotension, as well as the need for vasopressors, compared to lying down right away following spinal anaesthesia. All patients received supplemental oxygen via face masks. Blood pressure measurements were taken one minute before the baseline, and then at 1,2,3, and 5 minutes following the administration of spinal anaesthesia. Measurements of SBP, DBP, HR, MAP, and Oxygen Saturation (SpO2) were also recorded.
During the first 30 minutes of the procedure, measurements were taken every five minutes, and subsequently every 10 minutes until the procedure was completed. The time taken for sensory blockade to reach the T6 level was noted. The need for vasopressors was recorded. The onset of sensory block was evaluated using a pinprick sensation method. To reduce bias, the attending anaesthesiologist was unaware of the study details. The attending anaesthesiologist administered the drug and assessed both motor and sensory blockade.
The secondary outcome was to compare the time taken to achieve the T6 level sensory blockade. The dull sensation from the pinprick was compared with the sensation on either arm, and this was recorded as the time of onset of sensory blockade. As soon as the patient reclined, the sensory block level (based on loss of sensation to pinprick) was measured every minute until the subject’s sensory level reached T6. Surgery was permitted at the measured moment, which was noted as the beginning of the total sensory block. Fifteen minutes after spinal anaesthesia was administered, a modified Bromage scale was recorded (3=no movement; 2=only able to flex the ankle and foot; 1=able to bend the knee; and 0=no paralysis and able to elevate the lifted leg).
The onset of motor blockade was defined as the time from the injection of the drug until the time of complete paralysis. The duration of motor block was measured as the interval between the successful block and the complete recovery of motor function in the legs. The duration of analgesia was recorded from the time of drug administration until the first dose of rescue analgesia was given.
A 5 mg Intravenous (i.v.) bolus of ephedrine or phenylephrine was used to treat hypotension SBP ≤90 mmHg or a drop of more than 20% from baseline). This dose was repeated as needed to achieve an SBP of ≥90 mmHg. Following delivery, 500 mL of Ringer’s solution containing 20 IU of oxytocin was infused. Throughout the procedure, a total of 30 mL/kg of Ringer’s solution was administered. If the parturient complained of pain at any point during the procedure after the delivery of the baby, a 50 μg i.v. dose of fentanyl was given. If the analgesia was insufficient (Visual Analogue Scale, or VAS score >4), the aforementioned dose was repeated, and the total rescue fentanyl dose was recorded. SBP was measured as soon as nausea or vomiting began. Treatment with 5 mg of i.v. ephedrine or i.v. phenylephrine was administered if the reading was less than 90 mmHg. If SBP remained below 90 mmHg, a 10 mg i.v. bolus of metoclopramide was given as treatment. The total amount of i.v. ephedrine administered and the length of the procedure (from the skin incision to the last skin suture) were also noted.
Statistical Analysis
The data analysis was conducted using the Statistical Package for Social Sciences (SPSS) Software, version 26.0. Appropriate tests of statistical significance, such as One-way ANOVA and the Chi-square test, were performed. Qualitative data was analysed using thematic analysis. A critical value of p<0.05 was considered significant.
Results
A total of 120 patients were enrolled and evaluated in three groups: group L, group S30, and group S60. The demographic and anaesthetic characteristics of the study groups are shown in [Table/Fig-2]. All three groups were comparable (p-value >0.05).
Demographic and anaesthetic characteristics of study groups.
| Variables (mean±SD) | Group L | Group S30 | Group S60 | p-value* |
|---|
| Age (years) | 29.3±4.9 | 28.9±3.7 | 31.1±5.1 | 0.08 |
| Weight (kg) | 84.3±8.7 | 86.4±6.6 | 86.9±8.5 | 0.307 |
| Height (cm) | 161.9±17.2 | 157.3±14.9 | 160.6±15.4 | 0.412 |
| Gestational age (weeks) | 38.1±2.3 | 38.7±3.4 | 38.01±2.3 | 0.469 |
| Surgery time (min) | 50.3±6.2 | 54.3±6.4 | 53.7±5.4 | 0.316 |
*One-way ANOVA
Significant changes in HR were observed across the study groups at 1, 2, 3, and 5 minutes following spinal anaesthesia. In comparison to groups S30 and S60, group L had a higher HR (p-value <0.05) [Table/Fig-3].
Comparison of Heart Rate (HR) at various intervals among study groups.
| Time | Group L | Group S30 | Group S60 | p-value* |
|---|
| Baseline | 89.2±5.1 | 87.63±4.2 | 89.7±4.3 | 0.110 |
| 1 min | 100.4±3.5 | 91.3±4.5 | 92.3±5.6 | <0.001 |
| 2 mins | 107.3±11.4 | 91.6±7.8 | 91.6±6.3 | <0.001 |
| 3 mins | 104.5±12.2 | 89.5±10.3 | 88.9±7.9 | <0.001 |
| 5 mins | 100.6±18.7 | 91.3±14.3 | 90.4±7.6 | 0.003 |
| 10 mins | 89.1±11.1 | 88.2±10.7 | 88.2±10.3 | 0.910 |
| 15 mins | 90.6±11.2 | 89.3±14.2 | 86.7±11.4 | 0.358 |
| 20 mins | 88.7±10.02 | 88.5±10.7 | 84.8±13.2 | 0.230 |
| 25 mins | 87.9±8.1 | 85.3±7.8 | 84.5±8.6 | 0.155 |
| 30 mins | 84.2±7.8 | 81.3±9.3 | 81.6±9.2 | 0.272 |
| 40 mins | 84.5±10.1 | 83.5±4.5 | 85.4±10.2 | 0.621 |
| 50 mins | 87.8±5.4 | 85.6±6.2 | 88.3±6.7 | 0.115 |
| 60 mins | 89.6±6.4 | 86.9±7.1 | 88.7±7.4 | 0.216 |
*One-way ANOVA
Following the introduction of spinal anaesthesia, all three groups experienced a reduction in SBP relative to their baseline measurements. At 2, 3, 5, 15, and 20 minutes, there was a significant difference in SBP between the groups (p-value <0.05) [Table/Fig-4].
Comparison of SBP at various intervals among study groups.
| Time | Group L | Group S30 | Group S60 | p-value* |
|---|
| Baseline | 129.5±6.2 | 131.3±5.9 | 128.9±6.1 | 0.188 |
| 1 min | 120.6±5.4 | 121.4±5.6 | 119.5±5.9 | 0.322 |
| 2 mins | 112.9±5.4 | 115.6±5.6 | 117.3±6.3 | 0.004 |
| 3 mins | 108.9±5.6 | 115.3±5.7 | 118.2±5.8 | <0.001 |
| 5 mins | 105.6±5.8 | 106.9±5.1 | 108.9±5.9 | 0.033 |
| 10 mins | 109.7±5.6 | 111.5±4.9 | 112.3±6.3 | 0.111 |
| 15 mins | 114.3±5.7 | 117.9±6.1 | 120.4±5.8 | <0.001 |
| 20 mins | 118.7±5.8 | 120.2±5.1 | 121.8±5.6 | 0.046 |
| 25 mins | 122.7±6.2 | 124.5±5.4 | 121.4±5.4 | 0.053 |
| 30 mins | 121.7±5.4 | 123.4±5.6 | 120.6±6.5 | 0.102 |
| 40 mins | 124.5±6.2 | 126.7±6.1 | 123.7±4.9 | 0.059 |
| 50 mins | 124.7±5.7 | 125.4±6.4 | 123.8±5.1 | 0.463 |
| 60 mins | 124.8±5.9 | 125.9±5.9 | 125.4±5.4 | 0.693 |
*One-way ANOVA
All three groups also saw a decrease in DBP following the introduction of spinal anaesthesia. At 3, 5, 10 and 15 minutes, there were statistically significant differences in DBP between the groups (p-value), as shown in [Table/Fig-5].
Comparison of DBP at various intervals among study groups.
| Time | Group L | Group S30 | Group S60 | p-value* |
|---|
| Baseline | 73.4±5.8 | 76.2±5.7 | 74.3±5.4 | 0.081 |
| 1 min | 72.6±4.3 | 72.8±5.3 | 71.6±4.3 | 0.469 |
| 2 mins | 68.4±7.1 | 70.9±2.4 | 70.5±6.2 | 0.106 |
| 3 mins | 54.5±6.3 | 65.7±4.5 | 68.9±5.3 | <0.001 |
| 5 mins | 56.7±5.2 | 60.3±3.8 | 60.5±6.2 | 0.002 |
| 10 mins | 54.7±5.4 | 62.5±2.7 | 58.9±4.9 | <0.001 |
| 15 mins | 58.7±6.2 | 61.8±4.8 | 56.7±5.2 | <0.001 |
| 20 mins | 61.5±6.6 | 62.7±4.9 | 59.9±4.7 | 0.076 |
| 25 mins | 67.4±6.2 | 69.3±7.9 | 65.6±6.3 | 0.058 |
| 30 mins | 68.4±5.2 | 69.4±5.1 | 67.8±6.8 | 0.456 |
| 40 mins | 68.6±4.3 | 70.3±5.8 | 68.8±5.7 | 0.298 |
| 50 mins | 70.3±5.1 | 72.3±6.1 | 70.5±5.2 | 0.204 |
| 60 mins | 72.3±4.3 | 72.2±5.2 | 72.9±4.3 | 0.765 |
*One-way ANOVA
MAP decreased in all three groups compared to baseline following the induction of spinal anaesthesia, with significant differences in MAP between the groups at 1, 2, 3, 5, 10, 15 and 20 minutes (p-value) [Table/Fig-6].
Comparison of MAP at various intervals among study groups.
| Time | Group L | Group S30 | Group S60 | p-value* |
|---|
| Baseline | 87.9±5.9 | 88.4±5.8 | 88.9±4.3 | 0.709 |
| 1 min | 71.2±6.03 | 87.2±5.4 | 86.7±5.7 | <0.001 |
| 2 mins | 63.6±4.9 | 86.3±4.8 | 87.6±5.1 | <0.001 |
| 3 mins | 63.7±5.7 | 82.3±5.1 | 83.4±6.7 | <0.001 |
| 5 mins | 66.9±3.9 | 76.6±5.7 | 72.1±4.6 | <0.001 |
| 10 mins | 67.8±4.9 | 71.3±4.1 | 63.4±5.4 | <0.001 |
| 15 mins | 70.9±3.9 | 77.6±3.6 | 65.8±5.7 | <0.001 |
| 20 mins | 77.8±4.6 | 78.4±4.8 | 74.5±7.3 | 0.006 |
| 25 mins | 77.3±3.4 | 77.5±4.3 | 75.3±5.3 | 0.051 |
| 30 mins | 76.4±4.8 | 78.8±5.9 | 76.9±6.2 | 0.140 |
| 40 mins | 78.3±5.5 | 80.1±7.1 | 77.8±6.5 | 0.244 |
| 50 mins | 79.3±5.3 | 80.3±5.4 | 80.4±6.1 | 0.626 |
| 60 mins | 80.2±4.8 | 80.6±5.6 | 80.9±5.3 | 0.836 |
*One-way ANOVA
Following the induction of spinal anaesthesia, peripheral oxygen saturation (SpO2) was comparable in all three groups at all time points (p-value >0.05) [Table/Fig-7].
Comparison of SpO2 at various intervals among study groups.
| Time | Group L | Group S30 | Group S60 | p-value* |
|---|
| Baseline | 98.7±0.8 | 98.9±0.7 | 98.8±0.9 | 0.542 |
| 1 mins | 98.5±0.9 | 98.7±0.8 | 98.6±0.9 | 0.621 |
| 2 mins | 98.4±1 | 98.6±0.9 | 98.5±1 | 0.587 |
| 3 mins | 98.3±1.1 | 98.6±0.9 | 98.5±1 | 0.378 |
| 5 mins | 98.3±1.1 | 98.6±0.9 | 98.5±1 | 0.378 |
| 10 mins | 98.4±1 | 98.7±0.8 | 98.6±1 | 0.415 |
| 15 mins | 98.5±0.9 | 98.8±0.7 | 98.7±0.8 | 0.329 |
| 20 mins | 98.6±0.8 | 98.8±0.7 | 98.7±0.8 | 0.476 |
| 25 mins | 98.7±0.8 | 98.9±0.7 | 98.8±0.7 | 0.533 |
| 30 mins | 98.7±0.8 | 98.9±0.7 | 98.8±0.7 | 0.533 |
| 40 mins | 98.8±0.7 | 98.9±0.7 | 98.8±0.7 | 0.792 |
| 50 mins | 98.8±0.7 | 98.9±0.7 | 98.8±0.7 | 0.792 |
| 60 mins | 98.8±0.7 | 98.9±0.7 | 98.8±0.7 | 0.792 |
*One-way ANOVA
No significant difference was found between groups S30 and S60; however, there was a significant difference between group L and both S30 and S60 [Table/Fig-8].
Tukey’s HSD test for HR, SBP, DBP, MAP at significant time points.
| Parameter | Comparison between groups | Mean difference±Standard deviation | p-value |
|---|
| Heart Rate (HR) | Group L vs Group S30 | 9.1±1.4 | <0.001 |
| Group L vs Group S60 | 8.1±1.5 | <0.001 |
| Group S30 vs Group S60 | 1.0±1.7 | 0.568 |
| Systolic Blood Pressure (SBP) | Group L vs Group S30 | -2.7±1.0 | 0.004 |
| Group L vs Group S60 | -4.6±1.1 | <0.001 |
| Group S30 vs Group S60 | -1.9±1.2 | 0.061 |
| Diastolic Blood Pressure (DBP) | Group L vs Group S30 | -13.2±2.0 | <0.001 |
| Group L vs Group S60 | -14.4±2.1 | <0.001 |
| Group S30 vs Group S60 | -1.2±2.3 | 0.604 |
| Mean Arterial Pressure (MAP) | Group L vs Group S30 | -16.0±2.1 | <0.001 |
| Group L vs Group S60 | -18.1±2.3 | <0.001 |
| Group S30 vs Group S60 | -2.1±2.5 | 0.732 |
Group S60 took longer than group S30 and group L to attain the T6 dermatome sensory level (surgical anaesthesia), and this difference was statistically significant (p-value=0.001). Motor block regression revealed statistically significant differences in the time to reach a Bromage score of 2 (in minutes) between all groups. Compared to group S60, groups L and S30 had longer times. Nausea, vomiting, and bradycardia were more prevalent in group L compared to the other groups (p-value <0.05) [Table/Fig-9].
Comparison of anaesthetic characteristics among study groups.
| Variables | Group L | Group S30 | Group S60 | p-value |
|---|
| Motor block (Modified Bromage score) | At 5 mins | 2.9±0.7 | 3.02±0.9 | 3.2±1.1 | 0.340* |
| At 10 mins | 3.1±0.4 | 3±0.1 | 2.9±0.8 | 0.232* |
| Time required to reach T6 sensory level, mins (Mean±SD) | 3.8±1.9 | 4.2±2.3 | 5.41±1.7 | 0.001* |
| Ephedrine requirements, mg (Mean±SD) | 12.98±6.7 | 9.5±6.3 | 11.2±7.8 | 0.087* |
| Rescue analgesia (regression of sensory block to level T12), mins (Mean±SD) | 110.6±21.7 | 107.7±18.9 | 117.9±19.2 | 0.067* |
| Motor block regression (time of Bromage score 2, mins) (Mean±SD) | 179.3±19.7 | 165.3±25.5 | 151.7±20.4 | <0.001* |
| Duration of analgesia (mins) | 110.6±21.7 | 107.7±18.9 | 117.9±19.2 | 0.067 |
| Hypotension, n (%) | Induction-20 mins | 35 (87.5) | 27 (67.5) | 31 (77.5) | 0.101# |
| 20 to 40 mins | 5 (12.5) | 9 (22.5) | 13 (32.5) |
| Complications, n (%) | Nausea and vomiting | 18 (45) | 10 (25) | 8 (20) | 0.035# |
| Bradycardia | 18 (45) | 10 (25) | 8 (20) | 0.035# |
| Pruritis | 6 (15) | 4 (10) | 4 (10) | 0.724# |
*One-way ANOVA #Chi-square test
Discussion
Hypotension frequently occurs following spinal anaesthesia, a common issue underscored by recent meta-analysis findings revealing the ineffectiveness of various interventions in completely mitigating this adverse event. These interventions include changes in patient positioning, administration of colloids, ephedrine, phenylephrine, and lower limb compression. Despite extensive studies, conflicting outcomes have emerged in investigations into the impact of patient positioning during or after spinal anaesthesia [12,15-17]. One of the most frequent side-effects of spinal anaesthesia in women undergoing caesarean sections is hypotension [18,19]. Numerous approaches to alleviating this issue have been studied in the past [20].
In present study, patients were seated for either 30 or 60 seconds before immediately transitioning to a lying down position. By positioning the patient’s body in an upper-lower plane while they sat for 30 or 60 seconds, authors were able to estimate the level of analgesia and the improvement in their haemodynamic stability [13,21,22]. This contrasts with patients who were placed in a supine position immediately following spinal anaesthesia. The current study demonstrated that women who sat for either 30 seconds or one minute had significantly decreased rates of hypotension in the first 20 minutes after spinal anaesthesia (prior to birth). Additionally, a significant difference in MAP was noted between patients who were placed supine right after the subarachnoid block and those who were maintained in a sitting position for 30 seconds. Similar outcomes were reported by Amer GFM et al., [23].
In present study, HR was higher in group L compared to the S30 and S60 groups at 1, 2, 3, and 5 minutes, with p-value <0.05. In the Amer GFM et al., study, HR was higher in patients who were placed in a lying down position immediately compared to those who remained seated for 2, 4, and 6 minutes [23]. Subjects who laid down right after spinal anaesthesia took a shorter time to reach the T6 sensory level (p-value <0.05), whereas the S60 and S30 groups required lower total doses of ephedrine (p-value >0.05).
According to Povey HM et al., in a study on the impact of sitting on the propagation of sensory block, analgesia levels increase several segments after the patient is placed in a supine position following a period of sitting [24]. Changes in position can modify the degree of nerve block in spinal anaesthesia, as reported by Bodily MN et al., [25]. Veering BT and Immink-Speet TT investigated the effects of a sitting position with 0.5% bupivacaine on elderly patients. They concluded that the highest level of block and haemodynamic stability varied significantly [21].
In the current study, patients who were placed supine immediately following a subarachnoid block experienced a faster onset of spinal anaesthesia than those who were held in a sitting position for 30 seconds, indicating a statistically significant difference. El-Hakeem EE et al., found that sitting up for five minutes, as opposed to lying down immediately, reduced the height of the sensory block, the amount of ephedrine and hydration needed, and the severity of certain side-effects such as nausea and vomiting [12].
According to Hajian P et al., a parturient may experience fewer episodes of hypotension and require less ephedrine if she remains seated for one to two minutes following spinal anaesthesia, as opposed to lying down immediately [1]. Similar studies by Kohler F et al., and Gori F et al., found that sitting upright for three and two minutes, respectively, did not affect the incidence of maternal hypotension or the amount of ephedrine required when compared to lying down immediately [26,27]. In the current study, the sitting groups experienced a lower incidence of hypotension than the immediately lying down group. This result was corroborated by a prior study by Hajian P et al., which discovered that sitting up for one or two minutes, as opposed to lying down immediately, reduced the frequency of hypotension [1]. Specifically, the frequency of hypotension was 92% in the group that immediately lay down, 66% in the group that sat for one minute, and 50% in the group that sat for two minutes. In the present study, group S30 had a lower frequency of hypotension (67.5%) and required less ephedrine compared to S60 (77.5%) and L (87.5%). The results of research by Agrawal N and Rowland S, concluded that keeping the patient seated for 30 seconds improves haemodynamic stability and helps to prevent high spinal anaesthesia, further support this conclusion [28]. The differences between prior trials and the current study may be attributed to the different baricities and dosages of bupivacaine used for spinal anaesthesia. These contradictory findings may also be explained by the use of isobaric bupivacaine in the Gori F et al., study, as opposed to hyperbaric bupivacaine in the current investigation, as well as the larger dosage of bupivacaine used. [27].
Limitation(s)
First, the exclusion criteria-such as limiting participants to ASA grade II and below and excluding obstetric emergencies-restrict the generalisability of the findings to these excluded populations. Secondly, the strict exclusion of patients with chronic hypertension, diabetes, or drug allergies might have eliminated individuals who could potentially benefit from or respond differently to the interventions under study, thereby limiting the broader applicability of the findings. Furthermore, the study was conducted at a single medical college and research centre, which may not fully represent the diversity of clinical settings and patient demographics encountered in different institutions or regions. Lastly, the study primarily focused on immediate haemodynamic changes and the onset of sensory block. Long-term outcomes, such as maternal and neonatal outcomes, postoperative pain management, and patient satisfaction, were not assessed, which could provide a more comprehensive understanding of the interventions’ impact.
Conclusion(s)
The study demonstrated that patient positioning significantly impacts the incidence of hypotension and the onset of sensory block following spinal anaesthesia for caesarean sections. The study concluded that allowing patients to sit for 30 to 60 seconds after spinal anaesthesia for caesarean sections reduces the incidence of hypotension and improves haemodynamic stability compared to the immediately lying down position. Additionally, the time to achieve a T6 sensory block was shorter in the immediately lying down position.
*One-way ANOVA
*One-way ANOVA
*One-way ANOVA
*One-way ANOVA
*One-way ANOVA
*One-way ANOVA
*One-way ANOVA #Chi-square test