Validity of Computed Tomography in Evaluation of Acute Ischaemic Stroke in Comparison to Magnetic Resonance Imaging: A Cross-sectional study
Tanmoy Dey1, Prabhat Debbarma2, Jaybrata Ray3, Pradip Bhowmik4
1 Senior Resident and Medical Officer, Department of Radiodiagnosis, Agartala Government Medical College, Agartala, Tripura, India.
2 Associate Professor, Department of Radiodiagnosis, Agartala Government Medical College, Agartala, Tripura, India.
3 Associate Professor, Department of Radiodiagnosis, Agartala Government Medical College, Agartala, Tripura, India.
4 Professor, Department of Medicine, Agartala Government Medical College, Agartala, Tripura, India.
NAME, ADDRESS, E-MAIL ID OF THE CORRESPONDING AUTHOR: Dr. Tanmoy Dey, PG Boys Hostel, Room 82, AGMC Complex, Kunjavan, Agartala-799006, Tripura, India.
E-mail: dey.tanmoy1988@gmail.com
Introduction
Cerebrovascular disease represents a major reason for mortality and morbidity worldwide. Imaging plays a pivotal role in the management of stroke patients. Haemorrhagic stroke diagnosis is straightforward using a Computed Tomography (CT) scan whereas early ischaemic strokes are sometimes difficult to diagnose by imaging. The use of Magnetic Resonance Imaging (MRI) may diagnose ischaemic stroke more convincingly; however MRI remains less available, time consuming and complicated. Unenhanced CT can be performed quickly; can help to identify early signs of stroke.
Aim
To determine the validity of CT in the evaluation of acute ischaemic stroke compared to MRI for early diagnosis.
Materials and Methods
The study was a cross-sectional study conducted in the Department of Radiodiagnosis, Agartala Government Medical College and GB Pant Hospital, Agartala, Tripura, India. The study period was from December 2018 to December 2020 and included 70 patients. The instruments used were SIEMENS 128 slice CT-SOMATOM model definition AS and SIEMENS 3.0 Tesla MRI-SKYRA model. Statistical Package for Social Sciences (SPSS) for Windows, version 25.0 (SPSS Inc, Chicago, USA) was used for data analysis.
Results
Out of all patients (n=70) 63 patients were ultimately found to have infarction. Out of these 63 cases of infarction 69.84%(n=44) were male and 30.16% (n=19) were female. Sensitivity of CT scan was 87.3%, specificity was 71.4%, positive predictive value was 96.4%, negative predictive value was 38.4% and accuracy was 85.7%. The p-value was 0.002. In all patients who presented before six hours (n=15) showed decreased creatinine value during Magnetic Resonance Spectroscopy (MRS) in the lesion area compared to the normal side of brain. None of the patients showed variation in the lactate value. Those presenting after 6 hours (n=48), creatinine was reduced in all the cases (100%), Choline was increased in 89.6%.
Conclusion
Sensitivity and specificity of CT scan is lower than MRI. Diffusion-Weighted Imaging (DWI) has 100% sensitivity in diagnosing acute infarction.
Diffusion-weighted imaging, Magnetic resonance spectroscopy, Time of flight imaging
Introduction
Cerebrovascular accident or stroke is defined as an acute loss of focal and at times global (applied to patients in deep coma and those with subarachnoid haemorrhage) cerebral function, the symptoms lasting more than 24 hours or leading to death with no apparent cause other than that of vascular origin [1].
Stroke is one of the leading causes of morbidity and mortality after heart disease and cancer in developed and developing countries and is becoming an important cause of disability in low-income and middle-income countries like India. Most stroke survivors live with disabilities and the cost of ongoing rehabilitation and long term care is very high [2,3].
The exact prevalence of ischaemic stroke in Indian population is unknown, although it accounts for about 1% of admissions to general hospitals. About 15 to 30% of patients die with each episode of cerebral infarction [4].
Computed Tomography (CT) scan can non invasively and reliably diagnose and distinguish between strokes due to cerebral infarction and haemorrhage [5]. Initial Non Contrast Computed Tomography (NCCT) scans obtained in the first six hours are abnormal in 50-60% of acute ischaemic strokes. The most specific but least sensitive sign is a hyperattenuating vessel filled with acute thrombus. A dense Middle Cerebral Artery (MCA) sign is seen in cases with M1 occlusion. Blurring and indistinctness of gray-white matter interfaces can also be seen. Loss of the insular definition (Loss of insular ribbon sign) is a common finding. Wedge-shaped parenchymal hypodensity and cortical sulcal effacement develop in large territorial occlusions [6].
Among different Magnetic Resonance Imaging (MRI) sequences T1 Weighted Imaging (T1WI) is usually normal within the first three to six hours. Fluid Attenuated Inversion Recovery (FLAIR) in acute strokes shows cortical swelling and hyperintensity within the first four hours. T2 scans become positive slightly later, generally within 12-24 hours. FLAIR-DWI “mismatch” (negative FLAIR, positive DWI) has been suggested as a quick indicator of viable ischaemic penumbra and eligibility for thrombolysis [6].
DWI is a form of MR imaging, based upon random Brownian motion of water molecules in voxel of tissue. In ischaemic stroke Apparent Diffusion Coefficient (ADC) values decrease, producing high signal intensity on DWI images [6].
Contrast unenhanced Time Of Flight MR-Angiogram (TOF MRA) is 80-85% sensitive and 95% specific for the detection of >70% Internal Carotid Artery (ICA) stenosis. MR Spectroscopy (MRS) is a non invasive dynamic study of intracellular metabolism of cerebral ischemia. In the region of infarction lactate appears, while N-Acetylaspartate (NAA) and total creatine may be reduced compared to the contralateral hemisphere. Choline may also get increased [6]. Various studies have concluded that DWI is superior to Non Contrast Computed Tomography (NCCT) scan in the diagnosis of acute ischaemic stroke [7-10].
However, such a study to determine the validity of a CT scan in comparison to MRI was not performed in Northeast India. The primary objective of the study was to determine the validity of CT scan in comparison to MRI in diagnosis acute ischaemic stroke. The secondary objective was to find out the role of Magnetic Resonance Spectroscopy (MRS) and Time of Flight (TOF) in diagnosis of ischaemic stroke.
Materials and Methods
The study was a cross-sectional study conducted in the Department of Radiodiagnosis, Agartala Government Medical College and GB Pant Hospital, Agartala, Tripura, India. The study period was from December 2018 to December 2020. Institutional Ethical Committee approval {Ref No. 4(6-11)-AGMC/Medical Education/Ethics Com/2018/1509} was obtained.
Inclusion and Exclusion criteria: All patients who were admitted within 24 hours of onset of symptoms in one unit of Medicine Department, were having signs of acute cerebral stroke and gave consent to participate were included in the study. Those who were found to have haemorrhagic stroke in initial CT scan, those having contraindication to MRI, pregnant women, those having multiple lesions and those denying consent were excluded. Thus, 70 patients were included in the study.
All the patients were examined using SIEMENS 128 slice CT- SOMATOM model definition AS and SIEMENS 3.0 Tesla MRI-SKYRA model. The typical signs of infarction e.g., parenchymal hypodensity, loss of grey- white differentiation, Dense MCA sign, Loss of insular ribbon sign were looked for in the CT scan. Then MRI was conducted using T1, T2, Fluid Attenuated Inversion Recovery (FLAIR), Diffusion-Weighted Imaging (DWI), Apparent Diffusion Coefficient (ADC), Magnetic Resonance Spectroscopy (MRS) and 3D Time of Flight (TOF). The technical parameters are given in [Table/Fig-1,2]. DWI was gold standard in diagnosis of ischaemic cerebral stroke. MRS data were evaluated to find out any change in the metabolite levels in the infarcted areas of brain. Time of flight data were evaluated to find out whether any change in the vessel architecture could be diagnosed.
Computed tomography imaging parameters.
| Parameter | kV | mA | Window width | Window level | Slice thickness (mm) | Field of View (FOV) (mm) | Time taken (Sec) |
|---|
| Values | 120 | 80 | 99 | 40 | 10 | 200 | 2-5 |
| Sequences | Repetition Time (TR) (ms) | Time to Echo (TE) (ms) | Slice thickness (mm) | Matrix | Field of view (mm) | Flip angle (Degrees) | Time taken |
|---|
| T1 | 627 | 6.00 | 4.00 | 256/223 | 96.88 | 70.00 | ≈3 min 12 s |
| T2 | 5300 | 99.00 | 4.00 | 320/320 | 100.00 | 150.00 | ≈1 min 15 s |
| FLAIR | 9000 | 81.00 | 4.00 | 320/217 | 96.88 | 150.00 | ≈1 min 12 s |
| DWI | 7000 | 98.00 | 4.00 | 192/192 | 100.00 | 90.00 | ≈2 min 50 s |
| MRS | 2000 | 135.00 | 15.00 | 320/320 | 160.00 | 90.00 | ≈9 min |
| TOF | 21 | 3.43 | 181.25 | 384/331 | 90.63 | 18.00 | ≈11 min |
The b value was kept 0 and 1000 during DWI sequences. ADC values were calculated automatically by the software. In MRS the Volume of interest (VOI) used is R>L 60 and A>P is 60. Voxel size was 10.1×10.1×7.0 whereas Signal to noise ratio (SNR) is 1.15.
FLAIR: Fluid attenuated inversion recovery; DWI: Diffusion-weighted imaging; ADC: Apparent diffusion coefficient; MRS: Magnetic resonance spectroscopy; TOF: Time of flight
Statistical Analysis
This was performed using Statistical Package for the Social Sciences (SPSS) software version 25.0 (SPSS Inc, Chicago, USA). The sensitivity, specificity, Positive predictive value, negative predictive value and accuracy of NCCT brain were calculated (with 95% confidence interval, p-value).
Results
The youngest patient in the study was of 18 years age and the oldest patient was 67 years of age. Age wise distribution of cases was depicted in [Table/Fig-3]. Male patients were 49 (70%) and female patients were 21 (30%) as shown in [Table/Fig-4].
Age distribution of study population.
| Age group (years) | Number of patients | Percentage (%) |
|---|
| ≤30 | 4 | 5.7 |
| 31-40 | 7 | 10.0 |
| 41-50 | 10 | 14.3 |
| 51-60 | 27 | 38.6 |
| >60 | 22 | 31.4 |
| Total | 70 | 100.0 |
Sex distribution of all patients.
| Gender | Number of patients | Percentage (%) |
|---|
| Male | 49 | 70.0 |
| Female | 21 | 30.0 |
| Total | 70 | 100.0 |
Out of 70 patients 63 patients (90%) were found to have infarction, two patients (2.85%) were diagnosed to have a tumor and five patients (7.14%) were found to be normal. CT scan found out 55 cases out of 63 cases of infarction and missed 08 cases as shown in [Table/Fig-5]. Sensitivity of CT scan was 87.3% (p-value=0.002), specificity of CT scan was 71.4% (p-value=0.002), positive predictive value- 96.4% (p=0.002), negative predictive value was 38.4% (p-value=0.002), accuracy was 85.7% (p-value=0.002) as given in the [Table/Fig-6]. The p-values was determined using Chi-square test.
Comparison of Computed Tomography (CT) and Magnetic Resonance Imaging (MRI) diagnosis of infarction.
| Infarction on CT scan | Infarction on MRI | Total |
|---|
| Present | Absent |
|---|
| Present | 55 | 2 | 57 |
| Absent | 8 | 5 | 13 |
| Total | 63 | 7 | 70 |
Validity of Computed tomography (CT) scan.
| CT scan features | Values (Percentage) | 95% Confidence interval |
|---|
| Sensitivity | 87.3 | 76.50-94.35 |
| Specificity | 71.4 | 29.04-96.33 |
| Positive predictive value | 96.4 | 89.46-98.89 |
| Negative predictive value | 38.4 | 21.94-58.16 |
| Accuracy | 85.7 | 75.29-92.93 |
The MRS was performed in all patients of infarction (n=63) and findings were examined in two groups those presenting within six hours (n=15) and those within 06-24 hours (n=48). Creatinine was reduced in all cases, NAA was reduced in most of the cases (60% cases that presented within six hours and 89.6% cases that presented beyond six hours) [Table/Fig-7,8].
Distribution of metabolite values amongst infarct patients presenting before 6 hours.
| Values compared to normal side | Creatine | Choline | NAA | Lactate |
|---|
| n, % | n, % | n, % | n, % |
|---|
| Increased | 0 | 9, 60% | 5, 33.4% | 0 |
| Decreased | 15, 100% | 5, 33.4% | 9, 60 | 0 |
| No change | 0 | 1, 6.6% | 1, 6.6% | 15, 100% |
| Total | 15, 100% | 15, 100% | 15, 100% | 15, 100% |
Distribution of metabolite values amongst infarct patients presenting after 6 hours.
| Values compared to normal side | Creatine | Choline | N-Acetylaspartate (NAA) | Lactate |
|---|
| n, % | n, % | n, % | n, % |
|---|
| Increased | 0 | 43, 89.6% | 4, 8.3% | 40, 83.3% |
| Decreased | 48, 100% | 5, 10.4% | 43, 89.6% | 0 |
| No change | 0 | 0 | 1, 2.1% | 8, 16.7% |
| Total | 48, 100% | 48, 100% | 48, 100% | 48, 100% |
Results of TOF imaging showed narrowing in 33.34% cases and Thrombosis in 14.28% cases as incorporated in [Table/Fig-9]. A case of acute infarction involving Pons is shown in [Table/Fig-10], Left MCA territorial infarction in [Table/Fig-11], Posterior Cerebral Artery (PCA) territorial infarct in [Table/Fig-12], cases presenting prior to and after 6 hours with their MRS changes, respectively [Table/Fig-13,14].
Distribution of Time of Flight (TOF) findings amongst infarct patients.
| TOF findings | Number of patient | Percentage (%) |
|---|
| Thrombosis | 9 | 14.28 |
| Narrowing | 21 | 33.34 |
| No abnormality | 33 | 52.38 |
| Total | 63 | 100.00 |
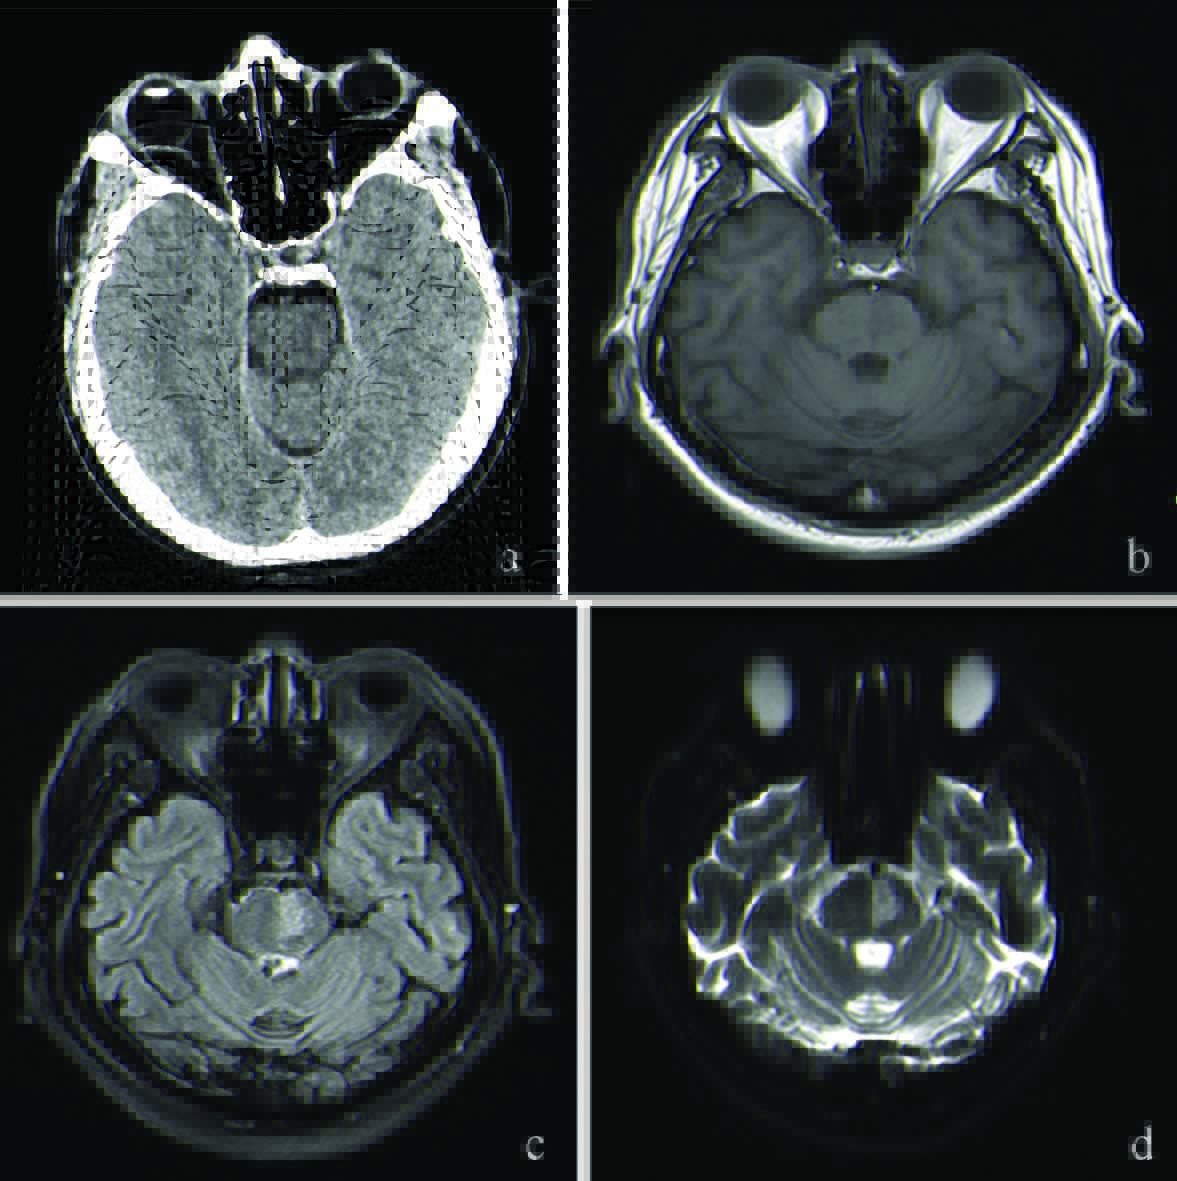
Acute infarction involving left side of the pons: (a) Non Contrast Computed Tomography (NCCT) scan is normal; (b) T1WI shows very subtle hypointense signal intensity; (c) Fluid Attenuated Inversion Recovery (FLAIR) shows definite signal change; (d) Diffusion restriction in Diffusion-Weighted Imaging (DWI).
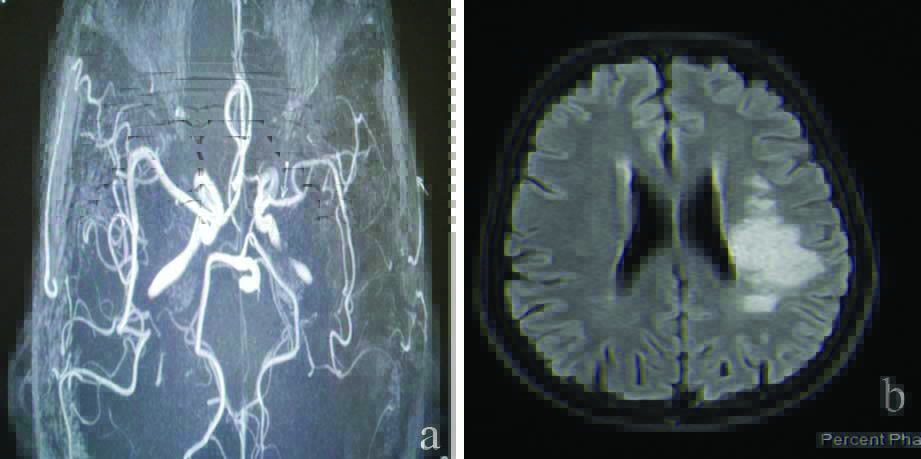
A case of acute left Middle Cerebral Artery (MCA) territorial infarct: (a) Narrowing of Left MCA in 3D Time of Flight (TOF); (b) Hyperintensity in Fluid Attenuated Inversion Recovery (FLAIR).
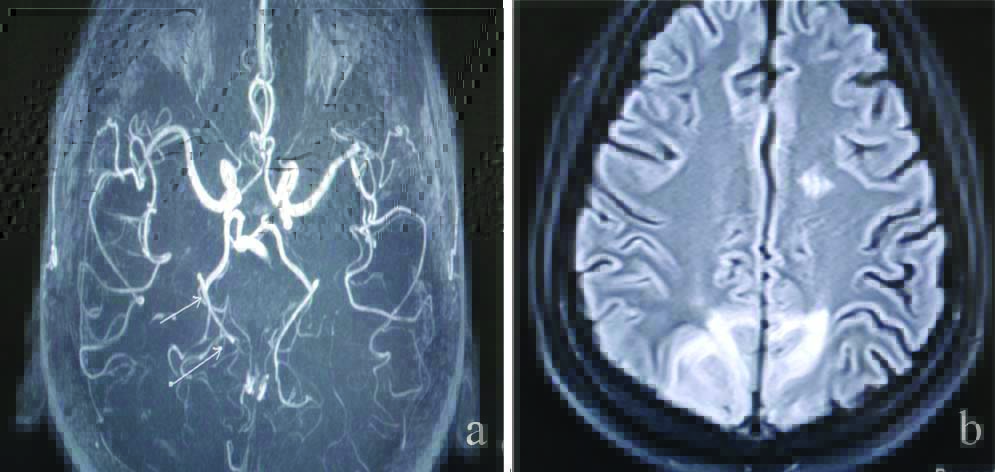
Acute Posterior Cerebral Artery (PCA) territorial infarct showing narrowing of right PCA in image: (a) and b) shows high signal intensity in FLAIR.
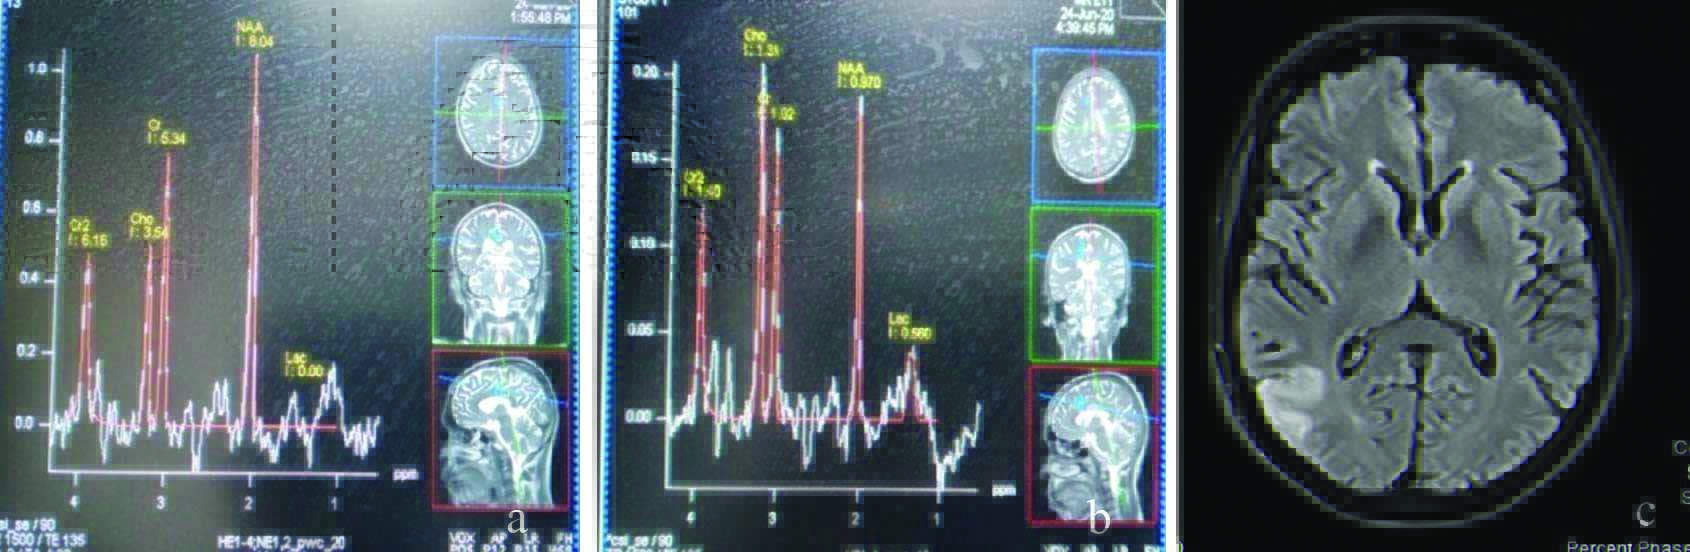
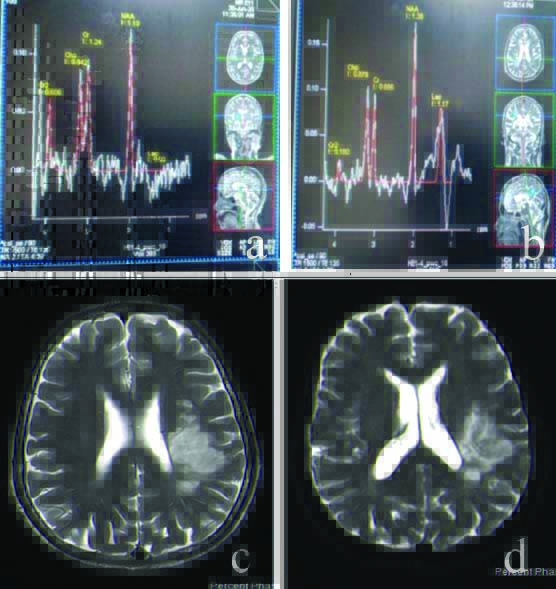
Acute infarction (<6 hours) case in right Middle Cerebral Artery (MCA) territory: (a) Normal metabolite profile on left side; (b) Raised choline, reduced creatinine and N-Acetylaspartate (NAA) with mild lactate peak in the involved area; (c) Infarction involving right occipital lobe.
Acute infarction involving left Middle cerebral artery (MCA) beyond 06 hours of onset: (a) No lactate peak in right side; (b) Lactate peak is seen on left side; (c) Hyperintensity in T2WI; (d) Diffusion restriction in Diffusion-Weighted Imaging (DWI) confirming the diagnosis.
Discussion
In the study, it was observed that majority of the patients i.e., 38.6% were in the age group of 50-60 years and next common i.e., 31.4% of the patients were in the age group of above 60 years that presented with infarction. This correlates with the study of Andreassen UW et al., in which they have found that cerebral infarction was most commonly occurring in people above the age of 50 years (91.2% were ≥50 years) [11]. Forty four patients (69.84 %) out of all the infarction patients were male (Male: Female ratio was 2.31:1). This correlates with other studies Andreassen UW et al., Appelros P et al., [11,12]. In both these studies it was found that infarction was more common in males.
Sensitivity of CT scan was 87.3% (p-value=0.002), specificity of CT scan- 71.4% (p=.002), positive predictive value was 96.4% (p-value=0.002), negative predictive value 38.4% (p-value=0.002), accuracy of 85.7% (p-value=0.002). Lansberg MG et al., found that acute infarction was found by DWI in all instances whereas CT could diagnose 42-63% cases only [13]. Fiebach JB et al., opined that the sensitivity of infarct detection by the experts was significantly better when based on DWI (CT/DWI, 61/91%) [14]. Smajlović D and Sinanović O found that the CT scan in the first 12 hours of the stroke onset was positive in 32% of the patients [15].
As we can say from the study that creatine levels were reduced in infarct areas in all the cases irrespective of time since presentation. A raised choline level and reduced NAA level is seen in infarct areas in most of the patients. The increased choline values and reduced NAA values are more pronounced as the time increases. Further, we can see from the study that hyperacute stage of infarction (<6 hours) does not show any change in lactate levels whereas beyond 6 hours of presentation lactate levels are raised in significant number (83.3%) of cases. Saunders DE said that NAA and total Cr/PCr are reduced within the infarct compared to the contralateral hemisphere [16]. Gideon P et al., conducted a study of 08 patients of infarction where they found that a high lactate level was found in the acute phase [17]. Ramin SL et al., in their article mentioned that in case of acute infarction there is reduction in NAA level and slight increase in the Choline level [18]. They also mentioned in their article that Lactate is also raised in infarction. Mazibuko N et al., also found in their study that after infarction there is reduced NAA and creatinine level and increased choline and lactate level [19].
A 3D-TOF MR angiography was done to delineate the circle of Willies and arterial branches from it. Out of all the patients of infarction (n=63) TOF could demonstrate findings in only approx. 47.6 % of cases. Out of all the patients with positive TOF findings (n=30), 21 cases (33.34%) was of arterial narrowing (Stenosis) and 09 cases (14.28 %) were such where thrombosis could be found. Among the cases of arterial narrowing most cases were involving the MCA territory i.e., 61.9%, (n=13), whereas least commonly involved arterial territory was MCA-ACA territory {4.7%, (n=1)}. All of the cases where thrombosis was found were involving the MCA (n=09). Ojha R et al., where they found MCA was the most common artery to be stenosed in patients with ischaemic stroke (27.6 %) [20]. Radbruch A et al., in their study found that sensitivity for detection of embolic occlusion within M2/M3 was significantly different 84% for SWI versus 39% for TOF-angiography [21]. Further study can be performed in comparing the different aspect of MRS in relation to acute infarction and their relation to time.
Limitation(s)
The study was a hospital based study involving only one tertiary hospital. Therefore, the demographic profiles in the present study may not be representative of actual distribution of disease in the community. Sample size was small. Same radiologist did CT scan and MRI interpretation hence, interobserver agreement could not be tested. MRA using 3D TOF did not include cervical vessels and intracranial venous imaging for interpretation. Patients with multiple lesions were excluded from the study.
Conclusion(s)
Cerebral Infarction is associated with significant morbidity and mortality. Correct choice of therapeutic options rests upon timely and accurate diagnosis. In this regard, CT scan is a quick and comparatively easily available modality. But it fails to diagnose some cases of acute infarction. Magnetic resonance imaging particularly DWI has a 100% sensitivity in diagnosing acute infarction. Computed tomography scan can be used as an initial tool of investigation in patients with suspected ischaemic stroke. However, MRI should be considered in patients who do not have any signs in CT scan but have persistent symptoms. Magnetic resonance spectroscopy can be used as identifying tool for time since occurrence in stroke however further study is required. A 3D TOF can identify the arterial territory but sensitivity is less. Therefore, an initial CT scan followed by a FLAIR and DWI may be postulated as best diagnostic protocol for ischaemic stroke patients. This study concludes that the Sensitivity and Specificity of CT scan is lower than MRI.
The b value was kept 0 and 1000 during DWI sequences. ADC values were calculated automatically by the software. In MRS the Volume of interest (VOI) used is R>L 60 and A>P is 60. Voxel size was 10.1×10.1×7.0 whereas Signal to noise ratio (SNR) is 1.15.
FLAIR: Fluid attenuated inversion recovery; DWI: Diffusion-weighted imaging; ADC: Apparent diffusion coefficient; MRS: Magnetic resonance spectroscopy; TOF: Time of flight
Author Declaration:
Financial or Other Competing Interests: None
Was Ethics Committee Approval obtained for this study? Yes
Was informed consent obtained from the subjects involved in the study? Yes
For any images presented appropriate consent has been obtained from the subjects. Yes
Plagiarism Checking Methods: [Jain H et al.]
Plagiarism X-checker: Jun 24, 2021
Manual Googling: Sep 21, 2021
iThenticate Software: Sep 28, 2021 (19%)
[1]. Hatano S, Experience from a multicenter registerBull. WHO 1976 54:541-53. [Google Scholar]
[2]. Bonita R, Beaglehole R, Stroke prevention in poor countries. Time for actionStroke 2007 38:2871-72.10.1161/STROKEAHA.107.50458917954904 [Google Scholar] [CrossRef] [PubMed]
[3]. Pandian JD, Srikanth V, Read SJ, Thrift AG, Poverty and stroke in India. A time to actStroke 2007 38:3063-69.10.1161/STROKEAHA.107.49686917954905 [Google Scholar] [CrossRef] [PubMed]
[4]. Osborn AG, Stroke, Chapter 11, In: Osborn AG, edDiagnostic neuroradiology 1994 St. LouisMosby:330-385. [Google Scholar]
[5]. Sandercock P, Molyneux A, Arlow C, Value of CT in patients with stroke: Oxfordshire Community Stroke ProjectBMJ 1985 290:193-97.10.1136/bmj.290.6463.1933917748 [Google Scholar] [CrossRef] [PubMed]
[6]. Osborn AG, Osborn’s brain imaging, pathology, and anatomy 2013 1st editionCanadaAmirsys publishing. Inc. [Google Scholar]
[7]. Brazzelli M, Sandercock PA, Chappell FM, Celani MG, Righetti E, Arestis N, Magnetic resonance imaging versus computed tomography for detection of acute vascular lesions in patients presenting with stroke symptomsCochrane Database Syst Rev 2009 7(4):CD00742410.1002/14651858.CD007424.pub219821415 [Google Scholar] [CrossRef] [PubMed]
[8]. Gonzalez RG, Schaefer PW, Buonanno FS, Schwamm LH, Budzik RF, Rordorf G, Diffusion-weighted MR imaging: Diagnostic accuracy in patients imaged within 6 hours of stroke symptom onsetRadiology 1999 210:6210.1148/radiology.210.1.r99ja021559885601 [Google Scholar] [CrossRef] [PubMed]
[9]. Barber PA, Darby DG, Desmond PM, Gerraty RP, Yang Q, Li T, Identification of major ischaemic change. Diffusion-weighted imaging versus computed tomographyStroke 1999 30:2059-65.10.1161/01.STR.30.10.205910512907 [Google Scholar] [CrossRef] [PubMed]
[10]. Albers GW, Lansberg MG, Norbash AM, Tong DC, O’Brien MW, Woolfenden AR, Yield of diffusion-weighted MRI for detection of potentially relevant findings in stroke patientsNeurology 2000 54:1562-67.10.1212/WNL.54.8.156210762494 [Google Scholar] [CrossRef] [PubMed]
[11]. Andreassen UW, Thomassen L, Naess H, Comparison between ischemic stroke patients <50 years and ≥50 years admitted to a single centre: The bergen stroke studyStroke Research and Treatment. Stroke Res Treat 2011 2011:18325610.4061/2011/18325621318148 [Google Scholar] [CrossRef] [PubMed]
[12]. Appelros P, Stegmayr B, Terént A, Sex differences in stroke epidemiology a systematic reviewAHA Journals, Stroke 2009 40:1082-90.10.1161/STROKEAHA.108.54078119211488 [Google Scholar] [CrossRef] [PubMed]
[13]. Lansberg MG, Albers GW, Beaulieu C, Marks MP, Comparison of diffusion-weighted MRI and CT in acute strokeNeurology 2000 54(8):1557-61.10.1212/WNL.54.8.155710762493 [Google Scholar] [CrossRef] [PubMed]
[14]. Fiebach JB, Schellinger PD, Jansen O, Meyer M, Wilde P, Bender J, CT and diffusion-weighted MR imaging in randomized order: Diffusion-weighted imaging results in higher accuracy and lower interrater variability in the diagnosis of hyperacute ischemic strokeStroke 2002 33(9):2206-10.10.1161/01.STR.0000026864.20339.CB12215588 [Google Scholar] [CrossRef] [PubMed]
[15]. Smajlović D, Sinanović O, Sensitivity of the neuroimaging techniques in ischemic strokeMedArh 2004 58(5):282-84. [Google Scholar]
[16]. Saunders DE, MR spectroscopy in strokeBritish Medical Bulletin. Br Med Bull 2000 56(2):334-45.10.1258/000714200190325611092084 [Google Scholar] [CrossRef] [PubMed]
[17]. Gideon P, Henriksen O, Sperling BK, Christiansen P, Olsen TS, Jørgensen HS, Søborg PA, Magnetic resonance spectroscopy of acute cerebral infarctionsUgeskr Laeger 1993 155(40):3194-99. [Google Scholar]
[18]. Ramin SL, Tognola WA, Spotti AR, Proton magnetic resonance spectroscopy: Clinical applications in patients with brain lesionsSao Paulo Med J 2003 121(6):254-59.10.1590/S1516-3180200300060000814989143 [Google Scholar] [CrossRef] [PubMed]
[19]. Mazibuko N, Tuura RO, Sztriha L, O’Daly O, Barker GJ, Williams SCR, Subacute changes in N-Acetylaspartate (NAA) following ischemic stroke: A serial MR spectroscopy pilot studyDiagnostics (Basel) 2020 10(7):48210.3390/diagnostics1007048232708540 [Google Scholar] [CrossRef] [PubMed]
[20]. Ojha R, Huang D, An H, Liu R, Du C, Shen N, Distribution of ischemic infarction and stenosis of intra- and extracranial arteries in young Chinese patients with ischemic strokeBMC Cardiovasc Disord 2015 15:15810.1186/s12872-015-0147-526597918 [Google Scholar] [CrossRef] [PubMed]
[21]. Radbruch A, Mucke J, Schweser F, Deistung A, Ringleb PA, Ziener CH, Parison of susceptibility weighted imaging and TOF-angiography for the detection of thrombi in acute strokePLoS One 2013 8(5):e6345910.1371/journal.pone.006345923717426 [Google Scholar] [CrossRef] [PubMed]