Chest CT is an imaging tool for diagnosing pneumonia- is relatively easy to perform and can produce rapid diagnosis of COVID-19. Chest CT can demonstrate typical radiographic features in COVID-19 patients such as ground-glass opacities, multifoca patchy consolidation, and/or interstitial changes with a peripheral distribution [5]. With RT-PCR results as reference in 1014 patients, the sensitivity, specificity and accuracy of chest CT in indicating COVID-19 infection were 97% (580/601), 25% (105/413) and 68% (685/1014), respectively [6]. The TSS is a quantification method to score the severity of inflammation on CT images. It is based on summing up the degree of acute lung inflammatory lesions of each lobe. The leading cause for mortality of patients with COVID-19 is respiratory failure from acute respiratory distress syndrome [7].
Studies that give the amount of SARS-CoV-2 RNA in clinical specimens by reporting Ct values for RT-PCR are limited [8]. Studies that compare RT-PCR Ct values (viral load) with CT chest severity are limited. This study explores the correlation between TSS of chest CT and Ct values of SARS-CoV-2 of patients and factors associated with high TSS and low Ct value. This may help in predicting the course of hospital stay and outcome of COVID-19 positive patients.
Materials and Methods
It was a cross-sectional study conducted on patients admitted to Believers Church Medical College Hospital, Thiruvalla, Kerala, between September 2020 to March 2021. The study was initiated after obtaining clearance from the Institutional Ethics Committee (IEC/2021/08/225). These patients underwent COVID-19 RT-PCR testing by TrueNat and were subsequently subjected to CT scan of the chest. The TrueNat is an indigenously developed chip-based, battery operated RT-PCR, approved by Indian Council of Medical Research [9]. Data regarding socio-demographic details, symptoms of COVID-19, CT scan score, Ct value, in hospital mortality and transfer/admission to ICU were collected from electronic health records.
Inclusion criteria: All COVID-19 patients between September 2020 and March 2021 where both TrueNat RT-PCR testing and Chest CT scan were performed during their stay in the hospital.
Exclusion criteria: Patients aged less than 18 years were excluded from the study.
Cycle Threshold (Ct) Interpretation of PCR (TrueNat)
The Orf1 gene is the COVID-19 specific gene. The Ct values for Orf1 gene is taken into consideration. The Ct ≥20 indicates Low viral load and Ct <20 indicates High viral load [10].
Chest CT-SS Assessment
Yang R et al., Chest CT-Severity Score (CT-SS) was used for assessing COVID-19 burden on the initial scan obtained after admission [11]. This score uses lung opacification as a surrogate for extension of the disease in the lungs. The CT-SS is an adaptation of a method previously used to describe ground-glass opacity, interstitial opacity and air trapping, which was correlated with clinical and laboratory parameters in patients after Severe Acute Respiratory Syndrome (SARS) [10]. According to the anatomic structure, the 18 segments of both lungs were divided into 20 regions, in which the posterior apical segment of the left upper lobe was subdivided into apical and posterior segmental regions, whereas the anteromedial basal segment of the left lower lobe was subdivided into anterior and basal segmental regions. The lung opacities in all of the 20 lung regions were subjectively evaluated on chest CT images using a system attributing scores of 0, 1, and 2 if parenchymal opacification involved 0%, less than 50%, or equal to or more than 50% of each region, respectively. The CT-SS was defined as the sum of the individual scores in the 20 lung segment regions, which may range from 0 to 40 points (40 points being the maximum points) [11]. All thin section CT images were reviewed at a window width and level of 1000 to 2000 Hounsfield Units (HU) and 700 to 500 HU, respectively, for lung parenchyma.
Image Analysis
Two radiologists with 29 and 8 years of experience who were blinded to the RT-PCR Ct values reviewed all CT images and decided on the score by consensus. The clinical symptoms, history of co-morbidities was available for both readers. Based on the TSS, the COVID-19 disease was classified as mild (score: 1-5), moderate (score: 6-10) and severe (score: 11-20) for one lung. For both lungs combined, the disease severity was classified as Mild (score: 1-10), Moderate (score: 11-20), Severe (21-40).
Statistical Analysis
Descriptive statistics was presented as percentages and mean±SD (Standard Deviation). Categorical variables were compared using the chi-square tests. Correlation was assessed using spearmans correlation coefficient. Independent sample t-test and one-way Analysis of Variance (ANOVA) was used for comparison of means. All tests are two-tailed; p-values <0.05 was considered as statistically significant. Statistical analysis were performed by using Statistical Package for Social Sciences (SPSS) version 21.0.
Results
Confirmed COVID-19 positive patients (n=102) with a Chest CT scan performed were analysed. Eleven patients had no chest CT findings related to COVID-19 and hence a TSS could not be given. They were excluded from correlation analysis. The mean age of the patients was 64.13±13.17 years and majority were males (70.6%). Only 26.5% were below 60 years. The youngest person was 25 years and the oldest was 87 years. At the time of presentation to the hospital, majority of them had fever (57.8%). Characteristics of COVID-19 patients are given in [Table/Fig-1].
Characteristics of patients (n=102).
| Variables | Number | Percentage (%) |
|---|
| Age |
| <60 years | 27 | 26.5% |
| ≥60 years | 75 | 73.5% |
| Gender |
| Male | 72 | 70.6% |
| Female | 30 | 29.4% |
| Diabetes |
| Present | 70 | 68.6% |
| Absent | 32 | 31.4% |
| Hypertension |
| Present | 68 | 66.7% |
| Absent | 34 | 33.3% |
| COPD |
| Present | 9 | 8.8% |
| Absent | 93 | 91.2% |
| Asthma |
| Present | 7 | 6.9% |
| Absent | 95 | 93.1% |
| Coronary artery disease |
| Present | 21 | 20.6% |
| Absent | 81 | 79.4% |
| Chronic kidney disease |
| Present | 21 | 20.6% |
| Absent | 81 | 79.4% |
| Presenting symptoms |
| Dyspnoea |
| Present | 43 | 42.2% |
| Absent | 59 | 57.8% |
| Fever |
| Present | 59 | 57.8% |
| Absent | 43 | 42.2% |
| Viral Load |
| High | 32 | 31.4% |
| Low | 70 | 68.6% |
| Needed ICU admission |
| Yes | 32 | 31.4% |
| No | 70 | 68.6% |
| Died/Cured |
| Died | 13 | 12.7% |
| Cured | 89 | 87.3% |
COPD: Chronic obstructive pulmonary disease
The mean viral load was highest in patients with moderate (n=33) (21.22±6.30), mild (n=13) (21.48±8.31), and severe (n=45) (24.19±4.67) lung involvement [Table/Fig-2]. Viral load was significantly lower in patients who had high TSS on Chest CT [Table/Fig-2].
Analysis of variables for TSS of CT scan.
| Variables | Mild COVID-19 on CT scan (13) | Moderate COVID-19 on CT scan (33) | Severe COVID-19 on CT scan (45) | p-value |
|---|
| Age> 60 years, n (%) | 11 (16.2) | 25 (36.8) | 32 (47.1) | 0.60 |
| Gender, male | 12 (17.6) | 21 (30.9) | 35 (51.5) | 0.10 |
| Fever present, n (%) | 5 (8.8) | 23 (40.4) | 29 (50.9) | 0.13 |
| Dyspnoea present, n (%) | 3 (8.1) | 12 (32.4) | 22 (59.5) | 0.20 |
| Diabetes present, n (%) | 8 (12.7) | 27 (42.9) | 28 (44.4) | 0.14 |
| Hypertension, n (%) | 9 (14.1) | 22 (34.4) | 33 (51.6) | 0.81 |
| Coronary artery disease, n (%) | 4 (22.2) | 4 (22.2) | 10 (55.6) | 0.30 |
| Chronic kidney disease, n (%) | 3 (15.8) | 6 (31.6) | 10 (52.6) | 0.89 |
| Viral load (Ct value), mean±SD deviation* | 21.48±8.31 | 21.22±6.30 | 24.19±4.67 | 0.06 |
| Time duration between symptom onset and RT-PCR* | 3.00±2.21 | 4.44±3.25 | 5.55±3.62 | 0.05 |
| Length of hospital stay, mean±SD deviation* | 9.08±5.22 | 10.97±5.90 | 11.51±5.10 | 0.36 |
CT: Computed tomography; RT-PCR: Reverse transcriptase-polymerase chain reaction; TSS: Total severity score; COVID-19: Coronavirus disease-2019; SD: Standard deviation; *ANOVA test is used. For other variables, Chi-square test was used; Eleven people had lung changes unrelated to COVID-19, hence eliminated from the analysis
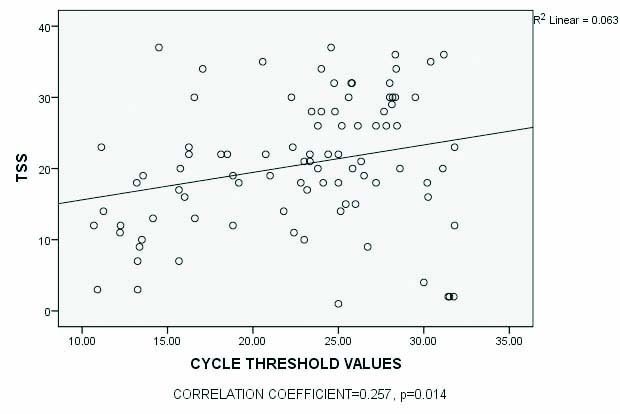
There was an inverse relationship between viral load (Ct) value of SARS-CoV-2 in nasopharyngeal specimens and TSS of CT among all patients [Table/Fig-3]. Similarly, there was a significant difference in the mean time to diagnosis by RT-PCR after symptom onset among those with mild (3.00±2.21 days), moderate (4.44±3.2 days) and severe (5.55±3.6 days) disease [Table/Fig-2]. There was a significant difference between mean duration to symptom onset and performance of a chest CT scan among those with a high viral load (4.97±2.65) compared to those with a low viral load (6.81±4.5), (p-value=0.01) [Table/Fig-4]. The mortality rate was 12.7% (13/102). Among those who died due to COVID-19, 12/13 (92.3%) were above 60 years of age.
Scatter plot showing correlation between TSS and cycle threshold (Ct) values.
Comparison of viral load with time to performance of RT-PCR, CT scan and length of hospital stay.
| Variables studied | Viral load | p-value* |
|---|
| High | Low |
|---|
| Time between symptom onset and RT-PCR test (days) | 3.33±2.64 | 5.17±3.52 | 0.006 |
| Time between symptom onset and performance of CT scan (days) | 4.97±2.65 | 6.81±4.50 | 0.011 |
| Length of hospital stay (days) | 11.29±6.28 | 10.54±4.72 | 0.511 |
*t-test
Discussion
The study was conducted in a tertiary care referral centre in Central Kerala. Chest CT scan is not done as a routine for all COVID-19 patients due to increased case load. Also, we rely on antigen tests, open RT-PCR, TrueNat and GeneXpert for detecting COVID-19. No standardisation for Ct values exists across RT-PCR platforms, making it difficult to compare results among different tests. So, the actual number of patients who were admitted here were much higher and the number shown here only reflects patients who had undergone both TrueNat RT-PCR and CT scan during their course of stay in the hospital. The RT-PCR Ct values might have limitations in reliably predicting disease severity. There are potential caveats that must be considered while interpreting Ct values. The Ct values from viral RNA can vary depending on method of specimen collection, specimen source, transport, and the time from infection-to collection -to analysis [12].
Theoretically, viral replication peaks during the first days of symptoms onset. The highest viral loads from upper respiratory tract samples were observed at the time of symptom onset, with levels slowly decreasing over time [13]. The present study reveals an inverse relation between viral load and TSS, which is similar to the findings by Karahasan Yagci A et al., [10]. Viral load of an infected person at an initial stage reflects how well a virus is replicating in an infected person which might be an important determining factor for disease transmission in the community apart from population density and its mobility [14]. The IgG (Immunoglobulin G) responses were detected in most patients in both the severe and mild groups at nine days after onset [15]. Viral components trigger an immune response in the host to eliminate the virus. These viral antigens can be either recognised by the B-cells or presented by Major Histocompatibility Complex (MHC) complexes to the T-cells, resulting in antibody production, increased cytokine secretion, and cytolytic activity in the acute phase of infection [16]. In the clinical process of COVID-19 pneumonia, there is a window period (about 5-7 days) between the diagnosis and the occurrence of lung damages as a result of cytokine storm [17]. This suggests that a chest CT scan done after the end of the first week may be more sensitive to identify changes in the lung parenchyma.
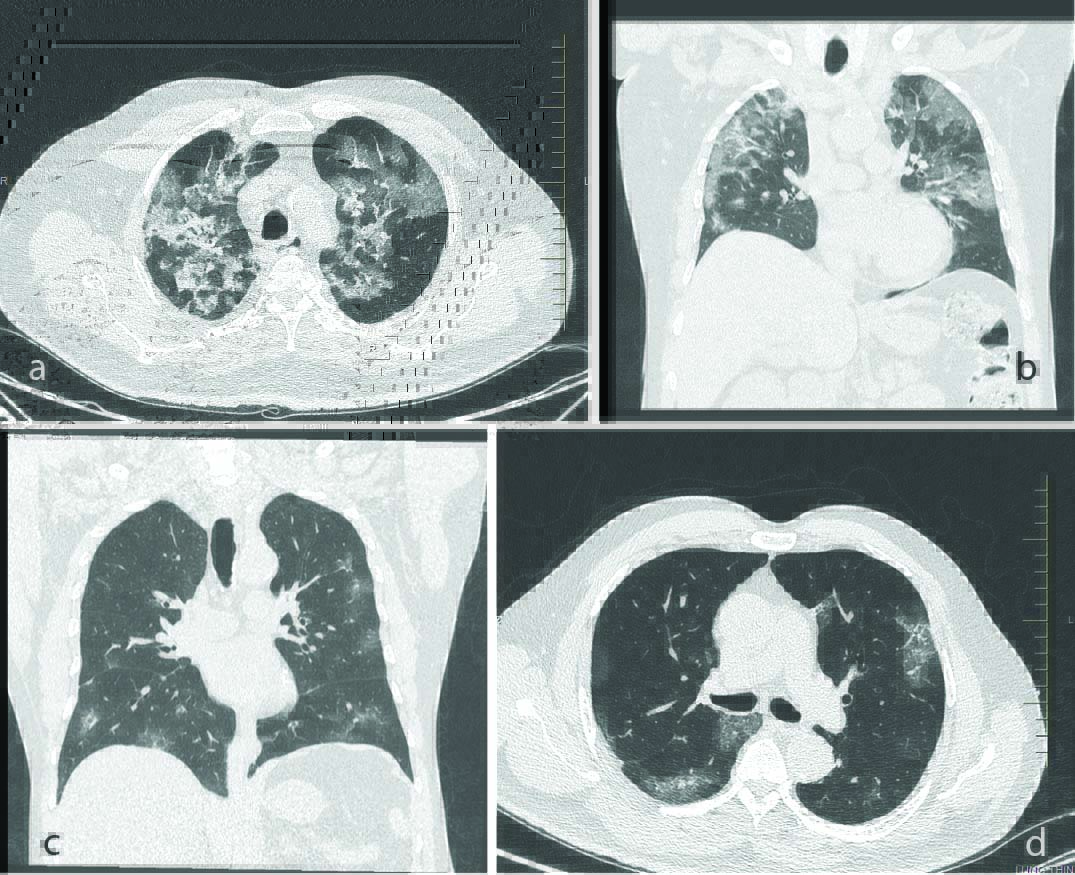
In the early course of COVID-19 pneumonia, pulmonary CT scans could either be normal or show subtle findings [18]. Patients may have moderate-severe symptoms but normal chest CT scan, which is not unusual during the first four days of infection. In patients with respiratory disease, the major pulmonary CT findings of COVID-19 pneumonia were Ground-Glass Opacification (GGO), crazy-paving pattern and consolidation predominantly in subpleural locations in the lower lobes [Table/Fig-5]. Lung abnormalities on chest CT scans showed greatest severity approximately 10 days after initial onset of symptoms [19]. The type, extent, and distributions of pulmonary manifestations associated with COVID-19 significantly differ with the timing of CT scan, with more evident findings in scans taken after the first week of symptom onset [20]. This reflects the time by which pathological conversion from the interstitial oedema or hyaline membrane injury early in the disease to the influx of exudates and frank alveolar involvement later on, being increasingly visible on lung imaging [21]. The present study also reveals that more the time duration between symptom onset and imaging, more is the severity of lung involvement. This could be the only possible reason to explain the inverse relationship between viral load and lung involvement as assessed by TSS. The criterias taken for assessment were those of study by Yang R et al., the average CT severity score was considered as 34/40 and the mild form of the disease was characterised by severity score of 14/40 [11].
CT scan picture a&b) Multifocal discrete and confluent patches of ground glass opacities, mass like consolidation and interlobular septal thickening noted in bilaterally predominantly in peripheral distribution, Typical pattern of Coronavirus Disease-2019; c&d) Few areas of peripheral ground-glass opacities in bilateral upper lobes, lower lobes, and right middle lobe.
Although SARS-CoV-2 viral load among hospitalised COVID-19 patients at the time of admission independently correlated with the risk of in-hospital mortality [10], in the present study, only (n=5) 38.46% with in- hospital mortality had high viral load at presentation. Also, no other risk factors were found to be significantly associated with high TSS- indicative of impending danger. It may be speculated that although viral load in the nasopharyngeal specimens is high in the early phases of COVID-19, it is not necessarily related to changes in chest CT. Therefore, in those with persistent symptoms, it is better to repeat the CT scan later in the course of the disease to warrant prompt response.
It is suggested that viral load is important in predicting if an individual is very contagious [22] and can be used to minimise potential spread, whereas chest CT can help to identify cases requiring extensive medical care.
Limitation(s)
Absence of a fixed duration for performance of chest CT scan as well as measurement of viral load after symptom onset is a limitation of the study.
Conclusion(s)
Viral load is not a critical factor that influences pulmonary manifestations in COVID-19, nor in-hospital mortality. There is a significant association between pulmonary manifestations associated with COVID-19 and the timing of a Chest CT scan. CT scan may be more useful to detect lung involvement when done nearing or after the first week of symptom onset, irrespective of the viral load. Among those with moderate-severe symptom at presentation, it may be better to repeat a CT scan as it may be quite normal during the initial few days of symptom onset. Viral load can be important in predicting transmissibility and to minimise potential spread, whereas chest CT can help identify cases requiring extensive medical care.
COPD: Chronic obstructive pulmonary disease
CT: Computed tomography; RT-PCR: Reverse transcriptase-polymerase chain reaction; TSS: Total severity score; COVID-19: Coronavirus disease-2019; SD: Standard deviation; *ANOVA test is used. For other variables, Chi-square test was used; Eleven people had lung changes unrelated to COVID-19, hence eliminated from the analysis
*t-test