The Computed Tomography (CT) has become a very essential diagnostic imaging tool in many clinical settings due to its cross-sectional imaging capabilities, high temporal and spatial resolution and excellent anatomical details [1]. It is also considered in medical imaging as the most important contributor to patient’s radiation exposures. Today, it accounts for up to 40% of the resultant collective dose from diagnostic radiology [2,3]. The increased use of this high dose modality has been of great concern globally because of the possibility of inducing undesired health hazards in the patient, such as cancer. Furthermore, the significant radiation dose absorbed during the radiological investigation of the head is of great concern considering the radiosensitive organs around this region [4].
The patient’s exposures are more critical in CT because besides using ionising radiation, the doses are typically much higher than for conventional radiographic or fluoroscopic procedures [5]. A survey of CT doses in four continents covering 40 countries indicated that CT of the head is the most common examination [5].
The head CT scan is the most common CT examination performed in Europe and also significantly contributes to the total collective effective dose of the population [6]. Recent studies in Nigeria on radiation doses from CT imaging focused mostly on head imaging, which is also adjudged to be the most common CT procedure [5]. The absorbed radiation dose to adults, for one head CT examination has been reported as being equivalent to the radiation dose for 100-150 conventional chest radiographs. This is 2 mSv for head CT against 0.02 mSv for conventional chest radiographs or 60 mGy compared to 0.4 mGy [7]. The typical range of exposure factors for adult chest X-ray is between 62 and 85 kVp, and 10 to 30 mAs [6]. The exposure factors for a standard head CT scan are 120-140 kVp, and 200-350 mAs [6].
The components of CT image quality are noise, slice thickness (Z-axis resolution), low contrast resolution and high contrast resolution. Image quality can be defined in terms of image noise, which limits low contrast resolution, and spatial resolution [8]. In CT imaging, however, the task of acquiring good quality images have been found to be chiefly associated with the use of high radiation doses, with increased doses resulting in production of images with less noise and vice versa [2,9,10].
Computed tomography as a source of ionising radiation is a growing public health concern. The recent developments in CT imaging technology provide a wide range of clinical applications and increasing use. Although the benefits of justified CT examinations outweigh potential risks, several international research groups are investigating methods of reducing radiation dose while maintaining diagnostic efficacy [11]. The ease of making proper and accurate diagnosis in medical imaging is dependent on the quality of image produced. The better the image quality, the more accurate will be the diagnosis. The optimal use of ionising radiation involves the interplay of diagnostic quality of the image, radiation dose to the patient and choice of examination technique [2]. This study was designed to investigate the relationship between variations in scan parameters and image quality in brain CT scanning with a view of finding a balance between image quality and radiation dose that is beneficial to the patient.
Materials and Methods
This was an experimental cross-sectional study conducted at the Radiology Unit of a Private Diagnostic Clinic in Enugu, Nigeria from September 2018 to February 2019. Ethical approval (ERC/FHST/NAU/2019/2285) for the study and institutional permission to collect data were obtained. A thorough explanation of the study procedures was made to the participants by the researchers. All the participants signed a written consent form.
Sample size calculation: The sample size of 150 was determined using Yamane T formula [12]:

Where, n=desired sample size
N=population of study
e=accepted error limit (0.05)
From the radiological report’s archives of the study centers, a total population of 240 patients underwent Brain CT from January 2018 to August 2018.
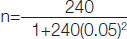
n=150
A consecutive sampling method was adopted for selecting a sample size of 150 from the target population.
Inclusion criteria: The adult patients of either sex who presented at the study centre during period of study were included. Also patients who were ambulant and referred for non contrast axial CT brain images {whose required tissue area(s) had homogenous Region Of Interest (ROI) and with Anteroposterior Circumference Diameter (APCD) 170-180 cm of brain} were included in study.
Exclusion criteria: Patients who were less than 18 years of age and having brain tissue with an inhomogenous ROI were excluded from the study.
Study Procedure
All CT examinations of the brain included in this study were performed by the researchers with an 8-section multi-detector CT scanner; GE BrightspeedTM manufactured by General Electric Healthcare Technologies. The participants comprised male and female that were 18 years of age and above. They were divided into three groups with each group made up of 50 participants based on the inclusion criteria set for this study. The characteristics of the groups are as follows:
Group I: This was the control group. The participants in this group were scanned with the default setting for adult brain CT in the centre. The parameters that were used are 140 kVp for the tube voltage, 8×1.25 mm detector configuration, GRT of 2 seconds, 10 mm table feed per GRT, and milliamperage of 170 using a standard soft tissue kernel.
Group II: The participants in this group were scanned using 120 kVp for the tube voltage, 8×1.25 mm detector configuration, GRT of 1.0 seconds, 10 mm table feed per GRT, milliamperage of 160, using a standard soft tissue kernel.
Group III: The participants in this group were scanned using 100 kVp for the tube voltage, 8×1.25 mm detector configuration, milliamperage of 150, 10 mm table feed per GRT, and 0.8 seconds GRT using a standard soft tissue kernel.
According to the method used by Kilic K et al., image quality was estimated quantitatively by objective measurement of image noise (σ), calculation of SNR, and CNR [13]. These estimations were done with images acquired with the soft tissue kernel and displayed on cerebral (or brain) window, using window width of 100-120 HU and window level of 40 HU for all the selected images, according to European Commission [2]. This is to avert the introduction of any type of error in the ROI measured values that may arise as a result of using wrong kernel options or window width and level. The image noise was objectively measured by placing a 4-6 mm2 ROI icon on a homogenous area of the White Matter (WM), Gray Matter (GM), Cerebrospinal Fluid (CSF) and surrounding air outside the displayed axial brain image of the patient in about three different images at the supratentorial region and level of the basal ganglia.
The Standard Deviation (SD) value that followed immediately after the CT number (signal intensity value) of the ROI for each measured structure was recorded as it was displayed on the CT monitor. This action was repeated in about five other different homogenous areas of each of the four different structures and in each of the three selected images, resulting in the obtainment of six different values for each homogenous structure in each image, and a sum total of about 18 measurements of each structure from all the CT images. The mean of the SD values measured was calculated for each structure and the average of the four different mean for the four different structures: GM, WM, CSF and surrounding air were computed and which represents the general objectively quantified image noise contained in the image of the patient, according to EC [2] and Kilic K et al., [13].
Dose Measurement
The mean values of the CT Dose Index volume (CTDIvol) and Dose Length Product (DLP) obtained for these examinations as displayed on the dose log on the CT computer monitor were recorded for each patient. Using the region conversion factor (EDLP or k) for adult head (0.0021mSv mGy-1cm-1), the effective dose equivalent (E) was calculated for each patient according to American Association of Physicists in Medicine (AAPM) [10] and Korn A et al., [14].
Statistical Analysis
The measurements made in the course of data collection were recorded in a data capture sheet designed specifically for this study. The obtained data were analysed using Statistical Package for Social Sciences application software, version 17.0 (SPSS Incorporated, Chicago, Illinois). Both descriptive statistics (mean and SD) and inferential (Pearson’s Correlation test and Regression analysis) statistics were used for data analysis with Kolmogorov-Smirnov Off test used to check for normality of data.
Mean and SD of objective image noise, SNR, CNR, DLP, Effective dose (E) and CTDI vol for the individual subgroups were calculated and kept aside. Using Pearson correlation coefficient with p-value <0.05 level of significance, scanning parameters represented by kV, mA and GRT were correlated with image quality represented by image noise, SNR, and CNR for each subgroup. Stepwise regression analysis was used to establish the contribution of the variations of the scan parameters on radiation dose descriptors (CTDIvol, DLP and E) across each subgroup with level of significance set at p-value <0.05.
Results
Effects of variations of scan parameters on the image quality of brain CT.
Group I (control), the mean and SD for both scan parameters and image quality parameters are; Scan parameters (mA: 170±0.0, KV: 140±0.0 and GRT: 2.0±0.0 seconds) and image parameters: (CNR: 2.896±0.617, SNR: 8.440±1.267, image noise: 3.658±0.428).
Group II, mean, SD and range for scan and image quality parameters are; Scan parameters (mA: 160±0.0, Kv: 120±0.0 and GRT: 1.0±0.0) and image quality parameters (CNR: 1.973±0.403, SNR: 5.781±0.653, image noise: 5.9035±0.593). Group III: Scan parameters (mA: 150±0.0, Kv: 100±0.0 and GRT: 0.8±0.0 seconds and image parameters (CNR: 1.143±0.149, SNR: 4.510±0.239, image noise: 9.267±0.478) [Table/Fig-1].
Descriptive Statistics of Scan Parameters of the Specific Groups (I, II and III).
| Group parameters (N=50) | Range | Minimum | Maximum | Mean | Std. Deviation |
|---|
| Group I | mA | 0 | 170.0 | 170.0 | 170.000 | 0 |
| kV | 0 | 140.0 | 140.0 | 140.000 | 0 |
| CNR | 3.42 | .83 | 4.25 | 2.8961 | 0.61687 |
| Image noise (SD) | 2.03 | 2.89 | 4.92 | 3.6584 | 0.42762 |
| CTDI (mGy) | 97.57 | 10.02 | 107.59 | 100.7632 | 12.34591 |
| DLP (mGycm) | 610.14 | 1532.38 | 2142.52 | 1905.1812 | 102.13067 |
| SNR | 5.46 | 5.32 | 10.78 | 8.4395 | 1.26656 |
| Gantry rotation time (s) | 0 | 2.0 | 2.0 | 2.000 | 0 |
| Effective dose (mSv) | 1 | 3 | 4 | 4.00 | 0.215 |
| Group II | mA | 0 | 160.0 | 160.0 | 160.000 | 0 |
| kV | 0 | 120.0 | 120.0 | 120.000 | 0 |
| CNR | 1.45 | 1.28 | 2.73 | 1.9733 | 0.40324 |
| Image noise (SD) | 2.35 | 5.09 | 7.44 | 5.9035 | 0.59257 |
| CTDI (mGy) | 0 | 31.81 | 31.81 | 31.8100 | 0 |
| DLP (mGycm) | 59904.18 | 540.82 | 60445.00 | 1646.4712 | 7927.15802 |
| SNR | 2.71 | 4.45 | 7.16 | 5.7811 | 0.65256 |
| Gantry rotation time (s) | 0 | 1.0 | 1.0 | 1.000 | 0 |
| Effective dose (mSv) | 0 | 1 | 1 | 1.25 | 0.046 |
| Group III | mA | 0 | 150.0 | 150.0 | 150.000 | 0 |
| kV | 0 | 100.0 | 100.0 | 100.000 | 0 |
| CNR | 0.83 | 0.73 | 1.56 | 1.1428 | 0.14927 |
| Image noise (SD) | 1.95 | 8.28 | 10.23 | 9.2667 | 0.47750 |
| CTDI (mGy) | 2.58 | 15.67 | 18.25 | 15.7605 | 0.47894 |
| DLP (mGycm) | 33.61 | 282.06 | 315.67 | 285.6465 | 9.69139 |
| SNR | 1.03 | 4.01 | 5.04 | 4.5104 | 0.23912 |
| Gantry rotation time (s) | 0 | 0.8 | 0.8 | 0.800 | 0 |
| Effective dose (mSv) | 0 | 1 | 1 | 0.59 | 0.011 |
N: Number of participants in each group, CNR: Contrast to noise ratio, CTDI: Computed tomography dose index, DLP: Dose length product, mA: Miliampere, SNR: Signal to noise ratio
The correlation coefficients (r) and significance (p-values) of the image quality parameters in each subgroups with varied scan parameters where evaluated and the results revealed the following: Groups I (control): (CNR: r=0.857, p-value <0.001; Image noise: r=0.206, p-value=0.125, and SNR: r=0.875, p-value <0.001), (CNR: r=0.857, p-value <0.001; Image noise: r=0.211, p-value=0.115 and Image noise: r=-0.164, p-value=0.124 and SNR: r=0.880, p-value <0.001) for mA, kV and GRT respectively.
Group II (CNR: r=0.744, p-value <0.001, Image noise: r=0.521, p-value=0.024, and SNR: r=0.765, p-value <0.001), (CNR=r=0.761, p-value <0.001, Image noise: r=0.241, p-value=0.011 and SNR: r=0.780, p-value=0.024) for mA, kV and GRT, respectively.
Group III (CNR: r=0.684, p-value=0.032; Image noise: r=0.646, p-value=0.032 and SNR: r=0.682, p-value=0.001) for mA and GRT, respectively [Table/Fig-2].
Correlation of scan parameters with image parameters.
| Scan parameters | Image parameters |
|---|
| CNR | Image noise | SNR |
|---|
| r | p-value | r | p-value | r | p-value |
|---|
| Group I |
| mA | 0.8577 | <0.001 | 0.206 | 0.125 | 0.875 | <0.001 |
| kV | 0.857 | <0.001 | 0.211 | 0.115 | 0.875 | <0.001 |
| Gantry rotation time (s) | 0.809 | <0.001 | -0.164 | 0.124 | 0.880 | <0.001 |
| Group II |
| mA | 0.744 | <0.001 | 0.521 | 0.024 | 0.765 | <0.001 |
| kV | 0.744 | <0.001 | 0.421 | 0.114 | 0.765 | <0.001 |
| Gantry rotation time (s) | 0.761 | <0.001 | 0.241 | 0.011 | 0.780 | 0.024 |
| Group III |
| mA | 0.684 | 0.032 | 0.646 | 0.032 | 0.654 | <0.001 |
| kV | 0.684 | 0.002 | 0.482 | 0.141 | 0.676 | 0.003 |
| Gantry rotation time (s) | 0.682 | 0.001 | 0.346 | 0.021 | 0.681 | <0.001 |
Statistical tool: Pearson’s correlation test, r: Coefficient of correlation, SNR: Signal to noise ratio, CNR: Contrast to noise ratio
The extent of dose variation with relation to varied scan parameters:
A stepwise regression analysis was conducted to establish the contribution of variations of mA, kV and GRT on radiation dose descriptors CTDI Vol, DLP and E across each subgroup. In group I, the results showed that mA and GRT had great influence on radiation dose descriptors CTDI Vol DLP and E across each subgroup. In group I, the results showed that mA, and GRT greatly contributed towards changes in CTDI, Vol (mA: r2=0.741, GRT: r2=0.724), DLP (mA: r2=0.701, GRT: r2=0.712) and E (mA: r2=0.735, GRT=r2=0.787) [Table/Fig-3]. In group II, the results revealed that mA and GRT contributed significantly towards changes in CTDIVol (mA: r2=0, 0.521, GRT: r2=0.566), DLP (mA: r2=0.534) and E (mA: r2=0.554, GRT: r2=583) [Table/Fig-3]. The results of group III also showed that mA and GRT greatly contributed to the Changes in CTD1Vol (mA: r2=0.434, GRT: r2=0.389), DLP: (mA: r2=0.402, GRT: r2=0.378) [Table/Fig-3]. There was a statistically significant relationship between scan parameters and radiation does parameters across all the sub groups at (p-value ≤0.05) [Table/Fig-3].
The relationship between scan parameters and dose descriptors.
| Parameters | E | CTDI | DLP |
|---|
| R | r2 | p-value | B | R | r2 | p-value | B | R | r2 | p-value | B |
|---|
| Group I |
| mA | 0.857 | 0.735 | <0.001 | 0.434 | 0.832 | 0.741 | <0.001 | 0.441 | 0.814 | 0.701 | <0.001 | 0.452 |
| kV | 0.773 | 0.598 | <0.001 | 3.30 | 0.768 | 0.565 | <0.001 | 3.10 | 0.694 | 0.548 | <0.001 | 3.24 |
| GRT | 0.888 | 0.789 | <0.001 | 0.853 | 0.876 | 0.724 | <0.001 | 0.832 | 0.841 | 0.712 | <0.001 | 0.821 |
| Group II |
| mA | 0.744 | 0.554 | <0.001 | 0.541 | 0.722 | 0.521 | <0.001 | 0.524 | 0.718 | 0.516 | 0.002 | 0.522 |
| kV | 0.642 | 0.421 | 0.001 | 0.464 | 0.621 | 0.386 | 0.002 | 0.435 | 0.619 | 0.383 | <0.001 | 0.421 |
| GRT | 0.765 | 0.585 | 0.021 | 0.821 | 0.752 | 0.566 | 0.0312 | 0.802 | 0.731 | 0.534 | 0.045 | 0.818 |
| Group III |
| mA | 0.689 | 0.475 | 0.032 | 0.521 | 0.659 | 0.434 | <0.001 | 0.487 | 0.634 | 0.402 | <0.001 | 0.465 |
| kV | 0.576 | 0.332 | <0.001 | 0.492 | 0.551 | 0.304 | 0.001 | 0.464 | 0.542 | 0.294 | 0.023 | 0.453 |
| GRT | 0.642 | 0.412 | 0.001 | 0.746 | 0.6241 | 0.389 | 0.024 | 0.723 | 0.615 | 0.378 | 0.034 | 0.713 |
Statistical tool: Stepwise regression analysis; B: Beta; R: Coefficient of determination; E: Effective dose; CTDI: Computed tomography dose index; DLP: Dose length product
Discussion
The CT has the capacity to provide high-quality images for diagnostic investigation and visualisation to guide therapeutic procedures. During CT investigations, the radiation dose to the patients is usually very high when compared to conventional radiography. Both the image parameters depend on and are controlled by specific image scan parameters selected for each patient of a define protocol. The protocol is made up of a complex combination of numerous adjustable imaging parameters for each investigation. The aim for each imaging procedure is to adjust the image features to provide the required visualisation of anatomic structures, and sign of pathology and limit the radiation dose to no more than the required to produce the necessary image quality.
An underlying principle of all X-ray imaging and especially CT, is that we “pay for” Image quality with radiation dose. An optimised imaging protocol is one, in which the factors are adjusted to provide the necessary image quality and visualisation balanced against the radiation dose. In this study, the results revealed that there were significant mean differences of all the image quality parameters between group I (control) and the experimental group (Group II and Group III) as the scan parameters (mA, kV and GRT) reduces.
There were lower mean values of CNR and SNR in the experimental groups when compared to the control group, while there were higher mean values of image noise in the experimental groups than the control group. This means that reduction in the scan parameters (mA, kV and GRT) have significant reduction effects on the image quality, especially on the CNR and SNR.
There were strong positive statistically significant correlations between the scan parameters and the image quality parameters across the various subgroups, while weak negative statistically significant correlation was observed between the scan parameter (GRT) and the image noise in group I. This means that alteration in the scan parameters has a great effect on the image quality of the CT brain. An increase in the mA value, increases the radiation dose to the participants but decreases the image noise, while reduction in the GRT resulted to increased image noise with reduction in radiation dose to the patients. Reduction in mA, GRT and kV increases image noise, thereby reducing the SNR and CNR of the images. These findings are in agreement of the findings of the studies conducted by Hanan E et al., Saeed RS et al., and Kun T et al., [10,15,16]. In Saeed RS et al., study, which was conducted to evaluate the effect of mA reduction on image quality parameters and patient’s dose in CT imaging, showed that there were significant differences in the CNR of all the types of tissue equivalent inserts (quality assurance phantom) (p-value <0.011) and image noise (p-value <0.001) wherever the mA was changed in their study, however, changes in the mA did not produce significant difference in the spatial resolution of the image (p-value >0.05) [15].
In Saeed RS et al., study, only mA was altered while in this study, mA, kV and GRT were altered across each subgroup [15]. Similarly, Hanan E et al., study, conducted to assess the effect of diagnostic parameters (kV, mAs, slice thickness and pitch) and their effects on image quality as well as the radiation doses received from CT scanners using phantom, reported that there was linear correlation between diagnostic parameters and image noise [8]. In their study, reduction in mAs and kV increases image noise, thereby reducing the SNR and CNR of the images. According to Hanan E et al., increasing of the pitch led to an increase in the image noise, whereas increasing the slice thickness, reduced the image noise [8].
In Kun T et al., study, which was conducted to determine the effect of low tube voltage (80 kv) on Image quality, radiation, and Low Contrast Detectability (LCD) at abdominal CT, reported that there was increased image noise at low kV when compared to higher kV values [16]. The slight discrepancies in our findings could be ascribed to the different natures of various studies. In Kun T et al., study, abdominal CT was evaluated, while in this present study, CT brain was investigated [16].
The extent of radiation dose variations in relation to varying of the scan parameters was assessed and the results revealed that mA and GRT contributed greatly to the radiation dose effects shown by the values of CTDvol, DLP and E. When comparing the radiation dose parameters values in the subgroup II and III with group I (control) the result showed that reduction in the scan parameters led to significant reduction in the radiation dose to the patients between group I, there was a reduction of 22% of CTDIvol value, 18.5% of DLP (group I-group II) and 15.2% of effective dose, while between group I and group III, there was reduction of 30.7% of CTDIvol value, 34.1% of DLP and 36.5% reduction in the effective dose. This means any reduction in the scan parameters, especially the mA and GRT, greatly reduces the radiation dose received by the patients. This result also showed that there were statistically significant correlations between scan parameters and the radiation dose descriptors. These findings are in keeping with the findings of the studies conducted by Hanan E et al., Saeed RS et al., Kun T et al., Dalmazo J et al., and Lee SW et al., Eddy FK et al., Irsal M et al., and Arrêté du [10,15-21]. Saeed SW et al., study, reported a 25% reduction in radiation dose following reduction in the mA [15].
In Dalmazo J et al., study, which was conducted to determine the feasibility of reducing radiation dose in protocols for acquisition of helical CT images in a University Hospital, reported a 3.8% reduction in dose for paediatric skull and 25% for adult skull, 9.6% (paediatric) and 34.3% (adult) for abdomen, 6.4% (paediatric) and 12% (adult) for chest [17]. They concluded that dose levels can be reduced by up to 34.4% in comparison with routine protocols, keeping the noise at acceptable levels. Hanan E et al., reported that there was linear relationship with dose [8]. This means increased kV, increases the radiation dose received and vice-verse. According to Hanan E et al., increased kV, led to an increase radiation dose by 92% and reduction in the image noise by 83% [8]. Also, increasing mAs values, led to an increase in radiation dose by 49% and a reduction in the image noise by 46% in a phantom compared with an increase in radiation dose by 82% and a reduction in the image noise by 51%. Lee SW et al., study, which was carried out to determine the dose reduction and image quality in paediatric MDCT, reported that the radiation dose increased as a function of the phantom diameter [18].
According to Lee SW et al., increasing tube voltage from 80 to 140 kVp, there were 395.08% and 448.27% increases in radiation dose for 10 cm and 32 cm PAMA phantoms, respectively [18]. In Kun T et al., study, they reported that with a reduction of the tube voltage from 120 kVp to 80 kv at abdominal CT, the radiation dose can be reduced by 21% to 42% without degradation of CNR and LCD [16]. According to Eddy FK et al., study, which was conducted in Cameroon to evaluate the radiation dose of paediatric patients in CT brain examination, reported a positive correlation between kVp and CTDIVol, meaning that an increased in the value of kVp resulted to increase in the CTDIVol [19]. The study carried out by Irsal M et al., in Indonesia, found a that ionising radiation dose exposure value of CT scans was correlated with kVp, mAs, tube rotation time and slice thickness [20]. Also, Arrêté du, noted that decreasing the tube potential (kVp) and tube current (mV) values and increasing the tube rotation time leads to reduction in radiation dose [21]. This implies that any changes made in the scan parameters, also affects the radiation dose received by the image and in turn, the image quality.
Limitation(s)
Firstly due to equipment downtime, more data could not be obtained to increase the sample size for better representation. This limitation may have affected findings to some extent. Secondly, this study was performed using an 8-section multi-detector slice CT scanner and the results found may be relevant/ applicable to only similar scanners. The researcher believes that this may have an effect on the overall image quality outcome and dose when higher detector scanners are used. Thirdly, the GE Healthcare technology scanner was used for this study. The researcher believes that if scanners from different manufactures are used to carry out the study, and the results compared, it could give a better outcome.
Conclusion(s)
This study revealed that alteration in the scan parameters has a significant effect on the image quality of CT brain; reduction in the scan parameters (mA, kVp and GRT) has a corresponding reduction effects on the image quality, especially on CNR and SNR. There were statistically significant correlations between scan parameters and the radiation dose descriptors. An increased in mA, kVp and gantry ration time also increases the radiation dose to the image but with decrease image noise. Radiation dose varies in relation to variation in scan parameters. In optimisation of CT imaging parameters, a balance needs to be made between the image quality and the radiation dose that is beneficial to the patient, especially those undergoing CT brain.
N: Number of participants in each group, CNR: Contrast to noise ratio, CTDI: Computed tomography dose index, DLP: Dose length product, mA: Miliampere, SNR: Signal to noise ratio
Statistical tool: Pearson’s correlation test, r: Coefficient of correlation, SNR: Signal to noise ratio, CNR: Contrast to noise ratio
Statistical tool: Stepwise regression analysis; B: Beta; R: Coefficient of determination; E: Effective dose; CTDI: Computed tomography dose index; DLP: Dose length product