Diabetes Mellitus (DM) is a chronic metabolic disorder characterised by hyperglycaemia with risk of micro and macrovascular complications. DM is a major health problem globally and is one of the leading causes of death in the world. DM is a “Silent Killer,” and involves multiple organ systems. It causes death from Coronary Artery Disease (CAD), Cerebrovascular Accident (CVA), End Stage Renal Disease (ESRD). The morbidity and mortality associated with DM are primarily due to acute and chronic complications. Cardiovascular system is the worst affected organ system in DM with increased incidence of angina pectoris, myocardial infarction and congestive heart failure. Cardiovascular disease is the leading cause of death in individuals with DM [1].
Studies have found that DM leads to LV diastolic dysfunction, contributing importantly to heart failure with normal systolic function [2]. Renal involvement in diabetes can range from asymptomatic state to ESRD and from MAU to nephrotic range proteinuria. Albuminuria has been considered as marker of nephropathy and MAU as predictor of diabetic nephropathy is well established. At the same time albuminuria has been shown to predict cardiovascular morbidity and mortality in individuals with both Type 1 and Type 2 DM, MAU leads to onset of premature cardiovascular disease. Various studies have shown MAU is a marker of microvascular damage in the heart and kidney and is a predictor of cardiovascular dysfunction in the same way as of nephropathy [3,4-6]. So early detection MAU in diabetes patients and its treatment will reduce cardiovascular morbidity and mortality. Most of these studies have correlated LV dysfunction with presence or absence of MAU. But in this study, the authors have evaluated the correlation of degree of MAU in patients of Type2DM with LV systolic and diastolic dysfunction.
Materials and Methods
This cohort study was conducted on 251 patients attending Medicine OPD or Indoor admissions at Srirama Chandra Bhanja (SCB) Medical College and Hospital, Cuttack, Odisha, India with clinical diagnosis of Type2DM. The established cases of Type2DM who were under treatment and follow-up were directly included in the study. Sampling technique used was simple random sampling. The study started after clearance from Departmental Research Committee and Instituitional Ethical Committee. (IEC application No. 239 dated 26.08.2020).
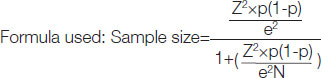
Sample size calculation: Proportion or mean considered at confidence level (%) of 95%. Population size from which the sample was taken is 610. Expected proportion (decimal) is 0.5 and margin of error is 5%. The final sample size calculated was equal to 251.
Population of the study=610
Duration of the study=one year
Inclusion criteria: Patients attending the OPD with Type 2 DM according to the diagnosis criteria laid down by ADA [7] were included in the study.
Exclusion criteria: Patients with severe hypertension, IHD, UTI, valvular heart disease, CKD and proteinuria more than 300 mg/24 hour were excluded from the study.
Micral Test
Microalbuminuria was assessed by micral test using a semi-quantitative dipstick method manufactured by Bochringer Mannheim Ltd. There were three colour blocks on the colour scale corresponding to 20 mg/L, 50 mg/L and 100 mg/L of albumin, respectively. Albumin content of single-void sample (preferably first morning) in a range of 20-200 mg/L corresponds to albumin excretion rate of 30-300 mg/24 hour. So the samples which came out to be positive in 20-200 mg/L, were considered positive for MAU.
Echocardiography
Echocardiograms were conducted in the Cardiology Department, SCB medical college and Hospital, Cuttcak, India with a ultrasound system (HD1 1500 ultrasound System). Imaging modes like Dual 2D real time, 213/M-mode, colour doppler, pulsed wave doppler, continuous wave Doppler were used. Criteria of American Society of Echocardiography were used for assessing LV systolic dysfunction and Mayo Clinic criteria were used for detecting the LV diastolic dysfunction. Parameters like Isovolumic Relaxation Time (IVRT), LV EF, Deceleration Time (DT), Fractional Shortening (FS), Cardiac Output (CO), E/A velocity ratio, LV Internal Diameter Systolic (LVIDS), LV Internal Diameter Diastolic (LVIDD), and E Point Septal Separation (EPSS) were calculated.
All the enrolled patients were subjected to detailed history taking and clinical examination. Routine laboratory tests including Renal Function Tests (RFT), Liver Function Tests (LFT), Echocardiogram (ECG), ultrasonography of abdomen were done. Prior written consent was taken from all the participants.
Statistical Analysis
The recorded and calculated values of all the parameters in the study group were statistically analysed. Linear regression method was used to find out the correlation among variables. The significance between different groups and means were calculated by students’ Unpaired t-test and p-values were ascertained with respective degree of freedom. Tests used were Unpaired t-test for normal data, Chi-square test for dichotomous data and values were correlated using Pearson’s correlation coefficient. The result was accepted to be statistically significant, when p-value was <0.05. Statistical Package for the Social Sciences (SPSS) software version 22 was used for statistical analysis.
Results
Out of selected 251 patients, 148 were males and 103 were females with male to female ratio of 1.43:1. After conducting micral test 62 (24.7%) came out positive who were called as study group. Out of 62 positive cases, males constitute 39 (26.4% of total males) and females were 23 (22.3% of total females) and there was no statistical significant difference in prevalence of microalbuminuria was observed among males and females [Table/Fig-1] (p=0.526).
Gender distribution of micral test result (n=251).
| Result of micral test | Male | Female | Total |
|---|
| N | % | N | % | N | % |
|---|
| Positive | 39 | 26.4 | 23 | 22.3 | 62 | 24.7 |
| Negative | 109 | 73.6 | 80 | 77.7 | 189 | 75.3 |
| Total | 148 | 100 | 103 | 100 | 251 | 100 |
All the demographic, clinical and laboratory parameters of the study group were depicted in [Table/Fig-2]. The mean age of the study population was 53.7 years with range from 46 to 66 years. Mean duration of diabetes was 14.5 years. The Body Mass Index (BMI) in the study group ranges from 21.05 to 36.89 (mean=27.17). The mean values of the serum lipid profile were cholesterol are 217 mg/dL, Triglyceride (TG) was 188 mg/dL, High-density Lipoprotein (HDL) was 29.4 mg/dL, Very Low-density Lipoprotein (VLDL) was 60 mg/dL and Low-density Lipoprotein (LDL) 159 mg/dL), which shows an atherogenic lipid profile in the study group.
Clinical and laboratory parameters in the study group (n=62).
| Parameters | Age (Years) | BMI (kg/m2) | Duration of diabetes (Years) | HR (beats/min) | SBP (mmHg) | DBP (mmHg) | Chol. (mg/dL) | TG (mg/dL) | HDL (mg/dL) | VLDL (mg/dL) | LDL (mg/dL) | FBS (mg/dL) | HbA1c |
|---|
| Minimum | 46 | 21.05 | 9 | 64 | 100 | 74 | 165 | 160 | 26 | 50 | 140 | 96 | 5.1 |
| Maximum | 66 | 36.89 | 18 | 90 | 120 | 80 | 257 | 204 | 36 | 70 | 176 | 158 | 8.6 |
| Range | 21 | 15.84 | 9 | 86 | 20 | 6 | 92 | 44 | 10 | 20 | 36 | 62 | 3.5 |
| Mean | 53.7 | 27.17 | 14.5 | 77 | 112 | 78.2 | 217 | 188 | 29.4 | 60 | 159 | 128 | 6.44 |
| Standard deviation | 5.32 | 2.97 | 2.92 | 6.52 | 5.97 | 1.79 | 24.6 | 8.47 | 3.41 | 5.43 | 7.1 | 14.5 | 0.86 |
BMI: Body mass index; HR: Heart rate; SBP: Systolic blood pressure; DBP: Diastolic blood pressure; Chol.:Cholesterol; TG: Triglycerides; HDL: High-density lipoprotein; VLDL: Very low-density lipoprotein; LDL: Low-density lipoprotein; FBS: Fasting blood sugar; HbA1c: Glycated haemoglobin
As depicted in [Table/Fig-3], the mean IVRT, DT, A/E and EPSS were more than normal in the study group whereas the mean EF, FS and CO were in the normal range. Nearly 48 (77.4%) patients of the study group were seen to have LV dysfunction, among which 29 (46.8%) cases have diastolic dysfunction, 12 (19.4%) cases have systolic dysfunction and 7 (11.2%) cases have both [Table/Fig-4]. So diastolic dysfunction was found in 58.1% cases.
Echocardiographic parameters in the study group.
| Parameters | LVIDD | LVIDS | EF% | FS (%) | CO (L) | EPSS (mm) | IVRT (ms) | DT (ms) | A-wave | E-wave | A/E |
|---|
| Minimum | 46.1 | 20.2 | 38 | 31.2 | 3.6 | 4.6 | 94 | 210 | 42 | 51 | 0.72 |
| Maximum | 52.4 | 36.3 | 70 | 62.5 | 4.8 | 12.5 | 124 | 259 | 92 | 90 | 1.2 |
| Range | 6.3 | 16.1 | 32 | 31.3 | 2.2 | 7.9 | 30 | 49 | 52 | 39 | 0.48 |
| Mean | 49.4 | 30.7 | 55.1 | 39.1 | 3.7 | 7.2 | 111 | 242 | 60.5 | 57.3 | 1 |
| Standard deviation | 2.12 | 2.41 | 8.91 | 4.94 | 0.59 | 2.25 | 9.25 | 12 | 11.5 | 6.82 | 0.16 |
LVIDD: Left ventricular internal diameter diastolic; LVIDS: Left ventricular internal diameter systolic; EF: Ejection fraction; FS: Fractional shortening; CO: Cardiac output; EPSS: E Point septal separation; IVRT: Isovolumic relaxation time; DT: Deceleration time; A/E: A-wave/E-wave
Distribution of study group according to LV function (n=62).
| LV function | Number of cases | % |
|---|
| Diastolic dysfunction | 29 | 46.8 |
| Systolic dysfunction | 12 | 19.4 |
| Global dysfunction | 07 | 11.2 |
| No dysfunction | 14 | 22.6 |
| Total | 62 | 100 |
[Table/Fig-5] shows with increased level of MAU, the incidence of LVDD and LVSD also increased. All patients with MAU >150 mg/L have either systolic dysfunction or global dysfunction. Number of LV global dysfunction cases has increased from 0 in 20 mg/L range group to maximum of 42.8% in 150 mg/L group. [Table/Fig-6] which depicts severity of MAU with parameters of LV systolic function shows that the mean values of EF, FS, and CO were decreasing and EPSS increasing with increasing severity of MAU. There was negative correlation of severity of MAU with EF, FS, CO and positive correlation with EPSS. Similarly [Table/Fig-7] which depicts severity of MAU with parameters of LV diastolic function shows that the mean values of IVRT, DT and A/E ratio increasing with increasing severity of MAU and this was positively correlated with severity of MAU with significant p-values.
Distribution of LV dysfunction according to level of microalbuminuria (MAU).
| Range of MAU (mg/L) | LVDD (n=29) | LVSD (n=12) | LVGD (n=7) | No LV dysfunction (n=14) | Total |
|---|
| n | % | n | % | n | % | n | % | n | % |
|---|
| 20 (n=11) | 6 | 20.7 | - | - | - | - | 5 | 35.7 | 11 | 17.7 |
| 50 (n=25) | 11 | 37.9 | 4 | 33.3 | 2 | 28.6 | 8 | 57.2 | 25 | 40.3 |
| 100 (n=19) | 12 | 41.4 | 4 | 33.3 | 2 | 28.6 | 1 | 7.1 | 19 | 30.7 |
| 150 (n=7) | - | - | 4 | 33.4 | 3 | 42.8 | - | - | 7 | 11.3 |
| Total | 29 | 100 | 12 | 100 | 7 | 100 | 14 | 100 | 62 | 100 |
LVDD: Left Ventricular diastolic dysfunction; LVSD: Left ventricular systolic dysfunction; LVGD: Left Ventricular global dysfunction; LV: Left Venticular
Severity of Microalbuminuria (MAU) with parameters of LV systolic function and correlation.
| Severity of MAU (mg/L) | EF (Mean±SD) | FS (Mean±SD) | EPSS (Mean±SD) | CO (Mean±SD) |
|---|
| 20 | 61.12±5.11 | 41.39±2.36 | 5.95±1.21 | 4.11±0.27 |
| 50 | 55.7±8.86 | 39.8±6.64 | 7.59±2.47 | 3.81±0.56 |
| 100 | 53.00±8.43 | 38.2±4.03 | 7.21±1.92 | 3.66±0.67 |
| 150 | 43.00±2.16 | 33.91±1.2 | 9.5±2.06 | 3.11±0.49 |
| Correlation of severity of MAU with parameters of LV systolic function |
| r-value | -0.563 | -0.438 | 0.364 | -0.471 |
| p-value | <0.001 | <0.001 | <0.01 | <0.001 |
| Degree of freedom | 60 | 60 | 60 | 60 |
EF: Ejection fraction; FS: Fractional shortening; EPSS: E Point septal separation; CO: Cardiac output; SD: Standard deviation; p-value <0.05 considered significant
Severity of Microalbuminuria (MAU) with parameters of LV diastolic function and correlation.
| Severity of MAU (mg/L) | IVRT (Mean±SD) | DT (Mean±SD) | A/E (Mean±SD) |
|---|
| 20 | 108±9.9 | 232±11.58 | 0.94±0.16 |
| 50 | 112.3±9.64 | 242±7.25 | 1.04±0.16 |
| 100 | 114.34±8.18 | 250±7.4 | 1.05±0.15 |
| 150 | 116.43±7.0 | 241±12.24 | 0.89±0.17 |
| Correlation of severity of MAU with parameters of LV diastolic function |
| r-value | 0.287 | 0.396 | 0.247 |
| p-value | <0.01 | <0.01 | <0.01 |
| Degree of freedom | 60 | 30 | 60 |
IVRT: Isovolumic relaxation time; DT: Deceleration time; A/E: A-wave/E-wave; SD: Standard deviation; p-value <0.05 considered significant
[Table/Fig-8] which depicts the values of parameters of diastolic dysfunction with the duration of diabetes. The mean values of IVRT, DT and A/E ratio were increasing with increasing duration of disease. Out of them IVRT and DT was positively correlated with significant p-value. [Table/Fig-9] depicts the parameters of LVSD with the duration of DM, which shows that the mean values of EF, FS, CO was decreasing and EPSS increasing with the duration of DM. There was negative correlation of these parameters with the duration, out of which EF and FS correlation was statistically significant.
Duration of diabetes with parameters of LV diastolic function and correlation.
| Duration of diabetes (years) | IVRT (Mean±SD) | DT (Mean±SD) | A/E (Mean±SD) |
|---|
| 09-12 | 104.79±9.09 | 232.63±12.55 | 0.91±0.14 |
| 13-16 | 115.79±8.03 | 245.15±13.04 | 1.04±0.15 |
| >16 | 115.08±6.99 | 245.73±5.25 | 1.03±0.16 |
| Correlation of duration of diabetes with parameters of LV diasotolic function |
| r-value | 0.522 | 0.547 | 0.125 |
| p-value | <0.001 | <0.01 | >0.05 |
| Degree of freedom | 60 | 60 | 60 |
IVRT: Isovolumic relaxation time; DT: Deceleration time; A/E: A-wave/E-wave; SD: Standard deviation; p-value <0.05 considered significant
Discussion
After the exclusion criteria, 251 cases of Type2DM were screened for MAU. Out of which 62 came out to be positive. [Table/Fig-1] shows the result of micral test and shows the prevalence of MAU to be 24.7%. This is in accordance with observations in many other studies. Gupta OK et al., in a cross-sectional study in North India including 102 DM patients (64 Type2DM and 38 Type1DM) concluded the prevalence of MAU to be 26% in Type2DM cases [8]. According to Alzaid AA, the prevalence MAU in Type2DM cases ranges from 7.6% to 42% in different population [9]. Raman PG et al., in their case control study including 110 cases of DM (90 Type2DM and 20 Type1DM) and 25 age and sex matched healthy controls, have observed the prevalence of MAU to be 25% in DM cases where as none of the controls had MAU [10]. In the Strong heart study the prevalence of MAU in Type2DM cases ranged from 28.3% in Arizona Indians to 13.8% in Dakota Indians [11]. Lamba IMS et al., in their study noted the prevalence of MAU to be 33.93% [12]. This wide variation in the prevalence is possible. Because several factors likely to operate towards the development of MAU and different workers have followed different test methods for detection of MAU.
[Table/Fig-2] shows the clinical and laboratory parameters of the study group. It shows the mean age of MAU to be 53.7±5.32 years. In the Strong heart study which included 581 patients with MAU, the mean age was 61±8 years [11]. Lamba IMS et al., in their study including 56 Non Insulin Dependent Diabetes Mellitus (NIDDM) subjects aged 41 to 74 years observed the mean age of MAU to be 58.37±8.16 years, which was higher than normal albuminuric patients (52.87±5.92 years) [12]. In this study, the mean age of MAU was 53.7±5.32 years. This variation in the mean age of MAU may be explained by contribution from other factors like different age at diagnosis, difference in glycaemic control status and other contributing factors. Raman PG et al., have reported a mean duration of 15.5±4.4 years in microalbuminuric subjects in their study [6]. A mean duration of 12.57 years was noted in the microalbuminuric Type2DM cases in comparison to 4.5±2.9 years (p<0.001) in normoalbuminuric cases, in a case control study by Lamba IMS et al., [12]. The mean duration of diabetes in the microalbuminuric patients in the Strong heart study was observed to be 11.3±90 years [11]. In the present study, as shown in [Table/Fig-2] the mean duration of diabetes was 14.5±2.92 years without having any sex difference which is consistent with the above studies.
Many studies have not found a significance of BMI between normoalbuminuric and microalbuminuric patients. Lamba IMS et al., have noted BMI of 24±3.19 in microalbuminuric patients as compared to 23.71±2.77 in normoalbuminuric patients [12]. In Strong heart study, BMI in normoalbuminuric, microalbuminuric and macroalbuminuric patients were observed to be 33±6, 32±2, and 32±6 years, respectively [10]. In this study, the BMI in microalbuminuric cases was observed to be 27.17±2.97 as shown in [Table/Fig-2]. This wide variation of BMI in different studies and absence of significant difference of BMI in normoalbuminuric and microalbuminuric groups shows that BMI has no significant relation with MAU.
[Table/Fig-2] also shows the lipid profile of the study group, which shows that microalbuminuric patients are having higher cholesterol (217±24.6 mg/dL), high LDL (159±7.1 mg/dL), high Triglyceride (188±8.47 mg/dL) and low HDL (29.4±3.41 mg/dL) values. Lamba IMS et al., in their case-control study of microalbuminuric and normoalbuminuric cases also noted higher values for serum cholesterol (220±53.05), Triglyceride (176±54.6 mg/dL) and LDL (124.4±38.4 mg/dL) in microalbuminuric cases which were significantly higher than that of normoalbuminuric cases (183±26.9 mg/dL, 137.4±35.9 mg/dL, 108±40 mg/dL, respectively) [12]. But however in the Strong Heart Study no significant difference of total cholesterol, LDL and HDL was observed among normoalbuminuric, microalbuminuric and macroalbuminuric subjects. Only triglyceride was found to be significantly higher in microalbuminuric and macroalbuminuric patients [11].
[Table/Fig-3] shows the echocardiographic parameters of LV function. The mean values of IVRT, DT and A/E ratio are observed to be 111±9.25, 242±12 and 1±0.16 respectively which shows diastolic dysfunction in the study group. But EF, FS and CO were in normal range (55.1±8.91, 39.1±4.94 and 3.7±0.59, respectively) showing normal systolic function in the study group. [Table/Fig-4] also shows that LV diastolic dysfunction was more common than systolic dysfunction (diastolic dysfunction in 46.8% cases, systolic dysfunction in 19.4% cases) which is also consistent with the findings of Rao MS et al., where diastolic dysfunction and systolic dysfunction were observed in 56% and 23% cases respectively [13]. Zabalgoita M et al., in their study of 86 normotensive Type 2 DM cases observed LV diastolic dysfunction in 47% of cases [14]. Poirier P et al., and Redifield MM et al., have also noted LV diastolic dysfunction in 32% and 52% cases respectively in their study [15,16].
[Table/Fig-5] shows that LV function is deteriorating from only isolated diastolic dysfunction at 20 mg/L range to global dysfunction at 150 mg/L range. Isolated systolic dysfunction cases are maximum in 100 mg/L range. LV global dysfunction was highest (42%) in 150 mg/L range. Whereas all the cases having MAU 150 mg/L are having either systolic or global dysfunction, no isolated diastolic dysfunction case was observed in this range. This observation correlates with findings of Liu JE et al., in the Strong Heart Study which evaluated the LV systolic and diastolic function by echocardiography in 1576 Type2DM patients [11]. They have observed a step wise deterioration of LV diastolic and systolic function from non albuminuric group to macroalbuminuric group and have concluded that MAU is independently associated, with worse systolic and diastolic dysfunction. Rutter MK et al., in their case control study involving age and sex matched 58 cases concluded that LV dysfunction was more common and more severe in those cases with MAU [17]. Guglielmi MD et al., and Hanna DB et al., also had similar observation in their study and concluded that MAU was associated with significant changes in LV morphology and more severe impairment of cardiac function [18,19]. The observation in [Table/Fig-5] was supported by the observation in [Table/Fig-6,7 and 8].
These tables show that EF, FS and CO are decreasing with increasing severity of MAU with statistically significant values (<0.01, <0.001, <0.001, respectively). Similarly, EPSS, IVRT, DT, A/E ratio linearly increasing with severity MAU with p-values < 0.01, <0.001, <0.001, and <0.001, respectively. Loss of heparin sulfate proteoglycan from the plasma membrane of endothelial cells, which is having antithrombotic property leads to formation of microthrombi and occlusion of small vessels of heart. Small vessel disease can lead to subendocardial ischaemia causing systolic and diastolic myocardial dysfunction.
[Table/Fig-8,9] shows the correlation of duration of diabetes with LV function. A linear correlation of duration of diabetes to all parameters of systolic and diastolic function was observed with significant p-values except CO, EPSS and A/E ratio. The p-value of <0.01, <0.01, <0.001 and <0.01 was noted for EF, FS, IVRT and DT, respectively. This is in accordance with the observation of Kanwar BS et al., Lamba IMS et al., and Rao MS et al., [4,12,13].
Duration of diabetes with parameters of LV systolic function and correlation.
| Duration of diabetes (years) | EF (Mean±SD) | FS (Mean±SD) | EPSS (Mean±SD) | CO (Mean±SD) |
|---|
| 09-12 | 59.00±7.97 | 41.24±6.23 | 6.69±1.76 | 3.92±0.54 |
| 13-16 | 52.4±9.51 | 37.8±4.14 | 7.6±2.75 | 3.59±0.62 |
| >16 | 52.1±8.38 | 37.4±3.91 | 7.9±2.18 | 3.48±0.61 |
| Correlation of duration of diabetes with parameters of LV systolic function |
| r-value | -0.28 | -0.239 | -0.141 | -0.171 |
| p-value | <0.01 | <0.01 | >0.05 | >0.05 |
| Degree of freedom | 60 | 60 | 60 | 60 |
EF: Ejection fraction; FS: Fractional shortening; EPSS: E point septal separation; CO: Cardiac output; SD: Standard deviation; p-value <0.05 considered significant
Limitation(s)
The present study was an observational study which was non blinded with a small study group. A larger blinded randomised cohort is needed for a better conclusion. Presence of silent Coronary Artery Disease (CAD) was not excluded in the study. Routine angiography was also not performed.
Conclusion(s)
All types of LV dysfunction can occur in MAU stage in Type2DM i.e., systolic dysfunction, diastolic dysfunction or global dysfunction. LV dysfunction correlates well with poor glycaemic status. LV dysfunction has significant correlation with severity of MAU and has a strong correlation with the duration of DM. So MAU can be used as a surrogate marker to predict cardiovascular disease in patients of DM.
BMI: Body mass index; HR: Heart rate; SBP: Systolic blood pressure; DBP: Diastolic blood pressure; Chol.:Cholesterol; TG: Triglycerides; HDL: High-density lipoprotein; VLDL: Very low-density lipoprotein; LDL: Low-density lipoprotein; FBS: Fasting blood sugar; HbA1c: Glycated haemoglobin
LVIDD: Left ventricular internal diameter diastolic; LVIDS: Left ventricular internal diameter systolic; EF: Ejection fraction; FS: Fractional shortening; CO: Cardiac output; EPSS: E Point septal separation; IVRT: Isovolumic relaxation time; DT: Deceleration time; A/E: A-wave/E-wave
LVDD: Left Ventricular diastolic dysfunction; LVSD: Left ventricular systolic dysfunction; LVGD: Left Ventricular global dysfunction; LV: Left Venticular
EF: Ejection fraction; FS: Fractional shortening; EPSS: E Point septal separation; CO: Cardiac output; SD: Standard deviation; p-value <0.05 considered significant
IVRT: Isovolumic relaxation time; DT: Deceleration time; A/E: A-wave/E-wave; SD: Standard deviation; p-value <0.05 considered significant
IVRT: Isovolumic relaxation time; DT: Deceleration time; A/E: A-wave/E-wave; SD: Standard deviation; p-value <0.05 considered significant
EF: Ejection fraction; FS: Fractional shortening; EPSS: E point septal separation; CO: Cardiac output; SD: Standard deviation; p-value <0.05 considered significant