Lung masses encompass a diverse range of etiologies comprising from benign (Tuberculosis, sarcoidosis, fungal infections, and inflammatory pseudotumour) to malignant (Lung cancer) in nature. The presence and knowledge about any such mass in the lung can be worrisome from the patient point of view especially if it is being diagnosed as lung carcinoma [1].
Epidemiological data of Global Cancer Data (GLOBOCAN) 2018 accounts cancers of the lung, female breast, and colorectum as the top three cancers in terms of incidence where lung cancer tops the list of mortality (1.8 million deaths, 18.4% of the total), because of the poor prognosis for this cancer worldwide [2]. In India, the data from 27 Population Based Cancer Registries (PBCRs) was analysed and the “Three-year Report of Population Based Cancer Registries 2012-2014”, was released in May 2016. The report declared that lung was the predominant site for cancer in 10 PBCRs. The number of new cases of lung cancer was projected to be 144,351 in 2020 [3].
Though the gold standard diagnosis is provided by the biopsy driven histopathology, but due to its invasive nature, the role of imaging in detection and characterisation of lung masses into benign or malignant cannot be ignored. Chest X-ray is the first imaging of investigation which provides preliminary information about the disease but the patients are subsequently imaged with CT scan for optimal characterisation and staging. Currently, various modes of CT have been used in this regard. The conventional and spiral CT [4], Positron Emission Tomography-CT [5], Multidetector CT (MDCT), and recently put to use are the DCE-CT [6].
The use of contrast based CT scan to ascertain the malignant nature of the lesion relies on the transport of intravenously administered iodinated contrast material into the possibly larger number of tissue capillaries and the increased exchange of contrast material between intravascular and extravascular interstitial space owing to an increased fenestration of the basement membrane of tumoural vessels [7]. By using the latest developments in dynamic contrast technology, perfusion parameters characterising both effects can be calculated throughout the entire tumour volume [8].
To note further, the correlation of various CT perfusion parameters with histologic markers of angiogenesis in lung cancer [9], enhances knowledge about the diagnosis, prognosis and guides the appropriate management as to promptly perform surgery in all patients with operable malignant masses and to avoid unnecessary thoracotomy in those patients with benign lesions [8-17]. Therefore, it is essential that one should be able to differentiate malignant from benign nodules in the least invasive manner and make the most specific and accurate diagnosis.
Although, a number of computed tomographic evaluations have been performed on evaluation of pulmonary nodules, only few studies have been done to characterise the lung masses into benign and malignant lesions [9,18-20]. Hence, the present study was proposed to carry out dynamic contrast enhanced perfusion CT evaluation of lung masses and to compare these findings with histopathology.
Materials and Methods
A cross-sectional observational study was conducted in the Department of Radiodiagnosis at Era’s Lucknow Medical College (tertiary care centre), Lucknow, Uttar Pradesh, India from January 2018 to November 2019. Ethical clearance for carrying out the study was obtained from the Institutional Ethical Committee (ELMC/R_Cell/EC/2018/59). An informed consent was obtained from all the patients prior to enrollment in the study.
Sample size calculation: The sample size was calculated based on the study of Ohno Y et al., who observed that sensitivity of Extraction Fraction (EF) and BV for predicting malignancy was 88% and 86% respectively and specificity was 82% and 54%, respectively [10]. Taking these values as reference, the minimum required sample size with desired precision of 20%, 90% power of study and 5% level of significance was 60 patients. To reduce margin of error, total sample size taken was 62.
Inclusion criteria: Sixty-two patients of age group 20-80 years of both sexes with clinco-radiologically suspected lung masses and no contraindications to the administration of iodinated contrast material were enrolled in the study.
Exclusion criteria: Patients who were allergic to contrast, pregnant patients, critically ill patients, those with deranged kidney function test, and those with lung pathology (other than lung masses) were excluded from the study.
After obtaining an informed consent, demographic information and nature of complaints were noted on a separate case sheet for every individual. All the patients were subjected to radiological investigations. Lung mass was evaluated and characterised into benign and malignant on Siemen’s SOMATOM Force (384 slice) after dynamic contrast enhanced perfusion study. The protocol for dynamic contrast enhanced perfusion CT as defined by Miles KA et al., was followed [11]. The procedure (CT guided needle aspiration/bronchoscopic biopsy) was decided on the basis of site of tumour.
The following CT perfusion parameters were evaluated: BF in mL/10 g/min, which represents flow rate through vasculature in tissue region; BV in mL/10 g, which indicates volume of flowing blood within a vasculature in tissue region; MTT in seconds, which indicates average time taken to travel from artery to vein; and FEP in mL/100 mL/min which indicates the passage of the dye from the intravascular into the extravascular compartment estimating the permeability [12]. Lesion was characterised according to histopathological diagnosis. Central tumour was defined as having contact to the hilum, whereas all other tumours were considered peripheral [13]. The Dynamic contrast enhanced perfusion CT thorax features of lung mass was compared with histopathology. Sensitivity, specificity, PPV, and NPV of DCE-CT to correctly diagnose the features of benign and malignant lung masses was evaluated.
Statistical Analysis
The statistical analysis was done using Statistical Package for Social Sciences (SPSS) software version 15.0. The values were represented in number (%) and mean±SD. The Chi-square test was used for comparison. To test the significance of two means, the student t-test was used. The p-value <0.05 was accepted statistically significant.
Results
Among the 62 cases of lung masses included in the study, 30 were histopathologically found to be benign lesions comprising of 13 cases of tuberculosis, 11 cases of pneumonic consolidation and six cases of hamartoma; and 32 were histopathologically found to be malignant lesions comprising of 11 cases of adenocarcinoma, six cases each of small cell carcinoma and squamous cell carcinoma, five cases of large cell carcinoma, and two cases each of sarcomatoid carcinoma and metastasis.
Compared to the benign lung masses, patients with malignant lesions had significantly higher mean age 43.93±13.54 vs. 55.94±13.34, p=0.001), with male:female ratio of 1.28:1 for malignant lesions and 1.14:1 for benign lesions (p>0.05), and comparable number of patients with cough, breathlessness, haemoptysis, weight loss, and fever (p>0.05) [Table/Fig-1].
Demographic and clinical profile of patients and its correlation with histopathological diagnosis.
| Demographic and clinical parameters | Benign masses n=30 (%) | Malignant masses n-32 (%) | Total n=62 (%) | p-value | Test Performed (*,**) |
|---|
| Age (Years) |
| 21 to 40 | 15 (50%) | 6 (18.8%) | 21 (33.9%) | 0.001 | 3.515 |
| 41 to 60 | 10 (33.3%) | 11 (34.4%) | 21 (33.9%) |
| 61 to 80 | 5 (16.7%) | 15 (46.9%) | 20 (32.3%) |
| Mean±SD | 43.93±13.54 | 55.94±13.34 | 50.13±14.64 |
| Range | 23 to 71 | 28 to 75 | 23 to 75 |
| Gender distribution |
| Male | 18 (56.25%) | 18 (56.25%) | 34 (54.8%) | 0.818 | 0.053 |
| Female | 14 (46.7%) | 14 (43.75%) | 28 (45.2%) |
| Place of residence |
| Rural | 9 (30%) | 16 (50%) | 25 (40.3%) | 0.109 | 2.574 |
| Urban | 21 (70%) | 16 (50%) | 37 (59.7%) |
| Smoking habit |
| No | 26 (86.7%) | 16 (50%) | 42 (67.7%) | 0.002 | 9.526 |
| Yes | 4 (13.3%) | 16 (50%) | 20 (32.3%) |
| Clinical profile |
| Cough | 29 (96.7%) | 26 (81.3%) | 55 (88.7%) | 0.055 | 3.67 |
| Breathlessness | 16 (53.3%) | 15 (46.9%) | 31 (50%) | 0.611 | 0.258 |
| Chest pain | 19 (63.3%) | 7 (21.9%) | 26 (41.9%) | 0.001 | 10.93 |
| Haemoptysis | 23 (76.7%) | 22 (68.8%) | 45 (72.6%) | 0.485 | 0.488 |
| Weight loss | 14 (46.7%) | 22 (68.8%) | 36 (58.1%) | 0.078 | 3.101 |
| Fever | 20 (66.67%) | 23 (71.9%) | 43 (69.4%) | 0.657 | 0.198 |
*: t-test, **: Chi-square test
On conventional CT, among the malignant and benign lung masses, significantly more lesions were located centrally in malignant (37.5% vs 13.3%) than peripherally (62.5% vs 86.7%) (p=0.03), significantly less calcification was seen in malignant (18.8% vs 46.7%, p=0.019) [Table/Fig-2].
CT profile and its correlation with histopathological diagnosis.
| CT findings | Benign masses n=30 (%) | Malignant masses n=32 (%) | Total n=62 (%) | p-value | Test performed (*, **) |
|---|
| Size |
| Mean±SD (mm) | 4.89 1.11 | 5.20±1.25 | 5.05±1.19 | 0.318 | 1.007 |
| Volume |
| Mean±SD | 158.93±60.97 | 141.25±70.44 | 149.81±66.07 | 0.296 | 1.054 |
| Location |
| Central | 4 (13.3%) | 12 (37.5%) | 16 (25.8%) | 0.03 | 4.723 |
| Peripheral | 26 (86.7%) | 20 (62.5%) | 46 (74.2%) |
| Angiogram sign | 19 (63.3%) | 27 (84.4%) | 46 (74.2%) | 0.058 | 3.581 |
| Spiculated margin | 12 (40%) | 19 (59.4%) | 31 (50%) | 0.127 | 2.325 |
| Calcification | 14 (46.7%) | 6 (18.8%) | 20 (32.3%) | 0.019 | 5.522 |
| Pleural effusion | 21 (70%) | 19 (59.4%) | 40 (64.5%) | 0.382 | 0.764 |
| Lymphadenopathy | 17 (56.7%) | 30 (93.8%) | 57 (75.8%) | 0.001 | 11.61 |
| Pleural extension | 18 (60%) | 20 (62.5%) | 38 (61.3%) | 0.84 | 0.041 |
| Mediastinal extension | 2 (6.7%) | 13 (40.6%) | 15 (24.2%) | 0.002 | 9.736 |
| Bone destruction | 0 (0%) | 17 (53.1%) | 17 (27.4%) | <0.001 | 21.958 |
| Bronchus cut-off | 3 (10%) | 19 (59.4%) | 22 (35.5%) | <0.001 | 16.489 |
| Metastasis | 0 | 25 (78.1%) | 25 (40.3%) | <0.001 | 39.27 |
*: t-test, **: Chi-square test
The values of the CT perfusion parameters among the benign and the malignant masses was significantly different with statistically higher values in malignant masses as compared to the benign lesions (p<0.001) as shown in [Table/Fig-3]. The graphical representation of the complete DCE-CT and histopathological findings for the representative benign and malignant case has been shown in [Table/Fig-4,5].
Comparison of dynamic contrast enhanced perfusion CT assessment between benign and malignant lung masses.
| Parameter | Benign masses (n=30) | Malignant masses (n=32) | Total (n=62) | p-value | Test performed |
|---|
| Mean±SD | Mean±SD | Mean±SD |
|---|
| Blood Flow (BF) | 14.97±2.24 | 61.39±9.82 | 38.93±24.46 | <0.001 | t-test; 25.27 |
| Blood Volume (BV) | 6.43±1.67 | 10.24±3.57 | 8.4±3.44 | <0.001 | t-test; 5.19 |
| MTT | 5.2±0.58 | 8.95±1.32 | 7.13±2.15 | <0.001 | t-test; 14.32 |
| FEP | 11.39±1.33 | 16.74±3.46 | 14.16±3.77 | <0.001 | t-test; 7.94 |
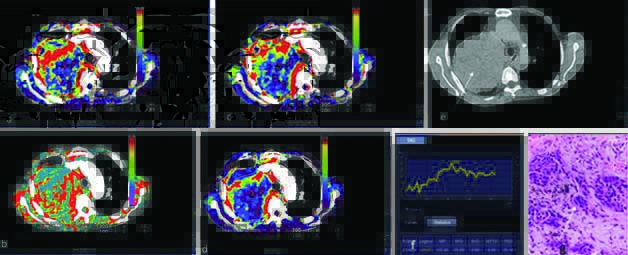
A 55-year-old case of malignant lung mass with CT perfusion maps generated on image post-processing. The colour scale (a-d) indicates range of perfusion parameters from high (red) to low (blue). Representative colour coded perfusion maps of lung mass shows: a) high BF; b) MTT; c) FEP; d) high BV; e) Non contrast CT showing a large left lung mass (white arrow); f) Receiver operating characteristic curve drawn with a free hand technique; g) histopathology of the lung mass revealed large tumour cells infiltrating the stroma lying singly and in groups with a large irregular hyperchromatic nucleus, suggestive of large cell carcinoma (White arrow).
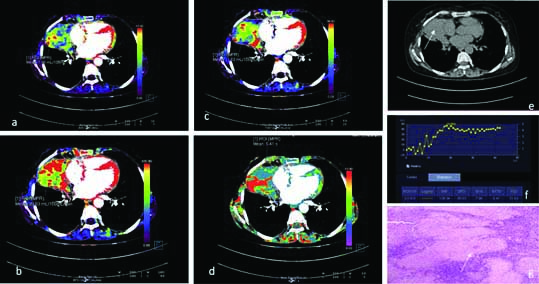
A 45-year-old case of benign lung mass with CT perfusion maps generated on image post-processing. The colour scale (a-d) indicates range of perfusion parameters from high (red) to low (blue). Representative colour coded perfusion maps of lung mass shows: a) low BF; b) MTT; c) FEP; d) low BV; e) Non contrast CT showing a left lung mass,(white arrow); f) Receiver operating characteristic curve drawn with a free hand technique; f) histopathology of the lung mass revealed caseating granulomas with giant cells suggestive of tuberculosis (White arrow).
Statistical analysis showed that the perfusion parameters BV, BF and MTT were significantly different among malignant masses but FEP was comparable [Table/Fig-6]. The results of Receiver Operating Characteristic (ROC) curve analysis showed that a threshold cut-off value of ≥31.9 for BF had a projected sensitivity and specificity of 100%; a threshold cut-off value of >6.05 for MTT had a projected sensitivity and specificity of 96.9% and 90%, respectively [Table/Fig-7,8].
Comparison of Dynamic contrast enhanced perfusion CT parameters between benign and malignant histopathological subtypes.
| CT parameters | Blood Flow (BF) | Blood Volume (BV) | MTT | FED |
|---|
| Benign |
| Hamartoma (n=6) |
| Mean±SD | 14.67±1.5 | 5.88±1.22 | 5.15±0.34 | 10.87±0.92 |
| Median(IQR) | 14.4 (13.575-15.075) | 6.35 (5.875-6.6) | 5.25 (5.125-5.3) | 10.95 (10.075-11.45) |
| Range | 13.3-17.3 | 3.5-6.7 | 4.5-5.5 | 9.8-12.1 |
| Pneumonic consolidation (n=11) |
| Mean±SD | 16.04±2.8 | 7.13±1.47 | 5.42±0.73 | 11.74±1.32 |
| Median (IQR) | 15.1 (13.4-19) | 7.3 (6.35-8.2) | 5.1 (4.85-6.15) | 11.7 (10.5-13.05) |
| Range | 13.2-19.3 | 4.1-8.7 | 4.5-6.5 | 9.8-13.2 |
| Tubercular (n=13) |
| Mean±SD | 14.22±1.7 | 6.09±1.9 | 5.04±0.5 | 11.33±1.49 |
| Median (IQR) | 13.3 (13.1-15.1) | 6.7 (4-7.9) | 5 (4.7-5.5) | 11.9 (9.9-12.5) |
| Range | 13.1-18.1 | 3.5-8.3 | 4.3-5.9 | 9.4-13.2 |
| p-value | 0.064 | 0.129 | 0.508 | 0.427 |
| Test performed | Chi-square=5.476 | Chi-square=4.096 | Chi-square=1.352 | Chi-square=1.698 |
| Malignant |
| Adenocarcinoma (n=11) |
| Mean±SD | 71.34±5.48 | 10±0.71 | 9.85±1.4 | 17.68±4.18 |
| Median (IQR) | 72.2 (69.35-74.4) | 10.3 (9.75-10.4) | 10 (9.8-10.35) | 18.9 (13.9-19.7) |
| Range | 58.1-78.3 | 8.8-11.1 | 6.1-11.5 | 12.2-25.4 |
| Large cell carcinoma (n=5) |
| Mean±SD | 55.72±6.03 | 8.34±1.39 | 8.26±0.57 | 15.08±2.5 |
| Median (IQR) | 54.3 (52.5-60.1) | 8.3 (7.6-9.2) | 8.1 (7.8-8.7) | 15.6 (15.5-16.2) |
| Range | 48.3-63.4 | 6.5-10.1 | 7.7-9 | 10.8-17.3 |
| Metastasis (n=2) |
| Mean±SD | 48.5±3.96 | 6.8±0.14 | 8.45±0.78 | 14.35±1.63 |
| Median(IQR) | 48.5 (47.1-49.9) | 6.8 (6.75-6.85) | 8.45 (8.175-8.725) | 14.35 (13.775-14.925) |
| Range | 45.7-51.3 | 6.7-6.9 | 7.9-9 | 13.2-15.5 |
| Sarcomatoid (n=2) |
| Mean±SD | 46.85±3.32 | 7.7±0.28 | 7.7±0.14 | 16.85±0.78 |
| Median (IQR) | 46.85 (45.675-48.025) | 7.7 (7.6-7.8) | 7.7 (7.65-7.75) | 16.85 (16.575-17.125) |
| Range | 44.5-49.2 | 7.5-7.9 | 7.6-7.8 | 16.3-17.4 |
| Small cell carcinoma (n=6) |
| Mean±SD | 57.25±7.15 | 7.35±1.52 | 8.4±1.25 | 17.6±4.82 |
| Median (IQR) | 56.5 (52.225-58.9) | 7 (6.3-8.525) | 8.75 (8.375-9.05) | 16.7 (14.4-20.125) |
| Range | 50.1-69.9 | 5.6-9.4 | 6-9.5 | 12.1-25.2 |
| Squamous cell carcinoma (n=6) |
| Mean±SD | 61.15±5.53 | 17.13±0.86 | 9±1.26 | 16.3±1.49 |
| Median (IQR) | 59.95 (59.45-63.3) | 16.8 (16.65-17.775) | 9.35 (8.925-9.7) | 16.4 (15.475-16.95) |
| Range | 53.4-69.9 | 16.2-18.3 | 6.6-10.1 | 14.2-18.5 |
| p-value | 0.0006 | 0.0002 | 0.011 | 0.647 |
| Test performed | Chi-square=21.507 | Chi-square=24.211 | Chi-square=14.837 | Chi-square=3.343 |
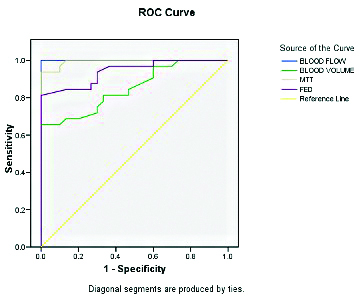
Receiver-Operator Characteristic (ROC) curve analysis to assess discriminant value of different dynamic contrast enhanced perfusion CT parameters for diagnosis of malignancy.
| Parameter | Area under curve±SE (p-value) | Projected cut-off value | Projected sensitivity | Projected specificity |
|---|
| Blood Flow (BF) | 1.00±0.00 (p<0.001) | >31.90 | 100 | 100 |
| Blood Volume (BV) | 0.85±0.049 (p<0.001) | >7.35 | 81.3 | 66.7 |
| MTT | 0.99±0.006 (p<0.001) | >6.05 | 96.9 | 90 |
| FEP | 0.94±0.028 (p<0.001) | >13.65 | 81.3 | 100 |
ROC curve for different for DCEP parameters.
The DCE-CT was able to correctly diagnose 31 cases of malignant and 26 cases of benign lung masses in concordance with histopathology. Thus the overall, sensitivity, specificity, PPV, NPV and diagnostic accuracy was 96.90%, 86.70%, 88.60%, 96.30%, and 91.90%, respectively [Table/Fig-9].
Distribution of cases according to DCE-CT diagnosis and its concordance with histopathological diagnosis.
| Dynamic contrast enhanced perfusion CT diagnosis | Histopathological diagnosis |
|---|
| Malignant | Benign |
|---|
| Malignant | 31 | 4 |
| Benign | 1 | 26 |
| Sensitivity | 96.90% |
| Specificity | 86.70% |
| Positive predictive value | 88.60% |
| Negative predictive value | 96.30% |
| Accuracy | 91.90% |
Discussion
The malignant prediction of increased perfusion parameters with contrast enhancement on CT scan as seen in the index study was in line with few previous studies [14-16]. It was owing to the increased vascularity and increased interstitial space fluid volume among the malignant lung masses [17].
The current study results depict the adjunctive role of contrast enhancement towards conventional CT. Conventional CT scan was able to determine the anatomical and structural aspects of the lung masses allowing us to know central/peripheral location, bone/mediastinal extension and destruction, associated lymphadenopathy, calcification and metastasis. The size of the lung masses cannot predict malignancy specifically since benign lesions may increase in size due to inflammation or haemorrhage as was seen in the index study. On histopathological comparison, it was found that these parameters were significantly different among benign and malignant lung masses; however, the usage of these parameters as a benchmark to classify the masses into benign and malignant is not suggested.
On the other hand, the perfusion parameters assist in understanding the tumour biology and ongoing angiogenenesis which forms the basis of lung masses characterisation, prognostication and a tool for newer anti-angiogenic tumour therapies in lung cancer [8]. The current study found all perfusion parameters, that is, BV, BF, MTT and FEP, to be significantly higher in malignant lesions as compared to benign ones (p<0.001). The findings were in line with previous studies who determined the perfusion CT parameters to be higher among malignant lung nodules as compared to benign [Table/Fig-10] [9,18-20].
Comparison of perfusion CT parameters between the present study and other studies.
| Study | Benign | Malignant | p-value |
|---|
| Present study |
| Blood volume | 6.43±1.67 | 61.39±9.82 | p<0.001 |
| Blood flow | 14.97±2.24 | 61.39±9.82 | p<0.001 |
| Mean transit time | 5.2±0.58 | 8.95±1.32 | p<0.001 |
| Flow extraction product | 11.39±1.3 | 16.74±3.46 | p<0.001 |
| Li Y et al., (2010)[18] |
| Perfusion (ml min–1 ml–1) | 13.1 | 61.5 | p=0.000 |
| Peak enhancement intensity (HU) | 11.3 | 60.2 | p=0.000 |
| Blood volume | 33.1 | 3.4 | p=0.000 |
| Time to peak | 28 | 32.5 | p=0.087 |
| Yi CA et al., (2004) [9] |
| Peak enhancement (HU) | 78 | 98 | p<0.001 |
| Net enhancement (HU) | 35 | 53 | p<0.001 |
| Preenhancement value (HU) | 44 | 46 | p=0.303 |
| Maximum relative enhancement ratio | 0.848 | 1.267 | p<0.001 |
| Time to peak enhancement (sec) | 119 | 103 | p=0.033 |
| Slope of enhancement (sec) | 0.009 | 0.015 | p<0.001 |
| Swensen SJ et al., (2000) [20] |
| Enhancement (HU) | 10 | 38.1 | p=0.244 |
| Peak enhancement attenuation (HU) | 17 | 15 |
| Swensen SJ et al., (1996) [19] |
| Enhancement (HU) | 8.0 | 46.5 | p<0.001 |
| Diameter (mm) | 13 | 16 | p<0.005 |
HU: Hounsfield units
Barring few previous studies on lung masses (malignant) [16,17], most of the studies have focused on the characterisation of Solitary Pulmonary Nodules (SPN). A SPN is different from lung mass in terms of size (<3 cm) and absence of atelectasis or lymphadenopathy [21]. In addition, the use of the DCE-CT technology which is one of the strengths of the current study, has been for research purposes rather than being routinely used in the current scenario. It is unfortunate that despite the distinguishing features of DCE-CT, its role as primary non invasive investigation for diagnosis of lung cancer has not been explored to its fullest. The present study was an attempt in that direction.
The main advantage of DCE-CT is that it provides the functional data about the masses in addition to the anatomical details from the conventional CT. The problems in data collection with DCE-CT persists in only upto 6% cases [22], which is due to small lesion size (<8 mm), contrast allergy, voluntary refusal for cannulation, panic attacks or breathing difficulties during the procedure [23].
Among the two approaches of DCE-CT examination, we used the first pass technique to assess the contrast enhanced vascular perfusion parameters of the lung masses; which is mainly a research approach [10,24]. The other approach is established and more validated which determines the enhancement by Hounsfield Unit (HU) with sensitivity, specificity and area under the ROC curve of 93%, 76% and 0.93, respectively [20,25,26].
In the current study, the overall, sensitivity, specificity, PPV, NPV and diagnostic accuracy was 96.90%, 86.70%, 88.60%, 96.30%, and 91.90%, respectively which was comparable to the other approach. Before performing DCE-CT, we made sure to assess the masses through conventional CT to know the morphological details among which central location, less calcification, more mediastinal extension, bone involvement were significantly associated with malignancy, whereas spiculated margins, angiogram sign, size and volume showed no association with histopathological findings.
Among the perfusion parameters, BV, BF and MTT were able to differentiate malignant lesions as seen in another study [16,27,28]. The index study showed that the BV, BF and MTT were significantly higher for adenocarcinoma and Squamous Cell Carcinoma (SCC) and low for sarcomatoid and metastasis. Compared to the present study, in Mondal A et al., study, the difference was significant only for BF and permeability among adenocarcinoma and SCC (p=0.001 and p=0.049) [16]. Shi J et al., found significantly higher permeability in adenocarcinoma than SCC (p<0.05) Ovali GY et al., found significantly higher BF in SCC than adenocarcinoma as was seen in the current study [27,28]. The statistical associations but differences stress on the need to standardise the dye dosage, calculations software and analysis methods since it becomes difficult to compare the cross-sectional studies with different used techniques.
Limitation(s)
The DCE-CT demonstrates high sensitivity in differentiation of malignant and benign lesions; however, one of the limitations related to it is its relatively poor specificity. This might be due to increased vascular flow in benign processes due to infection, inflammation. The false negatives may also increase among lesions such as pneumonic consolidation, hypervascular benign tumours, and masses with less vascular stroma [23]. Another limitation of the technique is the high cost of the machine and the procedure, which has restricted the routine use of DCE-CT. In addition, the lack of standardised cut-offs for malignancy also restricts the conclusive prediction of lung masses without histopathological correlation.
Conclusion(s)
The findings of present study showed that DCE-CT has a high diagnostic value in differentiation of malignant from benign lung masses. With proper exploration of dynamic contrast enhanced parameters such as BF and MTT and their skillful use in combination with other parameters, diagnostic efficacy of DCE-CT can be increased further. Future studies on a larger sample size with focus on increasing the accuracy of DCE-CT are recommended to promote its use as a non invasive method for lung cancer diagnosis and characterisation.
*: t-test, **: Chi-square test
*: t-test, **: Chi-square test
HU: Hounsfield units