Introduction
Childhood obesity is now rising as a significant health problem. In India, some studies showed a rising trend in the prevalence of overweight and obesity in children. This shocking rise in childhood obesity often accounts for increased intake of high calorie foods and decreased physical activity. In addition, non communicable diseases like diabetes mellitus, cardiovascular diseases and cancer are more common in obesity.
Aim
To assess the relationship between cardiopulmonary fitness and Body Mass Index (BMI) in school going adolescents between 12 to 16 years.
Materials and Methods
This study was a cross-sectional observational study conducted from March 2018 to March 2019. The study included 60 healthy students (between 12 to 16 years) full sample size divided into two groups and four subgroups. After the general physical examination and history taking, participants’ selection made in line with pre-defined inclusion and exclusion criteria. Anthropometric and body composition parameters were recorded. Using the modified Harvard’s Step test, cardiopulmonary fitness parameters like Physical Fitness Index (PFI) and Maximal oxygen consumption (VO2max) of each subject were calculated by applying the concerned formulae. All statistical analysis has been done by using Statistical Package for the Social Sciences (SPSS) software version 16.0.
Results
Total 60 apparently healthy students included 30 males and 30 females. Mean age was 14.93±0.96 years in Group I (normal weight boys, n=15) and 14.47±1.41 years in Group II (overweight/obese boys, n=15). Also mean age was 14.93±0.59 years in Group III (normal weight girls, n=15) and 15.27±0.59 years in Group IV (overweight/obese girls, n=15). Pearson correlation showed a significant negative correlation between BMI and PFI (r=-0.504, p-value <0.001) also between BMI and VO2max (r=-0.459, p-value <0.001).
Conclusion
Appropriate measures should be taken to enhance cardiopulmonary fitness among school children who are the wealth of the country at the school and community levels.
Introduction
In 2016, according to a study, more than 1.9 billion adults were overweight. Out of these, over 650 million were obese. Thirty-eight million children under the age of 5 years were overweight or obese in 2019. Over 340 million children and adolescents aged 5-19 years were overweight or obese in 2016 [1].
Developing countries face a double burden of disease, i.e., non communicable diseases (obesity and associated conditions, Diabetes Mellitus (DM) and cardiovascular diseases) and infectious diseases, which impose a considerable and rapidly growing burden on low and middle income countries [2]. Physical fitness is the prime criterion for survival, to achieve any goal, and to lead a healthy life. Physical fitness indicates all the systems’ functional status like skeletomuscular, cardiorespiratory, endocrine and metabolic [3].
Cardiopulmonary fitness is now considered an important health marker and a predictor of cardiovascular disease morbidity and morbidity [4]. Even though physical fitness is genetically determined, it can also be influenced by environmental factors like sedentary lifestyle, reduced physical activity, and dietary habits [5]. Obesity is defined as abnormal or excessive fat accumulation that may impair health. World Health Organisation (WHO) defines obesity as BMI >30 kg/m2 [6]. Obesity is considered a major risk factor for coronary heart diseases, hypertension, diabetes mellitus, cerebrovascular accidents, depression and anxiety. Childhood and adolescence are crucial periods of life since dramatic physiological and psychological changes occur at these ages. Likewise, lifestyle and healthy/unhealthy behaviours are established during these years, influencing adult behaviour and future health status [7].
Previous studies have indicated that the frequency, duration, and intensity with which physical activity is crucial to an individual’s overall health status suggest that a threshold must be maintained to produce positive health effects [8,9]. Maximal oxygen uptake (VO2max) is a standard measure of physical fitness levels, with higher values attained as fitness level improves, and is an essential indicator of successful physical activity interventions [10]. It is also important to note that most of the time dedicated to physical activity must be aerobic. Immediate measures must be taken to alleviate physical inactivity because it has been shown that: physical activity patterns track from childhood into adulthood, increasing physical activity modifies chronic disease (which also follow into adulthood) risk factor and prognosis, physical activity improves mental health as indicated by the lowered risk of development of anxiety, depression, in them. Increasing physical activity among children and adolescents is difficult as behaviour is influenced by physiological (age, gender, and ethnicity), psychological, sociocultural, and environmental factors [11].
Psychological determinants include self-perception of physical or sporting competence and personal benefits, possession of a positive mindset toward physical activity, level of engagement, and commitment. Barriers to physical activity, such as lack of time or feeling tired, are negatively associated with physical activity. Sociocultural influences include support for and participation in peers and siblings’ physical activity, parental level of physical activity [12].
Since a child carries what he has learnt in school to home. School is one of the cheapest and most efficient ways of health communication. Most of the developing countries have a growing population with a substantial proportion at a young age, imparting timely health education regarding physical fitness will reduce the future disease burden of non communicable disease and be communicated across to the next generations [13]. Children with higher cardiorespiratory fitness levels are primarily not associated with cardiovascular disease and myocardial infarction in adulthood. Therefore, precise, proper, and clinically helpful quantification of cardiorespiratory fitness is essential for identifying low cardiorespiratory fitness levels in children [14-16].
The school setting is the bestsuited environment for population-based physical activity interventions as it plays a significant role in their development. Given this, the present study was designed to compare cardiopulmonary fitness among overweight/obese and normal weight school children. Hence, the hypothesis of this study predicted that BMI will affect the cardiopulmonary fitness. This study may provide school guidelines to implement health promotion policies and physical activity programs for those suffering from obesity and low cardiopulmonary fitness.
Materials and Methods
This cross-sectional observational study conducted from March 2018 to March 2019 among school children in the age group of 12-16 years of Banjara high school in Vijayapur, Karnataka, India. The study obtained Institutional Ethical Certificate by the Institutional Ethical Committee (IEC Ref No-259/2017-18 dated March 27, 2018) from Shri BM Patil Medical College, Hospital and Research Centre, BLDE (Deemed to be University) Vijayapura, Karnataka, India.
Sample size calculation: Mean VO2 max (mL/kg/min) by bicycle ergometry is 20.3 and the Standard Deviation (SD) is 5.5. The calculated sample size when the allowable error L= ±2 is:
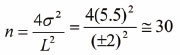
Hence, a total of 60 subjects, including 30 overweight and obese, 30 normal weight school children are taken for the study. As all the distributions merged into a normal distribution, sample size, i.e., 30, was enough because inference that can draw based on 30 observations will more or less remain the same despite an increase in the sample size [5,17]. The participants were screened (n=108) in the school premises, and volunteers enrolled. Screening and recording for subjects were done in January 2020. Those subjects who were healthy were selected (n=60) for the study after a thorough examination based on inclusion and exclusion criteria.
Inclusion criteria: Total 60 healthy school children, of which 30 were overweight/obese (BMI was 23 kg/m2 and above) [18] and 30 normal weight (BMI: 18.5-22.9 kg/m2) between 12-16 years of age were included in the study. The apparent health status of the subject was determined through clinical examination and history taking.
Exclusion criteria: Subjects with any congenital heart disease, endocrine disorders, history of chronic diseases, respiratory tract infection, allergy, cardiac or respiratory disease and congenital anomalies were excluded from the study.
The entire sample size was divided into 4 groups;
Group I: normal weight (n=15; BMI: 18.5-22.9 kg/m2) boys,
Group II: overweight/obese (n=15; BMI: 23 kg/m2 and above) boys,
Group III: normal weight (n=15; BMI: 18.5-22.9 kg/m2) girls,
Group IV: overweight/ obese (n=15; BMI: 23 kg/m2 and above) girls.
Each subject was explained about the purpose of the study and procedure to be adopted in the study. After taking consent from the principal, authors first ruled out the exclusion criteria in the subjects by history. A thorough physical examination was done, followed by the recording of the anthropological and physiological parameters.
Anthropometric Parameters
Anthropometric parameters like height in centimetres (cm), weight in kilograms (kg), BMI in kilograms per square meter (kg/m2) and Body Surface Area (BSA) in square meter (m2), Waist Circumference (WC) in centimetres, Hip Circumference (HC) in centimetres and physiological parameters like pulse rate in (beats/min), systolic blood pressure in millimetre of mercury (mmHg), diastolic blood pressure (mmHg), pulse pressure (mmHg) and mean arterial pressure (mmHg) were recorded by using standard procedures [19-22]. Waist-Hip Ratio (WHR) was calculated by dividing WC by HC [23,24].
Body Fat parameters: Body Fat percentage (BF%), Fat Mass (FM), Fat Free Mass (FFM), Fat Mass Index (FMI) and Muscle Mass (MM) were recorded [25,26].
Cardiopulmonary Fitness Parameters
By using Modified Harvard Step Test: the test was done on Modified Harvard Steps of 33 cm height. PFI and VO2 max were calculated by using the following formula:
1. Physical Fitness Index (PFI in %) [27]: The test was done on the modified Harvard steps of 33 cm height and it was calculated using following formula-
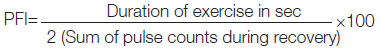
Procedure: The subjects were advised to step up on the modified Harvard steps of 33 cm height once every two seconds for 1minute. A total of 60 steps in total. The subjects were made to sit and the pulse rate was recorded immediately after the procedure and then at 1, 3, 5-minute intervals respectively, pulse rate was recorded as
(a) Pulse Rate 0 (PR0) – immediately after exercise
(a) Pulse Rate 1 (PR1) – 1 min after exercise
(b) Pulse Rate 2 (PR2) – 3 min after exercise
(c) Pulse Rate 3 (PR3) – 5 min after exercise
2. Maximal Aerobic Power (VO2 Max) [28]: Pulse rate recovery was used as a proxy for VO2max. It was obtained by using the formula: 111.33 – (0.42 X P max) [29]
P max: maximum pulse rate/min recorded immediately after 60 sec of Harvard’s Step Test exercise.
Statistical Analysis
All statistical analysis has been done by using Statistical Package for the Social Sciences (SPSS) software version 16.0. All values are presented as Mean±SD and Standard Error (SE). A comparison of mean values of parameters between the groups has been done by using an unpaired t-test. The p-value ≤0.05 is taken as significant. The data has been expressed in the form of tables and graphs. Data were normally distributed. To find the correlation between the variables, the Pearson correlation coefficient (parametric) test was applied.
Results
Among 60 Healthy school children, 30 (15 boys and 15 girls) overweight/obese (BMI: 23 kg/m2 and above), 30 (15 boys and 15 girls) normal weight (BMI: 18.5-22.9 kg/m2) between 12-16 years of age showed significant high values of weight (p-value <0.001), BMI (p-value <0.001), WC (p-value <0.001), HC (p-value <0.001), WHR (p-value <0.001), BF% (p-value <0.001), FM (p-value <0.001), FFM (p-value=0.01), MM (p-value=0.01) and significant low values of PFI (p-value=0.03) and VO2max (p-value=0.03) among Group II (overweight/obese boys) compared to Group I (normal weight boys) [Table/Fig-1].
Anthropometric and physiological characteristics between Group I (normal weight boys) and Group II (overweight/obese boys).
| Parameters | Group I | Group II | t-values | p-values |
|---|
| Mean±SD | SE | Mean±SD | SE |
|---|
| Age(years) | 14.93±0.96 | 0.25 | 14.47±1.41 | 0.36 | 1.060 | 0.3 |
| Height (cm) | 153.9±6.49 | 1.99 | 151.8±4.8 | 2.26 | 4.431 | 0.135 |
| Weight (Kg) | 48.1±5.27 | 1.27 | 57.83±6.67 | 2.35 | 2.017 | <0.001*** |
| BMI (kg/m2) | 20.27±1.4 | 0.27 | 25.15±1.71 | 0.59 | 8.535 | <0.001*** |
| BSA (m2) | 1.43±0.1 | 0.03 | 1.59±0.2 | 0.04 | 2 | 0.05* |
| PR (beats per minutes) | 93.93±14.7 | 2.85 | 93.66±11.98 | 2.37 | 0.054 | 0.563 |
| SBP (mmHg) | 121.07±14.51 | 2.96 | 127.07±11.83 | 2.81 | 1.241 | 0.225 |
| DBP (mmHg) | 68.93±8.24 | 2.32 | 72.13±7.15 | 1.73 | 1.136 | 0.266 |
| PP (mmHg) | 52.13±6.32 | 3.06 | 56.33±7.12 | 3.78 | 0.908 | 0.372 |
| MAP (mmHg) | 86.31±8.3 | 2.10 | 90.9±6.4 | 1.75 | 1.695 | 0.101 |
| WC (cm) | 74.26±3.95 | 1.02 | 94.27±6.1 | 1.57 | -10.7 | <0.001*** |
| HC (cm) | 88.33±4.42 | 1.14 | 103.93±7.9 | 2.04 | -6.68 | <0.001*** |
| WHR | 0.84±0.05 | 0.01 | 0.91±0.06 | 0.02 | -3.29 | <0.001 |
| RR (cpm) | 18.4±1.88 | 0.49 | 18.67±2.38 | 0.61 | -0.34 | 0.74 |
| BF% | 17.63±1.79 | 0.46 | 26.59±3.64 | 0.94 | -8.55 | <0.001*** |
| FM (kg) | 9.36±1.27 | 0.33 | 17.96±4.16 | 1.07 | -7.65 | <0.001*** |
| FFM (kg) | 43.77±4.17 | 1.08 | 49.11±6.14 | 1.59 | -2.79 | 0.01** |
| MM (kg) | 21.89±2.09 | 0.54 | 24.56±3.07 | 0.79 | -2.79 | 0.01** |
| PFI (%) | 49.19±3.51 | 0.91 | 46.56±2.6 | 0.67 | 2.327 | 0.03* |
| VO2max (mL/kg/min) | 57.35±3.3 | 0.85 | 54.52±3.4 | 0.88 | 2.315 | 0.03* |
Data are Mean±SD and SE; Values in the final column represent results of unpaired t-test among two groups; BMI: Body mass index; BSA: Body surface area; SBP: Systolic blood pressure; DBP: Diastolic blood pressure; PP: Pulse pressure; MAP: Mean arterial pressure; WC: Waist circumference; HC: Hip circumference; PR: Pulse rate; SBP: Systolic blood pressure; DBP: Diastolic blood pressure; WHR: Waist hip ratio; BF%: Body fat percentage; FM: Fat mass; FFM: Ffat-free mass; FMI: Fat mass index; MM: Muscle mass; PFI: Physical fitness index and VO2max: Maximal oxygen consumption; *p-value <0.05 is statistically significant; **p-value <0.01 is statistically moderately significant; ***p-value <0.001 is statistically highly significant
The study results also showed significant high values of weight (p-value=0.091), BMI (p=0.054), PR (p-value=0.025), PP (p-value=0.02), MAP (p-value=0.021), WC (p-value <0.001), HC (p-value=0.003), WHR (p-value=0.012), BF% (p-value <0.001), FM (p-value <0.001), FFM (p-value=0.014), MM (p-value=0.014) and significant low values of PFI (p-value <0.001) and VO2max (p-value <0.001) among Group IV (overweight/obese girls) compared to Group III (normal weight girls) [Table/Fig-2].
Anthropometric and physiological characteristics between Group III (normal weight girls) and Group IV (overweight/obese girls).
| Parameters | Group III | Group IV | t-values | p-values |
|---|
| Mean±SD | SE | Mean±SD | SE |
|---|
| Age (years) | 14.93±0.59 | 0.153 | 15.27±0.59 | 0.15 | -1.54 | 0.135 |
| Height (cm) | 168.5+4.06 | 1.676 | 167.6+4.20 | 1.26 | 2.086 | 0.081 |
| Weight (Kg) | 65+4.94 | 1.362 | 68.25+9.75 | 1.72 | 2.017 | 0.091 |
| BMI (kg/m2) | 23.33+1.16 | 0.363 | 24.06+2.8 | 0.44 | 2.129 | 0.054* |
| BSA (m2) | 1.77+0.1 | 0.027 | 1.74+0.7 | 0.07 | 1.867 | 0.128 |
| PR (bpm) | 73.58+8.37 | 3.798 | 74.86+9.86 | 3.09 | 2.979 | 0.025* |
| SBP (mmHg) | 121.1±14.52 | 3.749 | 127.1±11.8 | 3.06 | -1.240 | 0.225 |
| DBP (mmHg) | 68.93±8.24 | 2.128 | 72.13±7.2 | 1.85 | -1.135 | 0.266 |
| PP (mmHg) | 48.5+5.31 | 3.721 | 51.2+6.3 | 2.75 | 4.027 | 0.02* |
| MAP (mmHg) | 87.6+6.81 | 2.151 | 87.9+5.13 | 1.66 | 3.488 | 0.021* |
| WC (cm) | 71.47±5.82 | 1.502 | 82.53±3.87 | 1 | -6.13 | <0.001*** |
| HC (cm) | 90.13±3.72 | 0.96 | 97.1±7.23 | 1.87 | -3.32 | 0.003** |
| WHR | 0.79±0.04 | 0.011 | 0.85±0.08 | 0.02 | -2.68 | 0.012* |
| RR (cpm) | 18.27±2.49 | 0.64 | 19.13±2.29 | 0.59 | -0.99 | 0.33 |
| BF% | 21.55±2.23 | 0.575 | 28.7±2.63 | 0.68 | -8.02 | <0.001*** |
| FM (kg) | 10.44±2.05 | 0.528 | 16.72±3.28 | 0.85 | -6.29 | <0.001*** |
| FFM (kg) | 37.66±3.47 | 0.897 | 41.11±3.7 | 0.9 | -2.64 | 0.014* |
| MM (%) | 18.83±1.74 | 0.449 | 20.6±1.85 | 0.48 | -2.64 | 0.014* |
| PFI | 52.06±4.83 | 1.248 | 45.84±3.39 | 0.88 | 4.079 | <0.001*** |
| VO2max (mL/kg/min) | 59.64±3.53 | 0.912 | 53.33±3.33 | 0.86 | 5.036 | <0.001*** |
Data are Mean±SD and SE; Values in the final column represent results of unpaired t-test among two groups; BMI: Body mass index; BSA: Body surface area; SBP: Systolic blood pressure; DBP: Diastolic blood pressure; PP: Pulse pressure; MAP: Mean arterial pressure; WC: Waist circumference; HC: Hip circumference; PR: Pulse rate; SBP: Systolic blood pressure; DBP: Diastolic blood pressure; PP: Pulse pressure; MAP: Mean arterial pressure; WHR: Waist hip ratio; BF %: Body fat percentage, FM: Fat mass; FFM: Fat-free mass; FMI: Fat mass index; MM: Muscle mass; PFI: Physical fitness index and VO2max: Maximal oxygen consumption; *p-value <0.05 is statistically significant; **p-value <0.01 is statistically moderately significant; ***p-value <0.001 is statistically highly significant
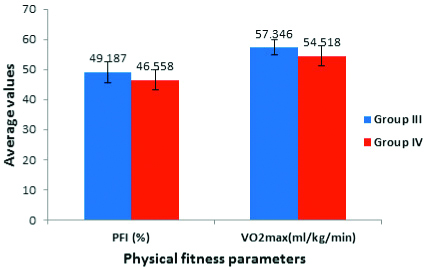
[Table/Fig-3,4] depict high values of PFI and VO2max among Group I (normal weight boys) compared to Group II (overweight/obese boys) and Group III (normal weight girls) compared to Group IV (overweight/obese girls).
Comparison of cardiopulmonary fitness Parameters between Groups I (Non obese boys) and II (obese boys).
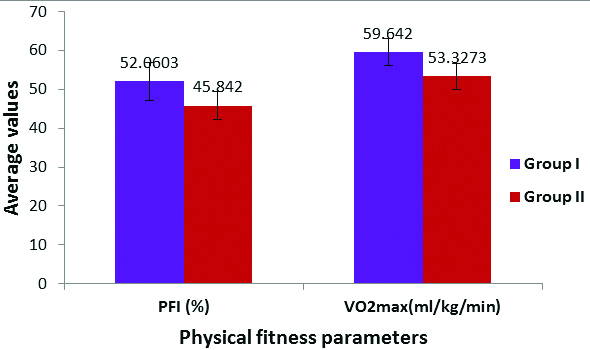
Comparison of cardiopulmonary fitness parameters between groups III (Non obese girls) and IV (obese girls).
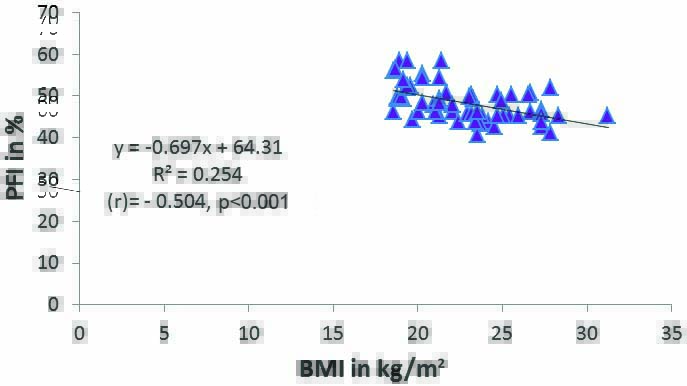
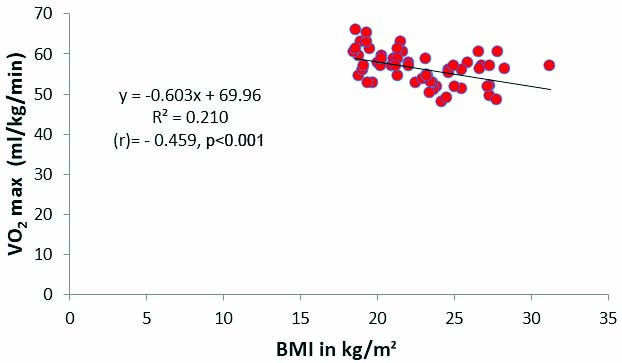
[Table/Fig-5,6] showed Pearson correlation between BMI and PFI also BMI and VO2max. PFI (p-value <0.001; r=-0.504) and VO2max (p-value <0.001; r=-0.459) showed significant negative correlation with BMI.
Pearson’s correlation between physical fitness index (PFI in %) and Body Mass Index (BMI in kg/m2) in both boys and girls.
Pearson’s correlation between physical fitness index (VO2max) and Body Mass Index (BMI in kg/m2) in both boys and girls.
Discussion
Creating a lifestyle pattern of regular physical activity that will carry forward to adulthood is the best primary prevention strategy. The clinical management of obese children has proved to be complicated. Present results showed significant negative correlation between PFI (p<0.001; r=-0.504) and VO2max (p<0.001; r=-0.459) showed with BMI. Our results related to PFI and VO2max with BMI corroborate with Ortega FB et al., and Patkar KU and Joshi AS who reported a higher BMI in adolescents with lower cardiopulmonary fitness independent of their passive and leisure time activities (physical activities outside school) [30,31].
A study showed about 10% of the variance in WC in boys and 18% of the WC variance in girls explained by sedentary activities like television viewing and video/computer also another study showed cardiopulmonary fitness was inversely related to WC (boys: p-value=0.001; girls: p-value=0.005) independent of physical activity. Ortega FB et al., and Patkar KU and Joshi AS showed an inverse relationship between physical fitness and overweight and overweight and physical fitness, except Huotari P et al., where no data was available [30-32]. Excess weight typically raises blood pressure, and weight loss usually lowers blood pressure. Dietary approaches to prevent and treat hypertension: a scientific statement from the American Heart Association [33].
Most of the anthropometric and body composition parameters were higher in the overweight/obese when compared to the standard weight group because of more significant fat content. Moreover, our observation that PFI and VO2max are inversely related to BMI correlates with multiple studies that have been conducted earlier [30,31]. A survey by Eddolls WTB et al., though structural equation modelling method postulated that enhancing cardiorespiratory fitness and BMI through increasing vigorous physical activity may be of benefit in direct and indirect ways to both Quality of Life (QoL) and mental well-being in adolescents [34]. Dhanakshirur GB et al., showed that regular exercise and nutrition among school children increase physical fitness compared to sedentary lifestyles [35].
So, authors can suggest: 1) School aged children and youth must accumulate atleast 60 minutes of Moderate to Vigorous intensity Physical Activity (MVPA) daily for health benefits, according to the WHO recommendations [36]; 2) The school setting is the most influential, ideal environment for physical activity interventions on children during their early years; 3) Advantages of encouraging physical activity in schools are excelling in academics, lower drop-out rates, and better behaviour in class, improved self-confidence and active participation in curricular and extra co-curricular activities; 4) Interventions suggested: incorporation into the school curriculum of the correlation between physical activity and nutrition; 5) Well-constructed and implemented the physical education curriculum. Training of staff must accordingly be undertaken; 6) Provision of healthy food in the school cafeteria; 7) Parental involvement could be an integral part of school-based interventions [37]. The number of deaths related to sedentary living or obesity is approximately a half-million per year. Regular physical activity may influence the QoL [38].
Limitation(s)
The main limitation of the study was small sample size.
Conclusion(s)
The present study showed that exercise testing might help to identify obese children who are not readily apparent in reduced activity or more cardiac or pulmonary impairment. Thus exercise testing can alert the clinician to children whose obesity may lead to severe cardiopulmonary morbidity and require more vigorous intervention. This study may serve as an eye opener for schools to stress regular physical activity through sports and physical training programs for school children throughout the country to counteract a sedentary lifestyle. Improvements in cardiopulmonary fitness have positive effects on depression, anxiety, mood status, and self esteem and are associated with higher academic performance. Preventive and social medicine staff should work closely with the policymakers to increase resources for the promotion of physical activity within the school system.
Data are Mean±SD and SE; Values in the final column represent results of unpaired t-test among two groups; BMI: Body mass index; BSA: Body surface area; SBP: Systolic blood pressure; DBP: Diastolic blood pressure; PP: Pulse pressure; MAP: Mean arterial pressure; WC: Waist circumference; HC: Hip circumference; PR: Pulse rate; SBP: Systolic blood pressure; DBP: Diastolic blood pressure; WHR: Waist hip ratio; BF%: Body fat percentage; FM: Fat mass; FFM: Ffat-free mass; FMI: Fat mass index; MM: Muscle mass; PFI: Physical fitness index and VO2max: Maximal oxygen consumption; *p-value <0.05 is statistically significant; **p-value <0.01 is statistically moderately significant; ***p-value <0.001 is statistically highly significant
Data are Mean±SD and SE; Values in the final column represent results of unpaired t-test among two groups; BMI: Body mass index; BSA: Body surface area; SBP: Systolic blood pressure; DBP: Diastolic blood pressure; PP: Pulse pressure; MAP: Mean arterial pressure; WC: Waist circumference; HC: Hip circumference; PR: Pulse rate; SBP: Systolic blood pressure; DBP: Diastolic blood pressure; PP: Pulse pressure; MAP: Mean arterial pressure; WHR: Waist hip ratio; BF %: Body fat percentage, FM: Fat mass; FFM: Fat-free mass; FMI: Fat mass index; MM: Muscle mass; PFI: Physical fitness index and VO2max: Maximal oxygen consumption; *p-value <0.05 is statistically significant; **p-value <0.01 is statistically moderately significant; ***p-value <0.001 is statistically highly significant
[1]. Woodard MT, Ageless Mirrorathlete: Overweight and Unfit No MoreiUniverse 2019 Jan 21 [Google Scholar]
[2]. Marshall SJ, Developing countries face double burden of diseaseBulletin of the World Health Organization 2004 82:556 [Google Scholar]
[3]. Blair SN, Kohl HW, Paffenbarger RS, Clark DG, Cooper KH, Gibbons LW, Physical fitness and all-cause mortality: A prospective study of healthy men and womenJAMA 1989 262(17):2395-401.10.1001/jama.1989.034301700570282795824 [Google Scholar] [CrossRef] [PubMed]
[4]. Myers J, Prakash M, Froelicher V, Do D, Partington S, Atwood JE, Exercise capacity and mortality among men referred for exercise testingNew England Journal of Medicine 2002 346(11):793-801.10.1056/NEJMoa01185811893790 [Google Scholar] [CrossRef] [PubMed]
[5]. Mora S, Redberg RF, Cui Y, Whiteman MK, Flaws JA, Sharrett AR, Ability of exercise testing to predict cardiovascular and all-cause death in asymptomatic women: A 20-year follow-up of the lipid research clinics prevalence studyJAMA 2003 290(12):1600-07.10.1001/jama.290.12.160014506119 [Google Scholar] [CrossRef] [PubMed]
[6]. Obesity and overweight. https://www.who.int/health-topics/obesity#tab=tab_1 [Google Scholar]
[7]. Pi-Sunyer X, The medical risks of obesityPostgraduate Medicine 2009 121(6):21-33.10.3810/pgm.2009.11.207419940414 [Google Scholar] [CrossRef] [PubMed]
[8]. Sallis JF, Prochaska JJ, Taylor WC, A review of correlates of physical activity of children and adolescentsMedicine and Science in Sports and Exercise 2000 32(5):963-75.10.1097/00005768-200005000-0001410795788 [Google Scholar] [CrossRef] [PubMed]
[9]. Haskell WL, Lee IM, Pate RR, Powell KE, Blair SN, Franklin BA, Physical activity and public health: updated recommendation for adults from the American College of Sports Medicine and the American Heart AssociationCirculation 2007 116(9):108110.1161/CIRCULATIONAHA.107.18564917671237 [Google Scholar] [CrossRef] [PubMed]
[10]. Trost SG, Pate RR, Saunders R, Ward DS, Dowda M, Felton G, A prospective study of the determinants of physical activity in rural fifth-grade childrenPreventive Medicine 1997 26(2):257-63.10.1006/pmed.1996.01379085396 [Google Scholar] [CrossRef] [PubMed]
[11]. Pate RR, Trost SG, Felton GM, Ward DS, Dowda M, Saunders R, Correlates of physical activity behavior in rural youthResearch Quarterly for Exercise and Sport 1997 68(3):241-48.10.1080/02701367.1997.106080039294878 [Google Scholar] [CrossRef] [PubMed]
[12]. Dobbins M, Husson H, DeCorby K, LaRocca RL, School-based physical activity programs for promoting physical activity and fitness in children and adolescents aged 6 to 18Cochrane Database of Syst Rev 2013 2013(2):CD00765110.1002/14651858.CD007651.pub223450577 [Google Scholar] [CrossRef] [PubMed]
[13]. Wang LY, Gutin B, Barbeau P, Moore J, Hanes J, Johnson M, Cost-effectiveness of a school-based obesity prevention programJournal of School Health 2008 78(12):619-24.10.1111/j.1746-1561.2008.00357.x19000237 [Google Scholar] [CrossRef] [PubMed]
[14]. Taylor HL, Buskirk ER, Henschel A, Maximal oxygen intake as an objective measure of cardio-respiratory performanceJ Appl Physiol 1955 8(1):73-80.10.1152/jappl.1955.8.1.7313242493 [Google Scholar] [CrossRef] [PubMed]
[15]. Lauersen JB, Brønd JC, Anderssen SA, Sardinha LB, Steene-Johannessen J, McMurray RG, A new approach to define and diagnose cardiometabolic disorder in childrenJ Diabetes Res 2015 2015:53983510.1155/2015/53983525945355 [Google Scholar] [CrossRef] [PubMed]
[16]. Eisenmann JC, Welk GJ, Ihmels M, Dollman J, Fatness, fitness, and cardiovascular disease risk factors in children and adolescentsMed Sci Sports Exerc 2007 39(8):1251-56.10.1249/MSS.0b013e318064c8b017762357 [Google Scholar] [CrossRef] [PubMed]
[17]. Sheldon MR, Introduction to probability and statistics for engineers and scientists 1987 Newyork, BurkleyednVilley publication:106 [Google Scholar]
[18]. Ortega RM, Requejo AM, Lopez-Sobaler AM, Quintas ME, Andres P, Redondo MR, Difference in the breakfast habits of overweight/obese and normal weight schoolchildren. International journal for vitamin and nutrition research. Internationale Zeitschrift fur Vitamin-und ErnahrungsforschungJournal international de vitaminologie et de nutrition 1998 68(2):125-32. [Google Scholar]
[19]. Jain AK, Manual of Practical Physiology 2007 2nd edHimachal PradeshArya Publications:178-184.:223:233:148-151. [Google Scholar]
[20]. Pal GK, Text book of Practical Physiology. Ed 2005 ChennaiOrient Longmann Publications:178:154-160. [Google Scholar]
[21]. Choudhari AR, Text book of practical physiology 2000 1st edIndiaParas Publishers:200-07. [Google Scholar]
[22]. Wanger J, Pulmonary function testing A practical approach 1992 1st edBaltimoreWilliams & Wilkins [Google Scholar]
[23]. Keys A, Fidanza F, Karvonen MJ, Kimura N, Taylor HL, Indices of relative weight and obesityJ Chronic Dis 1972 25(6):329-43.10.1016/0021-9681(72)90027-6 [Google Scholar] [CrossRef]
[24]. Seidel HM, Ball JW, Dains JE, Flynn JA, Solomon BS, Stewart RW, Mosby’s Guide to Physical Examination 2011 7th edSt. Louis, MO, USAMosby10.1016/B978-0-323-05570-3.00014-X [Google Scholar] [CrossRef]
[25]. Deurenberg P, Weststrate JA, Seidell JC, Body mass index as a measure of body fatness: Age- and sex-specific prediction formulasBr J Nutr 1991 65(2):105-14.10.1079/BJN199100732043597 [Google Scholar] [CrossRef] [PubMed]
[26]. Cotes JE, Chinn DJ, Body mass, fat percentage, and fat free mass as reference variables for lung function: Effects on terms for age and sexThorax 2001 56:839-44.10.1136/thorax.56.11.83911641507 [Google Scholar] [CrossRef] [PubMed]
[27]. Meisner JS, Lawrie JA, Human biology- A guide to field methods 1969 2nd edOxpordBlackwell Publishers:325-328. [Google Scholar]
[28]. McArdle WD, Energy transferIn: Essential of exercise Physiology 2000 3rd edBaltimoreLippincott Williams & Wilkins:245 [Google Scholar]
[29]. Vivian H, Heyward Table Reference for the Physical Fitness, Specialist certification Manual 1998 3rd edThe Cooper Institute for Aerobics Research:48 [Google Scholar]
[30]. Ortega FB, Tresaco B, Ruiz JR, Moreno LA, Martin-Matillas M, Mesa JL, Cardiorespiratory fitness and sedentary activities are associated with adiposity in adolescentsObesity (Silver Spring, Md) 2007 15(6):1589-99.10.1038/oby.2007.18817557997 [Google Scholar] [CrossRef] [PubMed]
[31]. Patkar KU, Joshi AS, Comparison of VO2max in obese and non-obese young Indian populationIndian Journal of Physiology and Pharmacology 2011 55(2):188-92. [Google Scholar]
[32]. Huotari P, Nupponen H, Mikkelsson L, Laakso L, Kujala U, Adolescent physical fitness and activity as predictors of adulthood activityJournal of Sports Sciences 2011 29(11):1135-41.10.1080/02640414.2011.58516621777154 [Google Scholar] [CrossRef] [PubMed]
[33]. Appel LJ, Brands MW, Daniels SR, Karanja N, Elmer PJ, Sacks FM, American Heart AssociationDietary approaches to prevent and treat hypertension: A scientific statement from the American Heart AssociationHypertension 2006 47(2):296-308.10.1161/01.HYP.0000202568.01167.B616434724 [Google Scholar] [CrossRef] [PubMed]
[34]. Eddolls WTB, McNarry MA, Lester L, Winn CON, Stratton G, Mackintosh KA, The association between physical activity, fitness and body mass index on mental well-being and quality of life in adolescentsQual Life Res 2018 27(9):2313-20.10.1007/s11136-018-1915-329948603 [Google Scholar] [CrossRef] [PubMed]
[35]. Dhanakshirur GB, Aithala M, Khodnapur JP, Role of exercise and nutrition on cardiopulmonary fitnessIndian Medical Gazette 2012 145(1):06-09. [Google Scholar]
[36]. WHOGlobal Recommendations on Physical Activity for Health 2010 Geneva, SwitzerlandWorld Health Organization [Google Scholar]
[37]. Salas C, Petermann-Rocha F, Celis-Morales C, Martínez-López EJ, Parental support for physical activity in school children and its influence on nutritional status and fitnessRev Chil Pediatr 2018 89(6):732-40. [Google Scholar]
[38]. Staurowsky EJ, De Souza MJ, Miller KE, Sabo D, Shakib S, Theberge N, Her life depends on it III: Sport, physical activity, and the health and well-being of American girls and womenWomen’s Sports Foundation 2015 May [Google Scholar]