In human body, the main working force is the core muscle; it allows the proper distribution of forces with maximum output and minimum compressive, translator or shearing forces at any involved joints in the body. With proper stabilisation of the proximal segments, it provides stability for distal muscle namely upper and lower limb in reference to the core muscle [1]. The core muscles have two major functions to perform that contribute towards movement and stability. The stabiliser muscles are designed in such a way that allows a prolonged period of use with a high capacity of endurance. The combination of transverse abdominals and multifidus work together prevents unwanted bending and rotating at the spinal level [2]. When these muscles become weak, they are unable to get activated thereby reducing the stability to the spine, which inturn lead to an injury especially during sports.
Just like core stability, core endurance is equally important. In order to achieve postural stability, endurance of the muscle is needed during a long period of work [3]. During exercise, the longer the period of work done, it will lead to fatigue of core muscle especially in runner population, therefore there is a need in training core endurance [4]. Even though a person is having stability but poor core endurance, the person is prone to have a higher risk of injury as they are unable to maintain good stability which increases the unnecessary load to the spine and causes injury. When providing core training, the targeted purpose is to enhance core endurance. The core muscle plays a role in balance where it stiffens around the lumbar region to support body load in a new position [4].
A recreational athlete can be defined as a person who is physically active, but who does not train for competition at the same level of intensity and focus as a competitive athlete [5]. He or she participates in sports to be physically fit, socially involved, and mostly to have fun. In the recreational athlete population, those with weak core muscle endurance and stability are more prone to sustain injury when performing the sports activity and have lesser balance control than those with good core muscle [6]. One of the most disabling injuries in recreationally active subjects is that involving the lumbar spine [7]. Hence, there is need to train these adults for core is important. When the athletes exercise protocol was investigated, it was found that curl up and sit up exercises added the compression forces to the joint of the spine and due to the increase in compression, the athletes faces low back pain [8]. To curb this problem, planking exercise have been introduced to replace sit up or curl up exercises. This exercise not only reduces the compressive forces on the joint, it also has a greater muscle activation to strengthen the core muscle and have been consider more superior than other exercises [8].
Planking or prone bridging is a type of body weight exercise and is used for training core muscle strengthening. It is a popular fitness exercise that has been advocated as beneficial both for rehabilitation program as well as physical conditioning routines [9,10]. Theoretically, enhanced core stability following planking allows the core musculature to resist applied external force and maintain postural control in response to a perturbation. The enhanced core stability may therefore translate into better functional performance [11]. Traditionally, performance of the prone plank involves assuming a push-up position with the forearms on the ground and the elbows positioned directly beneath the glenohumeral joints, spaced shoulder width apart [11]. Lehman GJ et al., showed that the prone plank elicited 29.5%, 26.6%, 44.6% and 4.98% of Maximum Voluntary Contraction (MVC) the internal oblique, rectus abdominis, external oblique and erector spinae musculature, respectively in a group of resistance-trained participants [12]. Even though planks can help to improve posture, strengthen shoulder, neck and abs, it is possible that the prone plank does not sufficiently challenge the neuromuscular system in highly fit individuals, thereby limiting transfer to dynamic performance. As a more challenging alternative, several strength coaches have promoted modifying the traditional prone plank.
However, recent studies show that planking was being modified to increase the efficiency in muscle activation by recruiting large group of muscle to work together [13]. Recently, a study was done and it concluded that other forms of (modified) planking was effective in activating the core muscles compared to traditional planking [14]. One type of modification is the body saw, like the plank, is an isometric, anti-extension core planking [15]. Body saw is superior to crunches and planks because of few reasons. Firstly, they are adding in the movement portion, so the exercise changes from static to dynamic. Secondly, the body is forced to hold tension as the lever angle and weight distribution changes, it reacts by increasing stiffness through the core. Thirdly, when extra weight of force is added to an already stiff core, the body super compensates by building muscles in those areas [16]. Although the body saw plank has a lot of advantages, it is understudied and not compared with conventional plank. Therefore, this research aimed to identify the effectiveness of body saw planking compared with the conventional planking on core strengthening, endurance and balance.
Materials and Methods
This study was a single-blinded, quasi-experimental pre-test and post-test study design carried out at Physiotherapy Center in Universiti Tunku Abdul Rahman (UTAR), Sungai Long Campus, Malaysia. Data were collected from 14th October 2019 to 29th November 2019 after obtaining ethical approval (U/SERC/183/2019).
Inclusion criteria: Individual who does one to three recreational sport in a week, aged between18-25 years and with normal flexibility as measured using Schober test [17,18] were included for the study. While performing Schober test, the subject’s L5 spinous process was marked (first line), and a second line was marked 10 cm above the first line and the subject was instructed to flex forward and remeasured the distance between two lines with fully flexed position.
Exclusion criteria: Individual who has shoulder pain or weakness, low back surgery, any injury for the past six months relating to muscle, previously involved in core strengthening program and who was a professional athlete were excluded from the study.
Sample size calculation: The sample size was calculated using G Power 3.1 software. The statistical test used was t-test Repeated measures, with in-between interaction with the effect size (f) 0.25, Power of Study was 90% and the total sample size generated was 26 participants and a 10% was added to the number of participants for dropout rate, therefore the number of participants taken for the study was 32.
Simple random sampling method was employed. The author generated the random allocation sequence 1 and 2 placed in a box for participants to draw out their groups. The participants were enrolled and assigned to respective groups by the author through a draw lots method.
Blinding: The participants were blinded before assignment to intervention. The outcome accessor also has no knowledge on the pre-test result. The method of blinding was used to eliminate subjective bias towards this study.
Each potential study subjects were screened with Physical Activity Readiness Questionnaires (PAR-Q+) to ensure whether they were eligible for this study [19]. Every subject qualified for the study was required to sign a consent form and a data protection act form. After pertaining their consent, the subject’s height, weight and BMI was calculated.
Procedure
A total of 32 recreational athlete subjects were recruited and were assigned to experimental group and control group. The subjects were informed not to alter their daily routine during the whole course of the study and not to take part in any core strengthening program which may affect data finding. The subject’s core endurance and stability data were measured by McGill Torso Muscular Endurance Test for core endurance and dynamic balance was measured by Star Excursion Balance Test (SEBT). The McGill Torso Muscular Endurance test consists of 4 major component which measures the trunk flexor, both left and right trunk side flexor and trunk extensor.
On the day of the pre-testing to measure core endurance, the McGill Torso Muscular Endurance Test was developed to measure the subjects core endurance. The subjects were instructed to adopt a position of crook lying, then propped upto 60° degree of trunk flexion with arm crossed in front of their chest with back support. This was the starting position for trunk flexor endurance test. Then, the support was taken away and the stopwatch was initiated to record the duration of hold in that position. The stopwatch was stop when the subjects had any deviation in the spine, or the subject requested to stop the test and the time of the stopwatch was recorded. Similarly, right and left lateral flexion and extension was measured [20].
The SEBT Platform is a 4-line platform which tests the dynamic balance of the subjects [21]. It consists of one vertical line and one horizontal line. The other two lines were 45° degree from the vertical line forming a star shape appearance with each line intersecting each other. Prior to testing, the subject’s limb length was recorded in order to find out the normalised reach distance. The limb length was measured from the Anterior Superior Iliac Spine (ASIS) to the Medial Malleolus of the same side. Then, the subject was required to reach out with another leg along the masking tape with measurement scale as far as possible without losing their balance, perform a tap at the furthest distance possible and return to the starting position. The reached distance was recorded and a total of three trails was given to calculate the average distance reach. Throughout the reach, the subject’s hand must remain at the waist. The stance leg was allowed to be flex to achieve further range. The subject was asked to stand barefooted and perform a single leg stance on the centre point with both hands on the waist [21]. After pre-testing data was collected, the subject started their 18 sessions of training. They were informed to attend for a three day per week training session for a total of six weeks. The protocol for both exercises adopted from Trainability of Core Stiffness [22]. Following six weeks of intervention the outcome measures were re-assessed and subjected to analysis.
Interventions
The experimental group received a body saw plank, left and right side plank, and bridging exercise, while the control group received the conventional plank, left and right side plank and bridging exercise. The training session begin with simple stretches in four directions of the trunk, 15 seconds each and the same stretches at the end of the training sessions. The progression of each exercise was one repetition every week until the 6th week. The procedure and number of repetitions for each exercise was as follows:
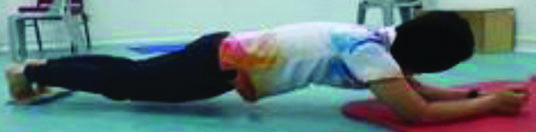
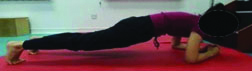
1. Body saw planking: The subjects were required to maintain a rhythmic forward backward motion in this position for a duration of 10 seconds and rest for five seconds. A total of two repetition of three set was performed. [Table/Fig-1,2] shows the starting and ending position of Body Saw Planking.
Starting position: Body Saw Plank.
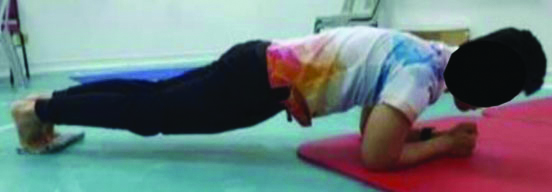
Ending position: Body Saw Plank.
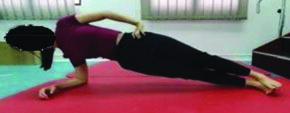
2. Left-sided planking: The subjects must maintain neutral spine position with pelvic, hip in neutral and knee extended position. The subject must hold in that position for a total of 10 seconds and five second rest for two repetition and total of three sets of exercise. [Table/Fig-3] shows the position of left-sided planking.
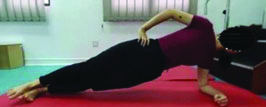
3. Right-sided planking: The subjects must maintain neutral spine position with pelvic in neutral, hip in neutral, knee extended position. The subject must hold in that position for a total of 10 seconds and five seconds rest for two repetition and total of three sets of exercise. [Table/Fig-4] shows the position of right-sided planking.
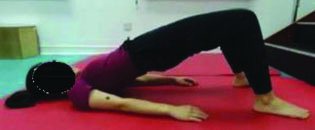
4. Bridging: The subjects had lift the pelvic straight up toward the ceiling until the hip was in neutral position in relation to the pelvis and hold in that position for 10 seconds and rest for five seconds. A total of three sets with two repetition was performed. [Table/Fig-5] shows the position of bridging.
5. Conventional planking: The subjects were required to sustain a straight body from head to toe and hold in that position for 10 seconds and rest for five seconds before repeating the exercise. The amount of repetition starts with two repetition for three sets. [Table/Fig-6] shows the position of conventional planking.
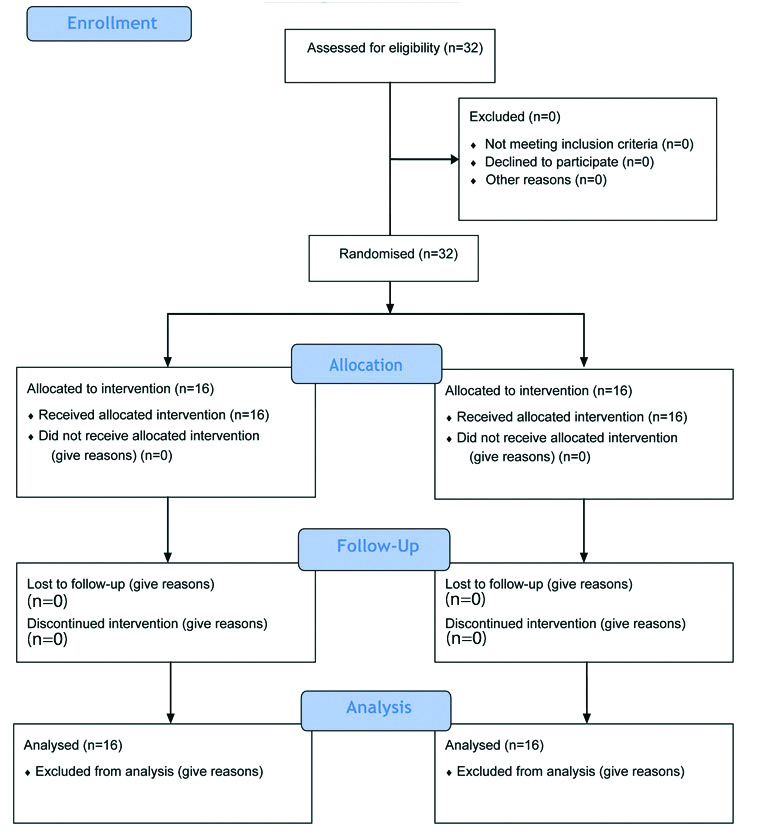
For each group, the number of participants who were assigned according to their draw lot number has received the intended treatment and were analysed for the primary outcome. There was no dropout of subject or exclusion as all participant met the requirement of this study [Table/Fig-7]. Recruitment of participants was gathered within a period of one week starting from 14th October 2019 till 20th October 2019. The follow-up for each participant was set at alternate day for training and three times per week. The trial ended when the collection of data has been completed.
Statistical Analysis
To organise, tabulate and calculate data, Microsoft Home and Student version 2016, Microsoft Excel was used. A tool to analyse the data collected which is Statistical Package for the Social Sciences (SPSS) version 23.0 software was used. Descriptive statistics was used to analyse demographic data of every subjects at their base line. A paired sample t-test was used to identify significant difference between pre-test result and post-test result within the same group. Furthermore, an independent t-test was used to determine the significant difference between post-test on the subject’s core endurance and dynamic stability between control group and experimental group. The level of significant difference, the value of p was set at p<0.05.
Results
Characteristics of subjects
There was no significant difference between both groups at all the baseline characteristics like age, height, body weight and BMI and p-value was more than 0.05 [Table/Fig-8]. Characteristic of subject and SEBT data were normally distributed in which the p-value was >0.05. Moreover, the McGill Torso Muscular Endurance test data was also normally distributed with a p-value of >0.05 [Table/Fig-9].
Characteristics of subjects (N=32).
| Characteristic (n=32) | CG (Mean±SD) (N=16) | EG (Mean±SD) (N=16) | Total (Mean±SD) (N=32) | p-value |
|---|
| Age (years) | 20.94±1.53 | 20.31±1.66 | 20.63±1.60 | 0.053 |
| Gender | Male:7Female:9 | Male:7Female:9 | Male:14Female: 18 | - |
| Height (cm) | 163.09±7.25 | 166.31±8.23 | 164.70±7.74 | 0.119 |
| Body weight (kg) | 56.46±9.97 | 58.06±7.16 | 57.26±8.57 | 0.608 |
| BMI | 21.08±2.80 | 20.96±1.91 | 21.02±2.36 | 0.895 |
SD: Standard deviation; CG: Control group; EG: Experimental group; cm: Centimeters; kg: Kilograms
Normality of Data Distribution.
| Shapiro-Wilk test |
|---|
| Parameters | Variables | Position | Statistic | df | p-value |
|---|
| Age | | | 0.935 | 32 | 0.053 |
| Height | | | 0.947 | 32 | 0.119 |
| Weight | | | 0.888 | 32 | 0.608 |
| BMI | | | 0.882 | 32 | 0.895 |
| SEBT | Left | A | 0.953 | 32 | 0.175 |
| | AM | 0.992 | 32 | 0.996 |
| | M | 0.980 | 32 | 0.812 |
| | PM | 0.960 | 32 | 0.274 |
| | P | 0.962 | 32 | 0.303 |
| | PL | 0.970 | 32 | 0.509 |
| | L | 0.946 | 32 | 0.108 |
| | AL | 0.960 | 32 | 0.269 |
| Right | A | 0.962 | 32 | 0.309 |
| | AM | 0.975 | 32 | 0.635 |
| | M | 0.959 | 32 | 0.265 |
| | PM | 0.977 | 32 | 0.707 |
| | P | 0.961 | 32 | 0.292 |
| | PL | 0.983 | 32 | 0.890 |
| | L | 0.967 | 32 | 0.688 |
| | AL | 0.964 | 32 | 0.348 |
| McGill test | Flx | | 0.859 | 32 | 0.106 |
| Ext | | 0.885 | 32 | 0.627 |
| (L) Flx | | 0.923 | 32 | 0.069 |
| (R) Flx | | 0.896 | 32 | 0.060 |
BMI: Body mass index; A: Anterior; AM: Antero-medial; M: Medial; PM: Postero-medial; P: Posterior; PL: Postero-lateral; L: Lateral; AL: Antero-lateral; Flx: Flexor; Ext: Extensor; (L) Flx: Left-side flexor; (R) Flx: Right-side flexor; df: Degree of freedom; Sig.: Significant difference; SEBT: Star excursion balance test
Comparison of Pre and Post-test of Core Endurance within Group
From [Table/Fig-10], it was found that there was a significant difference in all components of experimental and there was a significant difference in all components proving that conventional exercise was also able to improve core endurance.
Comparison of Pre and Post-test of core endurance within experimental group and control group.
| McGill test | Experimental group | Control group |
|---|
| Pre-test | Post-test | p-value | Post-test | Post-test | p-value |
|---|
| Flexion | 85.0±36.2 | 194.4±87.3 | 0.001* | 92.2±54.4 | 216.6±94.0 | 0.001* |
| Extension | 85.5±34.2 | 157.2±49.5 | 0.001* | 94.0±24.9 | 140.0±47.3 | 0.002* |
| Left flexion | 53.6±32.1 | 90.0±30.8 | 0.001* | 51.3±30.9 | 80.4±34.5 | 0.001* |
| Right flexion | 48.4±19.8 | 98.4±28.8 | 0.001* | 49.2±20.6 | 91.2±37.1 | 0.001* |
Paired sample t-test was used *indicates p-value<0.05 is considered statistically significant
Comparison of Pre and Post-test of Dynamic Balance of Left Lower Limb (LL) within Group
From [Table/Fig-11], it was found that there was a significant difference in antero-medial, medial, postero-medial, posterior, postero-lateral and lateral reach direction as well as the composite score of reach distance in experimental group. In control group, it was found that there was a significant difference in posterior, postero-lateral, lateral and antero-lateral reach direction as well as the composite score of reach distance.
Comparison of Pre and Post-test of dynamic balance of left LL within experimental group and control group.
| SEBT | Experimental group | Control group |
|---|
| Pre-test | Post-test | p-value | Pre-test | Post-test | p-value |
|---|
| A | 86.8±8.6 | 91.3±7.9 | 0.660 | 86.0±11.5 | 92.0±8.6 | 0.058 |
| AM | 92.5±8.3 | 98.1±7.3 | 0.037* | 91.6±9.7 | 95.4±9.0 | 0.120 |
| M | 91.7±9.9 | 99.0±8.3 | 0.004* | 93.1±8.7 | 97.5±9.3 | 0.054 |
| PM | 96.9±8.4 | 106.8±9.1 | 0.001* | 96.6±9.5 | 101.5±8.6 | 0.690 |
| P | 2.5±10.1 | 103.4±8.1 | 0.001* | 94.9±12.6 | 103.1±9.5 | 0.015* |
| PL | 86.2±11.0 | 93.8±9.7 | 0.044* | 88.1±11.3 | 98.4±9.1 | 0.001* |
| L | 76.8±7.3 | 84.8±8.1 | 0.001* | 75.9±11.4 | 91.2±7.2 | 0.001* |
| AL | 79.8±8.5 | 81.3±8.5 | 0.221 | 78.3±7.5 | 83.7±9.2 | 0.019* |
| Composite | 87.9±6.5 | 94.7±6.5 | 0.001* | 88.1±8.4 | 95.4±6.2 | 0.001* |
Paired sample t-test was used; A: Anterior; AM: Antero-medial; M: Medial; PM: Postero-medial; P: Posterior; PL: Postero-lateral; L: Lateral; AL: Antero-lateral, *indicates p-value<0.05 considered statistically significant
Comparison of Pre and Post-test of Dynamic Balance of Right Lower Limb (LL) within Group
From [Table/Fig-12], it was found that there was a significant difference in anterior, antero-medial, medial, postero-medial, postero-lateral, lateral reach direction as well as the composite score of reach distance in experimental group. In control group, it was found that there was a significant difference in anterior, medial, posterior, postero-lateral, lateral and antero-lateral reach direction as well as the composite score of reach distance.
Comparison of Pre and Post-test of dynamic balance of right LL within experimental group and control group.
| SEBT | Experimental group | Control group |
|---|
| Pre-test | Post-test | p-value | Pre-test | Post-test | p-value |
|---|
| A | 87.1±7.5 | 93.5±7.2 | 0.003* | 86.0±7.6 | 92.7±9.4 | 0.003* |
| AM | 91.5±5.4 | 99.3±5.6 | 0.001* | 91.9±8.7 | 95.9±9.7 | 0.070 |
| M | 94.2±7.0 | 102.3±8.8 | 0.001* | 91.7±11.8 | 99.2±9.4 | 0.015* |
| PM | 98.0±11.6 | 104.0±8.6 | 0.019* | 95.2±12.0 | 100.9±10.3 | 0.078 |
| P | 96.8±12.5 | 99.1±7.0 | 0.373 | 97.5±11.3 | 102.8±7.8 | 0.013* |
| PL | 90.1±11.6 | 95.8±9.3 | 0.007* | 90.1±14.1 | 100.3±7.4 | 0.003* |
| L | 74.6±10.3 | 86.8±10.0 | 0.001* | 73.8±13.5 | 88.9±10.2 | 0.001* |
| AL | 81.2±8.7 | 84.8±8.3 | 0.115 | 77.7±8.1 | 85.9±10.7 | 0.001* |
| Composite | 89.2±7.4 | 95.7±5.7 | 0.001* | 88.0±9.1 | 95.8±6.5 | 0.001* |
Paired sample t-test was used; * indicates p-value <0.05 is considered statistically significant; A: Anterior; AM: Antero-medial; M: Medial; PM: Postero-medial; P: Posterior; PL: Postero-lateral; L: Lateral; AL: Antero-lateral
Comparison of Post-test of Core Endurance and Dynamic Balance between Groups
From [Table/Fig-13], it was found that both control and experimental group exhibits no significant difference in all the component of the McGill Test with respect to p-value>0.05. This means that both group’s exercise was able to improve core endurance and they were of the same efficacy to improve core endurance. For dynamic balance on Left LL, only the lateral reach direction has a significant difference with the control group having more improvement than experimental group. For dynamic balance on Right LL, both groups show no significant difference in improving dynamic stability. This means that both groups were able to improve dynamic stability of the right LL but the efficacy of improvement was the same.
Comparison of post-test of core endurance and dynamic balance between groups.
| Mc Gill test | Post-test CG | Post-test EG | p-value |
|---|
| Flx | 216.6±94.0 | 194.4±87.3 | 0.495 |
| Ext | 140.0±47.3 | 157.2±49.5 | 0.322 |
| (L) Flx | 80.4±34.5 | 90.0±30.8 | 0.415 |
| (R) Flx | 91.2±37.1 | 98.4±28.8 | 0.542 |
| SEBT (L) | Post-test CG | Post-test EG | p-value |
| A | 92.0±8.6 | 91.3±7.9 | 0.806 |
| AM | 95.4±9.0 | 98.1±7.3 | 0.369 |
| M | 97.5±9.3 | 99.0±8.3 | 0.627 |
| PM | 101.5±8.6 | 106.8±9.1 | 0.153 |
| P | 103.1±9.5 | 103.4±8.1 | 0.926 |
| PL | 98.4±9.1 | 93.8±9.7 | 0.174 |
| L | 91.2±7.2 | 84.8±8.1 | 0.025* |
| AL | 83.7±9.2 | 81.3±8.5 | 0.450 |
| Composite | 95.4±6.2 | 94.7±6.5 | 0.779 |
| SEBT (R) | Post-test CG | Post-test EG | p-value |
| A | 92.7±9.4 | 93.5±7.2 | 0.793 |
| AM | 95.9±9.7 | 99.3±5.6 | 0.232 |
| M | 99.2±9.4 | 102.3±8.8 | 0.348 |
| PM | 100.9±10.3 | 104.0±8.6 | 0.369 |
| P | 102.8±7.8 | 99.1±7.0 | 0.172 |
| PL | 100.3±7.4 | 95.8±9.3 | 0.143 |
| L | 88.9±10.2 | 86.8±10.0 | 0.560 |
| AL | 85.9±10.7 | 84.8±8.3 | 0.756 |
| Composite | 95.8±6.5 | 95.7±5.7 | 0.956 |
Independent t-test; *indicates p-value <0.05 is considered statistically significant; CG: Control group; EG: Experimental group; A: Anterior; AM: Antero-medial; M: Medial; PM: Postero-medial; P: Posterior; PL: Postero-lateral; L: Lateral; AL: Antero-lateral; Flx: Flexor; Ext: Extensor; (L) Flx: Left-side flexor; (R) Flx: Right-side flexor
Discussion
In comparison between both exercise on core endurance and dynamic balance, it was found that both exercises were equally effective when compared with each other. The gathered data was inconsistent with study conducted by Cugliari G and Boccia G that body saw plank was better than conventional plank in strengthening the core muscle [23]. With the McGill Torso Muscular Endurance Test, body saw plank and conventional plank was able to improve core endurance significantly (p-value<0.05) but however comparison of both exercises shows no significant difference to which exercise had a better effect on core endurance. There were several factors which led to the result were that during the body saw plank intervention, the subjects reported that the body saw plank was more physically demanding and tiresome with the rhythmic forward and backward of the exercise.
These results were in accordance with study by Cugliari G and Boccia G (2017). They reported that body saw plank has a higher muscular activation compared with conventional plank. Due to the higher muscle activation, this have led to the subjects having trouble performing the exercise during the final set of the exercise which could have cause inadequate training towards the core muscle [23]. On the other hand, compensation could have led to higher increase in activation of core muscle with conventional plank exercise. Choi JH et al., conducted a research on trunk muscle activity with isometric contraction of the calf muscle on plank exercise. When there is an isometric contraction of the calf muscle whether ankle plantar flexor or dorsi flexor, this contraction can cause an increase in muscle activation of the core [24]. This may be the reason that conventional exercise performed could have increase the core strengthening properties. It was probable that the control group subjects may have activated the calf muscle during the plank and further increases muscle activation of the core muscle, whereas in experimental group calf muscle won’t be activated due the static position of calf when sliding and simultaneously movement in ankle is not allowed.
On the SEBT, both groups exhibited a significant improvement with the pre-test and post-test analysis which means that both body saw plank and conventional plank was able to improve dynamic balance. However, comparison between both exercises shows no significant difference (p-value >0.05) for all left and right reach direction except for the lateral reach direction for the left lower limb dynamic balance. Hesari AF et al., conducted a study on the relationship between SEBT and lower extremity strength, range of motion and anthropometric characteristic. Their study proved that SEBT reach distance should be analysed according to the normalised reach distance of the subjects and the strength of the lower extremity should be taken into consideration when testing [25]. Having a good lower limb strength can facilitate to further reach distance of the SEBT test. This is because the hip muscle strength also provides stability for efficient lower extremity movement for optimal function. The hip muscle co-contracted to eliminate the torque produced during SEBT test and ultimately provided greater stability and further reach distances [25].
Furthermore, other factors included postural-control strategy which could have influence the reach distance of the subjects in this study. During SEBT test, each subject would not have the same level of inhibition throughout the movement of all the eight directions in SEBT, therefore there is a possibility that the subjects were able to move further or stop prematurely when performing the test. Coughlan GF et al., conducted a study to compare selected direction of SEBT and Y-balance test to determine whether there is any difference between the reach distance on both tests. Result shows that there was a difference in reach distance between both tests where SEBT shows a more significant difference. The author mentioned that the postural control strategy contributed to the outcome obtained [26]. Moreover, Coughlan GF et al., also mentioned that the toe-touch on the ground during the reach distance could have influence the results. There was no definite way of measuring the amount of pressure exerted on the toe when touching the ground during SEBT test.
The variation of force applied to the ground by the subjects could lead to a temporary balance support when reaching out towards the direction of the test [26]. That being said, there is a possibility that the subject of this study may have obtained support during the toe-touch period during reach direction before returning to the starting position. This could have influenced the result by obtaining further reach distance, but balance was facilitated with the support of the ground during the toe-touch period. There is a need to observe the toe-touch during the test and ensure that the touch does not exert too much force on the ground to gain support, if so, a re-trial must be carried out.
Anat L and Patricia K conducted a study on association between foot morphology and dynamic balance measures using SEBT. They found that there was an association between foot morphology and dynamic balance. Subjects who have lower longitudinal arch than normal (Flat Foot) were able to reach a further distance in SEBT test. This is because individual who have a flat foot may lead to an increase range of motion or ligament laxity to further reach in distance of the SEBT test [27]. Another probable cause would be individual who have flat foot have a broader base of support which led to better balance. Therefore, there is a need to assess the foot type of the subjects before conducting the SEBT test to prevent possible bias or skewness in result. Last but not least, there is no definite published guideline or protocol on how to properly be administered the SEBT test which could have led to a variation in interpretation and administration of the SEBT.
Limitation(s)
Firstly, a core training for six weeks was a short amount of training for the core muscle. Hoppes CW et al., conducted a study on the efficacy of an eight week intervention for core endurance and muscular function and recommended that training duration for core muscle should be eight weeks or more in order to obtain a truly significant result [28]. Hence, it is highly recommended to have core training with a minimum of eight weeks intervention. Secondly, due to several subjects had fallen ill, the training was abrupted and cause the subject to train inconsistently which could have led to reduction of adherence towards training protocol. Thirdly, when performing conventional plank, ensure that there is no activation of the calf muscle to prevent further activation of the core muscle unless intended to. The strength, flexibility and foot type of the lower limb must be taken into consideration prior to conducting the SEBT test as it can affect the test result. There was some confounding factor that might have led to have caused the inconsistency with previous study. The confounding factors were friction from doing sliding of body saw plank causing reduced activation of core muscle, dynamic movement of body saw plank was tough for some participants leading to ineffectiveness of exercise.
Conclusion(s)
In conclusion, both body saw plank and conventional plank was able to improve core endurance and dynamic balance among recreational athletes. However, there was no significant difference between both groups in core endurance. Furthermore, there was no significant difference between both groups in dynamic balance. With there being no significant difference between the two groups, the hypothesis of body saw plank was better than prone bridging in improving core endurance and stability and prone bridging was better than body saw plank in improving core endurance and stability was rejected and the null hypothesis was accepted as proven through data analysis. For enhancing core muscle endurance and dynamic stability both exercises were able to provide the same effect towards the core muscle and can be used as part of core training protocol.
SD: Standard deviation; CG: Control group; EG: Experimental group; cm: Centimeters; kg: Kilograms
BMI: Body mass index; A: Anterior; AM: Antero-medial; M: Medial; PM: Postero-medial; P: Posterior; PL: Postero-lateral; L: Lateral; AL: Antero-lateral; Flx: Flexor; Ext: Extensor; (L) Flx: Left-side flexor; (R) Flx: Right-side flexor; df: Degree of freedom; Sig.: Significant difference; SEBT: Star excursion balance test
Paired sample t-test was used *indicates p-value<0.05 is considered statistically significant
Paired sample t-test was used; A: Anterior; AM: Antero-medial; M: Medial; PM: Postero-medial; P: Posterior; PL: Postero-lateral; L: Lateral; AL: Antero-lateral, *indicates p-value<0.05 considered statistically significant
Paired sample t-test was used; * indicates p-value <0.05 is considered statistically significant; A: Anterior; AM: Antero-medial; M: Medial; PM: Postero-medial; P: Posterior; PL: Postero-lateral; L: Lateral; AL: Antero-lateral
Independent t-test; *indicates p-value <0.05 is considered statistically significant; CG: Control group; EG: Experimental group; A: Anterior; AM: Antero-medial; M: Medial; PM: Postero-medial; P: Posterior; PL: Postero-lateral; L: Lateral; AL: Antero-lateral; Flx: Flexor; Ext: Extensor; (L) Flx: Left-side flexor; (R) Flx: Right-side flexor