Introduction
There are many types of coronaviruses that causes respiratory and intestinal infection in humans. Among these coronaviruses, is a group of Severe Acute Respiratory Syndrome (SARS)-like bat coronavirus, including both SARS-CoV and Severe Acute Respiratory Syndrome-Coronavirus-2 (SARS-CoV-2) that comprise a unique clade under the subgenus Sarbecovirus. The SARS-CoV-2 strains in India are more closely related to bat-CoVRaTG13 (93% homology) than pangolin CoV (83.5% homology). India reported its first case of Coronavirus Disease 19 (COVID-19) on January 30, 2020. Punjab, a state in northwestern India comprises of 22 districts which are classified into three major distinct regions viz. Majha, Malwa and Doaba. Four districts of Majha region of Indian state of Punjab are Amritsar, Tarn Taran, Gurdaspur and Pathankot.
Aim
The present study describes the SARS-CoV-2 epidemiology based on samples tested for Coronavirus; received at Viral Research and Diagnostic Laboratory (VRDL), Government Medical College, Amritsar, Punjab, India.
Materials and Methods
This epidemiological study was designed taking into consideration three main factors i.e. the gender, the age groups and the factor whether the individual has any symptoms or not. To study their context of applicability and its interpretation, a total of 3,47,418 samples from period of 01st April 2020 to 31st October 2020 were included in this study. Ribonucleic Acid (RNA) amplification by Reverse Transcriptase Polymerase Chain Reaction (RT-PCR) of SARS-CoV-2 from nasopharyngeal/oropharyngeal swabs of all individuals revealed confirmation of 17,920 positive samples. Total 2,29,310 males and 1,18,108 females were tested for the COVID-19 infection. Social science statistics online tool (https://www.socscistatistics.com/tests/) was used for Chi-square (χ2) test to analyse different parameters.
Results
Maximum number of COVID-19 positive patients was detected in 21 to 30 years age group (p<0.05). Highest positivity ratio of samples was observed in individuals exceeding the age of 50 years. Number of asymptomatic individuals was found to be quite higher than symptomatic individuals in total population. Overall percent positivity of asymptomatic individuals was 4.81% (p<0.00001), which accounts to 4.71% of total number of tested individuals in this study.
Conclusion
COVID-19 is an evolving disease and data from this study elucidates the epidemiological profile of the SARS-CoV-2 infection among population of Majha region of Punjab state of Indian subcontinent.
Introduction
Natural disaster is an event that can lead to regional or global loss to human life, economy and infrastructure. The COVID-19 caused by SARS-CoV-2 was first reported in Wuhan city, China, in December 2019. This disease spread rapidly across the world and by March 2020 the World Health Organisation (WHO) declared the COVID-19 outbreak as a pandemic. Rodriguez-Morales AJ et al., and Wu Z and McGoogan JM ., reported that SARS-CoV-2 is causative agent of SARS, transmitted via respiratory droplets or close contact with an infected person via oral, nasal, and mucous membranes of the eye which results in multiple organ failures and ultimately leads to death [1,2]. The gateway of cellular entry for SARS-CoV-2 is via SARS-CoV-2 spike protein 1 (S1) bound Angiotensin-Converting Enzyme 2 (ACE2) [3-5].
Coronavirus has a number of molecular targets within their positive-sense, single-stranded RNA genome that can be used for PCR assays. These include structural proteins, including spike glycoprotein (S), envelope (E), transmembrane (M), helicase (Hel) and nucleoprotein (N) [6,7]. In addition to these genes that encode structural proteins, there are some species-specific accessory genes that are required for viral replication that include open reading frames ORF1a and ORF1b, RNA dependent RNA polymerase (RdRp) [6]. Reverse transcription and quantitative PCR (RT-qPCR) was documented to be the gold-standard test for the detection of SARS-CoV-2 and its diagnosis post RNA extraction, as its amplification and analysis are done simultaneously in a closed system to minimise the false positive results associated with the amplification product contamination [8]. Population based seroepidemiological studies measure the extent of spread of infection in an area and recommended the containment measures accordingly [9,10]. Gender dependent disparities in the incidence and severity of COVID-19 and its associated mortality were reported in various clinical and epidemiological studies [11-16].
There are many types of coronaviruses that causes respiratory and intestinal infection in humans. Among these coronaviruses, is a group of SARS like bat coronavirus, including both SARS-CoV and SARS-Cov-2 that comprise a unique clade under the subgenus Sarbecovirus [6]. The SARS-CoV-2 strains in India are more closely related to bat-CoVRaTG13 (93% homology) than pangolin CoV (83.5% homology) [17].
India reported its first case of COVID-19 on January 30, 2020 [18,19]. As of 07 April 2021, the total cases in India were 1,28,01,785 with 8,43,473 deaths across India. There is a wide variation in the reporting of cases across the State/Union Territories and across the districts within each state [20].
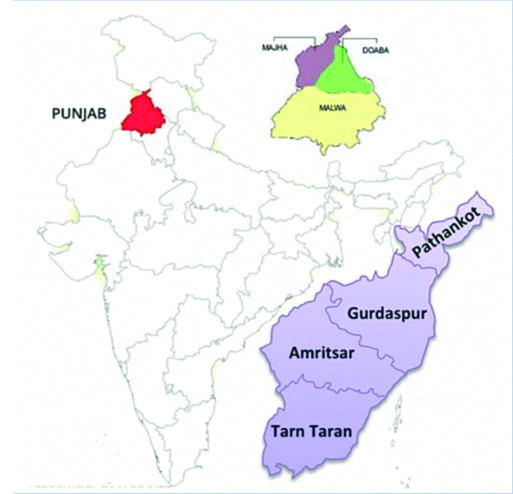
Punjab, a state in northwestern India comprises of 22 districts which are classified into three major distinct regions viz. Majha, Malwa and Doaba. The Majha region covers area between Beas and Ravi rivers including the area on the the north of Satluj, after the confluence of Beas and Satluj at Harike in Tarn Taran district, extending upto the Ravi river which is all part of Majha region in India. Four districts of Majha region of Indian state of Punjab are Amritsar, Tarn Taran, Gurdaspur and Pathankot. The COVID-19 pandemic was confirmed to spread to Punjab on 9 March 2020; first COVID cases in Amritsar, Gurdaspur, Pathankot and Tarn Taran districts were reported in the months of March and April, 2020. Punjab active cases on 07 April 2021 were tolling on the count of 2,57,057 with mortality of 7,216 individuals [20].
The present study aims to analyse the prevalence and epidemiological profile of the SARS-CoV-2 infection on the basis of RT-PCR analysis among the population of Majha (Amritsar, Gurdaspur, Pathankot, and Tarn Taran) region of Punjab. To accomplish this aim authors have analysed this study of testing of SARS-CoV-2 suspected individuals and the relation it has to their age, gender, symptomatic and asymptomatic factor.
Materials and Methods
In this retrospective, epidemiological study; direct diagnosis of SARS-CoV-2 infection were analysed which is based on the detection of SARS-CoV-2 RNA in nasopharyngeal and/or oropharyngeal swabs received in viral transport medium in cold chain from suspected patients by real time PCR (RT-PCR). The study includes samples received at VRDL, Government Medical College (GMC), Amritsar for the period of seven months i.e. between April 2020 and October 2020 and analysis has been conducted in the month of November and December. The samples were received from different collection centres across the four districts (Amritsar, Pathankot, Tarn Taran and Gurdaspur) comprising the Majha region of Punjab state of India.
Study Procedure
The RNA was extracted from suspected samples using automated RNA Extraction System (MGI) (1000021048) as per the standard protocol. The multiplexed RT-PCR (Allplex 2019-nCoV assay-Seegene, Seoul, South Korea) method was used to detect SARS-CoV-2, with co-amplification of different targets viz., RdRp, E, and N gene using multiplex real time PCR kit as per the standard protocol approved by Indian Council of Medical Research, India [21]. For a test to be considered positive, an amplification curve for each molecular target along with one positive and negative control was observed and analysed based on the exponential amplification curve with a Ct value (Cycle threshold) within a given threshold range mentioned in the manual of amplification kit used for the test. The amplifications were performed on QuantStudio and Bio-Rad Real-Time detection system using standard cycling conditions. The Ct values of RT-PCR were taken as indicators of the copy number of SARS-CoV-2 in samples, the ones with lower Ct values representing higher viral copy numbers.
Statistical Analysis
Social science statistics online tool (https://www.socscistatistics.com/tests/) was used for χ2 test to analyse different parameters i.e. the differences in positivity in all the four districts, gender wise distribution of total and positive samples and also the statistical analysis of positivity in symptomatic and asymptomatic individuals. Mann-Whitney U test was used for analysing the significance of age based data.
Results
Samples from 3,47,418 (NT-number of total samples analysed) individuals over a period of seven months (between 1st April 2020 and 31st October 2020) from four districts of Majha region of Punjab state of India were processed for detection of SARS-CoV-2. A map was prepared showing the four districts of Majha region of Punjab in India where the present study was focused and out of total four districts of Majha region of Punjab; maximum numbers of samples were received from Amritsar (42.91%) and least from Tarn Taran (13.45%) [Table/Fig-1,2].
District wise distribution and positivity rate of samples.
| Districts | Total | Percentage | Positive | Positivity rate |
|---|
| Tarn Taran | 46738 | 13.45% | 1281 | 2.74% |
| Pathankot | 49819 | 14.34% | 2790 | 5.60% |
| Gurdaspur | 101803 | 29.30% | 3579 | 3.52% |
| Amritsar | 149058 | 42.91% | 10270 | 6.89% |
| Majha (Total) | 347418 | 100% | - | - |
Map showing the four districts of Majha region of Punjab in India where the present study was focused.
Out of the total samples received, the number of male and female samples was 2,29,310 (NM-number of males) and 1,18,108 (NF-number of females) respectively. The demographic analyses of the data revealed that majority of the patients were males i.e. 66.00% [NM/NT] and females were 34.00% [NF/NT] (p<0.00001). 17,920 samples (NP-number of total positive symptomatic and asymptomatic samples) were confirmed for COVID-19 in the laboratory out of the total tested samples (NT).
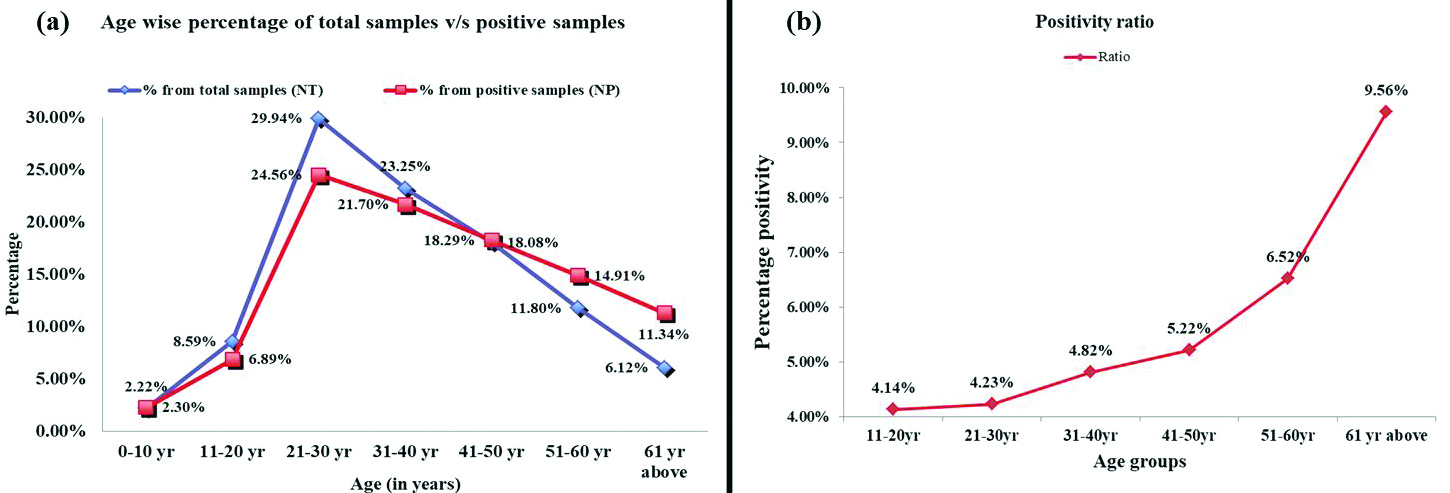
On comparing the positive samples within the districts, the highest positivity ratio of 6.89% was observed in Amritsar district followed by Pathankot, Gurdaspur and Tarn Taran district with the lowest positivity ratio of 2.74% [n=1,281; 1,281/46,738] [Table/Fig-1]. To check the positivity ratio of samples of each districts in comparison to the total samples received from all the districts (NT), the data analysis revealed that Amritsar contributed to 2.96% [n=10,270; 10,270/3,47,418] (p<0.01) COVID-19 positive cases followed by Gurdaspur, Pathankot and from Tarn Taran [Table/Fig-3]. On the basis of age, data was divided into seven age groups. The maximum number of the patients belonged to age group of 21 to 30 years i.e. 29.94% and highest number of COVID-19 positive cases i.e. 24.56% were also detected from the same age group [Table/Fig-4].
District wise distribution of SARS-CoV-2 positive patients in Majha region of Punjab.
| Districts | Total | Positive | Ratio (%) |
|---|
| Tarn Taran | 46738 | 1281 | 0.37 |
| Pathankot | 49819 | 2790 | 0.80 |
| Gurdaspur | 101803 | 3579 | 1.03 |
| Amritsar | 149058 | 10270 | 2.96 |
| Majha (Total) | 347418 | 17920 | 5.16 |
Age wise distribution and positivity ratio of total and COVID-19 positive samples of Majha region.
| Parameters/Age (years) | 0-10 | 11-20 | 21-30 | 31-40 | 41-50 | 51-60 | 61 above |
|---|
| Total (t) | 7717 | 29859 | 104003 | 80767 | 62826 | 40993 | 21253 |
| Positive (p) | 413 | 1235 | 4401 | 3889 | 3278 | 2672 | 2032 |
| Positivity Ratio (p/t) (%) | 5.35 | 4.14 | 4.23 | 4.82 | 5.22 | 6.52 | 9.56 |
| Overall ratio (t/NT) (%) | 2.22 | 8.59 | 29.94 | 23.25 | 18.08 | 11.80 | 6.12 |
| Positive sample ratio (p/NP) (%) | 2.30 | 6.89 | 24.56 | 21.70 | 18.29 | 14.91 | 11.34 |
t=total number of samples received for each age group; p=total number of positive samples for each age group;
NT=number of total samples analysed i.e. 347418; NP=number of total positive samples i.e. 17920
Mann-Whitney U test, p value=0.00214
t=total number of samples received for each age group; p=total number of positive samples for each age group
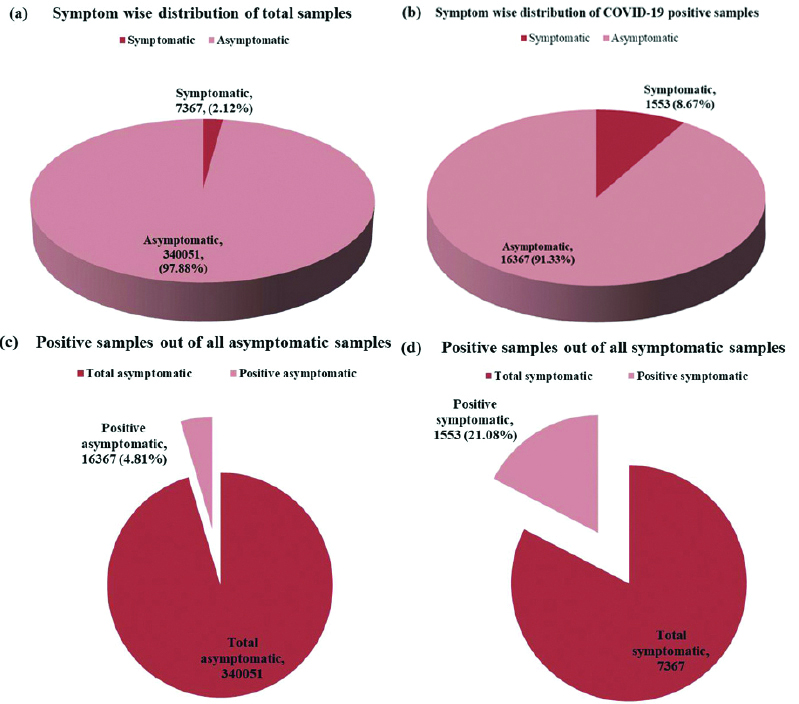
The number of asymptomatic individuals was found to be higher than symptomatic individuals in total population [symptomatic (7,367); asymptomatic (3,40,051)] [Table/Fig-5]. Out of total positive cases; percent positivity of symptomatic individuals was 8.67% [n=1,553; 1,553/17,920] and overall percent positivity of symptomatic individuals was 21.08% [n=1,553; 1,553/7,367] (p<0.00001), which accounts to 0.45% [n=1,553; 1,553/3,47,418] of total number of tested individuals in this study while on the contrary, percent positivity of asymptomatic individuals was 91.33% [n=16,367; 16,367/17,920] and overall percent positivity of asymptomatic individuals was 4.81% [n=16,367; 16,367/3,40,051] (p<0.00001), which accounts to 4.71% [n=16,367; 16,367/3,47,418] of total number of tested individuals in this study [Table/Fig-5]. Similar pattern was observed in case of total positive cases [Table/Fig-6a,b]. The number of symptomatic and asymptomatic individuals in positive cases was 1,553 and 16,367 respectively [Table/Fig-6c,d].
Comparative analysis of total and positive samples in symptomatic and asymptomatic patients.
| Variables | Total (t) | Positive samples (NP) | % from total symptomatic and asymptomatic samples (NP/t) | % from total samples (NP/NT) |
|---|
| Symptomatic | 7367 (2.12%) | 1553 (8.67%) | 21.08 | 0.45 |
| Asymptomatic | 340051 (97.88%) | 16367 (91.33%) | 4.81 | 4.71 |
χ2 test, p<0.00001
t=total number of symptomatic and asymptomatic samples; NP=number of total positive symptomatic and asymptomatic samples; NT=number of total samples analysed i.e. 347418
Pie charts depicting symptom wise distribution of (a) total sample, (b) COVID-19 positive sample, (c) the number of positive samples out of asymptomatic population and (d) the number of positive samples out of symptomatic population.
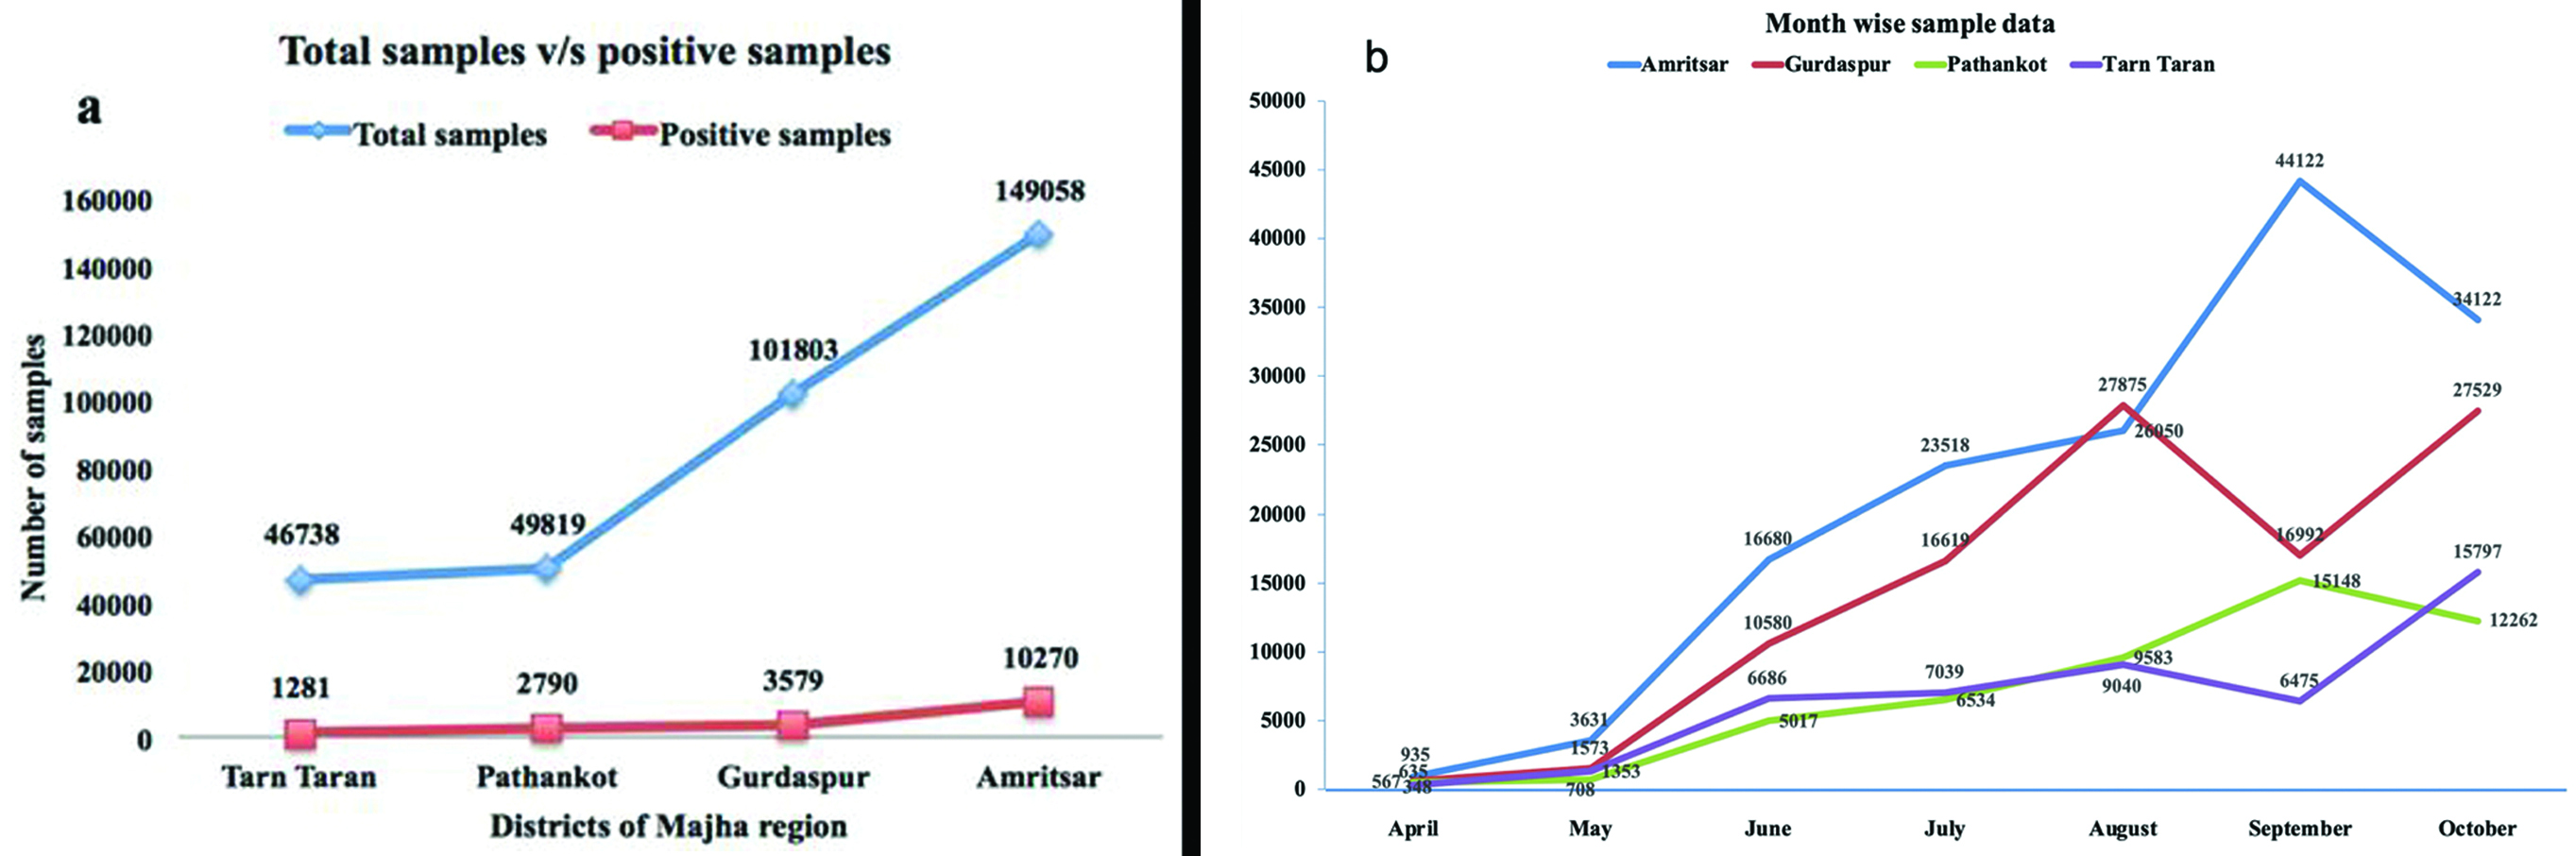
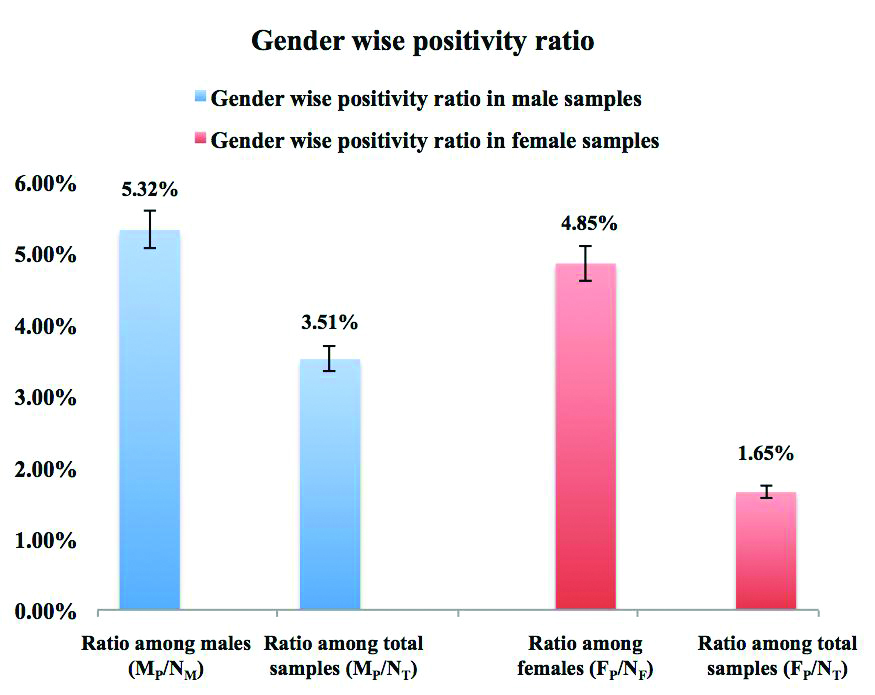
Numbers of samples for testing gradually increased from month of April to month of October 2020 [Table/Fig-7a,b]. The percentage positivity gradually increased with increasing age [Table/Fig-3], [Table/Fig-8a,b]. The total number of positive males (MP) and positive females (FP) were 12,193 and 5,727 respectively. The positivity ratio of males and females among their respective genders was found out to be 5.32% [MP/NM] and 4.85% [FP/NF] respectively (p<0.00001). Whereas on comparing the gender wise positivity ratio to the total number of samples, it was found to be 3.51% [12,193/3,47,418] for males and 1.65% [5,727/3,47,418] for the females (p<0.00001) [Table/Fig-9].
(a) District wise comparative analysis of total samples v/s positive sample, (b) Month wise number of sampling.
Age wise comparative analysis of (a) total samples v/s positive sample, (b) increasing trend of positivity ratio.
Gender wise comparison of total and positive samples.
Discussion
The current epidemiological data on SARS-CoV-2 detection from Majha region of Punjab state of India covers the total positive cases over a span of seven months along with gender, age and symptom parameters. Earlier it has been well established that the gender is an important variable that determines the susceptibility towards the various infections [22]. The SARS-CoV-2 infections pattern too obeys the gender variable with respect to the infectivity as well as fatality, as reported globally [23,24]. In the Majha region, the overall SARS-CoV-2 samples received from males were 66.00%, out which 5.32% tested positive; 34.00% of the samples received were from females, out of those 4.85% tested positive. Therefore the infection ratio was almost 1.1:1 (male to female) in the Majha region. The results are in line with the previous national and international reports where males have been reported to be infected at higher ratio than females [23,25]. The reason for difference in susceptibility towards the viral infection can be attributed to several factors, such as gender behaviour, social orientation, genetic, hormonal difference, and immunological varaibilities. One of the latest reports has demonstrated the difference in the level of ACE2 expression between both the genders. Additionally, the females tend to be heterozygous to the ACE2 gene locus since it is located on X- chromosome, which makes the expression of ACE2 in women heterozygous and assorted differently as compared to men who are homozygous. Also the testosterone plays key role in immunomodulation and determining more susceptibility of males towards infections [26].
Out of the total 17,920 positive samples across the four districts, 1,553 were symptomatic (8.60%) and 16367 i.e. 91.33% of patients were asymptomatic. The viral load in the asymptomatic individuals is nearly similar to that of symptomatic patients [27]. It has been commonly narrated that the pandemic is primarily driven by asymptomatic individuals; the data analysis of the present study has also inferred similar results signifying higher proportion of asymptomatic cases as also evident in the case of Argentinian expedition cruise ship; where in a compact space, 59.00% of the 217 passengers tested positive for COVID-19 and 81.00% of those were asymptomatic [28]. The possible reason behind the higher percent of asymptomatic cases in the region may also be due to the higher percent (~30%) of 21 to 30 age group population tested, generally who have been reported to be less vulnerable to the grave effects of the pandemic.
The majority of the cases belong to population of 21 to 30 years of age, as it is evident from present study data that the 29.94% tested samples were from the same age group. Concurrently, this age group forms a major portion of population in Punjab [29]. Contrarily, children contracted the infection at a very low rate (0 to 10 age group ~2% and 11 to 20 age group ~7%). This indicates that age group of 21 to 30 years is more prone to contract the disease (24.56%) the probable reason may be the socializing pattern of this age group, where they are expected to step outside of the home more to access professional and day-to-day activities while the children stayed home because of the restrictions imposed by government and are also known to have good lung regeneration capacity which contributes to their early recovery. Additionally, the absence of activities such as smoking, drinking and the risks associated with ageing in children as compared to the adult population also contribute towards a lower infection rate [26]. The percent positivity was highest for the 51 to 60 and above 60 year age groups as compared to the total number of samples received for these age groups in comparison to positivity ratio of other age groups. The cause for the above mentioned higher positivity may be attributed to the higher linkage of older population to co-morbidities as well as the fact that ageing hampers the lung’s regeneration capabilities in these age groups. This is also evident from the other reports worldwide, stating that the highest infection ratio and morbidity linked with COVID-19 has been observed in elderly population of 60 and above age group [30].
The present investigation was the first of its kind reporting an epidemiological insight for the SARS-CoV-2 infection in Majha region of Punjab and the large number of samples included in the analysis allowed to gather comprehensive information on SARS-CoV-2 epidemiology. This is based on the continuous monitoring of the community spread of infection on the basis of which this study attempts to assess progression of pandemic and the data generated can be implicated for preventing the further spread of the disease in the region.
Limitations
The results of this study only focus on the Majha region of Punjab state hence there is lack of knowledge and data of pervasiveness and epidemiology of SARS-CoV-2 in other regions of Punjab state of India.
Conclusion(s)
The data suggests the higher rate of infection in males than females in the Majha region of Punjab, India. The prime conclusion from the current analysis is regarding the percent positivity among the age groups, which was found to be highest for those above 60 year age. So it becomes crucial to socially distance our senior citizens from the highest infected group i.e. 21 to 30 years. The major fraction of patients in this study was asymptomatic ones and belonged to population below 30 years of age, which is a serious cause of concern as this fraction of population may act as super spreaders and silently spread the disease to those who are susceptible to harsh irrevocable effects of this pandemic.
Author contribution: First two authors in this publication contributed equally. Concept and planning were done by Kanwardeep Singh and Shailpreet Kaur Sidhu; Data analysis was carried out by Harsimrat Kaur and Ravinder Singh. Manuscript was written by Harsimrat Kaur, Ravinder Singh, Savjot Kaur and Mohan Jairath. Proof reading of manuscript was accomplished by Kanwardeep Singh and Shailpreet Kaur Sidhu.
t=total number of samples received for each age group; p=total number of positive samples for each age group;
NT=number of total samples analysed i.e. 347418; NP=number of total positive samples i.e. 17920
Mann-Whitney U test, p value=0.00214
t=total number of samples received for each age group; p=total number of positive samples for each age group
χ2 test, p<0.00001
t=total number of symptomatic and asymptomatic samples; NP=number of total positive symptomatic and asymptomatic samples; NT=number of total samples analysed i.e. 347418
[1]. Rodriguez-Morales AJ, Cardona-Ospina JA, Gutiérrez-Ocampo E, Villamizar-Peña R, Holguin-Rivera Y, Escalera-Antezana JP, Clinical, laboratory and imaging features of COVID-19: A systematic review and meta-analysisTravel Med Infect Dis 2020 34:10162310.1016/j.tmaid.2020.10162332179124 [Google Scholar] [CrossRef] [PubMed]
[2]. Wu Z, McGoogan JM, Characteristics of and important lessons from the coronavirus disease 2019 (COVID-19) outbreak in China: Summary of a report of 72 314 cases from the Chinese Center for Disease Control and PreventionJAMA 2020 323(13):1239-42.10.1001/jama.2020.264832091533 [Google Scholar] [CrossRef] [PubMed]
[3]. Li W, Moore MJ, Vasilieva N, Sui J, Wong SK, Berne MA, Angiotensin-converting enzyme 2 is a functional receptor for the SARS coronavirusNature 2003 426(6965):450-54.10.1038/nature0214514647384 [Google Scholar] [CrossRef] [PubMed]
[4]. Walls AC, Park YJ, Tortorici MA, Wall A, McGuire AT, Veesler D, Structure, function, and antigenicity of the SARS-CoV-2 spike glycoproteinCell 2020 181(2):281-92.10.1016/j.cell.2020.02.05832155444 [Google Scholar] [CrossRef] [PubMed]
[5]. Yan R, Zhang Y, Li Y, Xia L, Guo Y, Zhou Q, Structural basis for the recognition of SARS-CoV-2 by full-length human ACE2Science 2020 367(6485):1444-4.10.1126/science.abb276232132184 [Google Scholar] [CrossRef] [PubMed]
[6]. Cui J, Li F, Shi ZL, Origin and evolution of pathogenic coronavirusesNat Rev Microbiol 2019 17(3):181-92.10.1038/s41579-018-0118-930531947 [Google Scholar] [CrossRef] [PubMed]
[7]. Chan JF, Yip CC, To KK, Tang TH, Wong SC, Leung KH, Improved molecular diagnosis of COVID-19 by the novel, highly sensitive and specific COVID-19-RdRp/Hel real-time reverse transcription-PCR assay validated in vitro and with clinical specimensJ Clin Microbiol 2020 58(5):e00310-20.10.1128/JCM.00310-2032132196 [Google Scholar] [CrossRef] [PubMed]
[8]. Vogels CB, Brito AF, Wyllie AL, Fauver JR, Ott IM, Kalinich CC, Analytical sensitivity and efficiency comparisons of SARS-CoV-2 RT–qPCR primer–probe setsNat Microbiol 2020 5(10):1299-305.10.1038/s41564-020-0761-632651556 [Google Scholar] [CrossRef] [PubMed]
[9]. World Health Organization. A coordinated global research roadmap: 2019 novel coronavirus; March 2020. Geneva: WHO; 2020 [Google Scholar]
[10]. Clapham H, Hay J, Routledge I, Takahashi S, Choisy M, Cummings D, Seroepidemiologic study designs for determining SARS-COV-2 transmission and immunityEmerg Infect Dis 2020 26(9):1978-86.10.3201/eid2609.20184032544053 [Google Scholar] [CrossRef] [PubMed]
[11]. Cai H, Sex difference and smoking predisposition in patients with COVID-19Lancet Respir Med 2020 8(4):e2010.1016/S2213-2600(20)30117-X [Google Scholar] [CrossRef]
[12]. Dana PM, Sadoughi F, Hallajzadeh J, Asemi Z, Mansournia MA, Yousefi B, An insight into the sex differences in COVID-19 patients: What are the possible causes?Prehosp Disaster Med 2020 35(4):438-41.10.1017/S1049023X2000083732600476 [Google Scholar] [CrossRef] [PubMed]
[13]. Klein SL, Dhakal S, Ursin RL, Deshpande S, Sandberg K, Mauvais-Jarvis F, Biological sex impacts COVID-19 outcomesPLoS Pathogens 2020 16(6):e100857010.1371/journal.ppat.100857032569293 [Google Scholar] [CrossRef] [PubMed]
[14]. Park MD, Sex differences in immune responses in COVID-19Nat Rev Immunol 2020 20(8):46110.1038/s41577-020-0378-232572247 [Google Scholar] [CrossRef] [PubMed]
[15]. Sharma G, Volgman AS, Michos ED, Sex differences in mortality from COVID-19 pandemic: Are men vulnerable and women protected?JACC Case Rep 2020 2(9):1407-10.10.1016/j.jaccas.2020.04.02732373791 [Google Scholar] [CrossRef] [PubMed]
[16]. Stein RA, COVID-19: Risk groups, mechanistic insights and challengesInt J Clin Pract 2020 74(8):e1351210.1111/ijcp.13512 [Google Scholar] [CrossRef]
[17]. Banerjee A, Sarkar R, Mitra S, Lo M, Dutta S, Chawla-Sarkar M, The novel Coronavirus enigma: Phylogeny and mutation analyses of SARS-CoV-2 viruses circulating in India during early 2020JMIR Bioinform Biotech 2020 1(1):e2073510.2196/2073533496683 [Google Scholar] [CrossRef] [PubMed]
[18]. Andrews MA, Areekal B, Rajesh KR, Krishnan J, Suryakala R, Krishnan B, First confirmed case of COVID-19 infection in India: A case reportIndian J Med Res 2020 151(5):490-92.10.4103/ijmr.IJMR_2131_2032611918 [Google Scholar] [CrossRef] [PubMed]
[19]. Murhekar MV, Bhatnagar T, Selvaraju S, Rade K, Saravanakumar V, Thangaraj JW, Prevalence of SARS-CoV-2 infection in India: Findings from the national serosurvey, May-June 2020Indian J Med Res 2020 152(1&2):48-60. [Google Scholar]
[20]. Government of India. COVID-19 Dashboard. Available from: https://www.mygov.in/covid-19, accessed on March 29, 2021 [Google Scholar]
[21]. Performance evaluation of commercial kits for real time pcr for covid by icmr identified validation centres. Indian Council of Medical Research Department of Health Research, Ministry of Health and Family Welfare, Government of India. Date: 26/03/2021 https://www.icmr.gov.in/pdf/covid/kits/RT_PCR_Tests_Kits_Evaluation_Summ_26032021.pdf [Google Scholar]
[22]. Klein SL, Flanagan KL, Sex differences in immune responsesNat Rev Immunol 2016 16(10):62610.1038/nri.2016.9027546235 [Google Scholar] [CrossRef] [PubMed]
[23]. Peckham H, de Gruijter NM, Raine C, Radziszewska A, Ciurtin C, Wedderburn LR, Male sex identified by global COVID-19 meta-analysis as a risk factor for death and ITU admissionNat Commun 2020 11(1):631710.1038/s41467-020-19741-633298944 [Google Scholar] [CrossRef] [PubMed]
[24]. Dehingia N, Raj A, Sex differences in COVID-19 case fatality: Do we know enough?Lancet Glob Health 2021 9(1):e14-15.10.1016/S2214-109X(20)30464-2 [Google Scholar] [CrossRef]
[25]. Jin JM, Bai P, He W, Wu F, Liu XF, Han DM, Gender differences in patients with COVID-19: Focus on severity and mortalityFront Public Health 2020 8:15210.3389/fpubh.2020.0015232411652 [Google Scholar] [CrossRef] [PubMed]
[26]. Saxena S, Manchanda V, Sagar T, Nagi N, Siddiqui O, Yadav A, Clinical characteristic and epidemiological features of SARS CoV-2 disease patients from a COVID 19 designated Hospital in New DelhiJ Med Virol 2021 10.1002/jmv.2677733410174 [Google Scholar] [CrossRef] [PubMed]
[27]. Oran DP, Topol EJ, Prevalence of asymptomatic SARS-CoV-2 infection: A narrative reviewAnn Intern Med 2020 173(5):362-67.10.7326/M20-301232491919 [Google Scholar] [CrossRef] [PubMed]
[28]. Ing AJ, Cocks C, Green JP, COVID-19: In the footsteps of Ernest ShackletonThorax 2020 75(8):693-94.10.1136/thoraxjnl-2020-21509132461231 [Google Scholar] [CrossRef] [PubMed]
[29]. Census 2011. http://statisticstimes.com/demographics/india/punjab-population.php [Google Scholar]
[30]. Omori R, Matsuyama R, Nakata Y, The age distribution of mortality from novel coronavirus disease (COVID-19) suggests no large difference of susceptibility by ageSci Rep 2020 10(1):1664210.1038/s41598-020-73777-833024235 [Google Scholar] [CrossRef] [PubMed]