Phenotypic Variation of Insulin Resistance among Polycystic Ovarian Syndrome Patients in Semiurban North Indian Population
Chaitali Maitra1, Ramesh Chandra Gupta2, Rishika Raj3
1 PhD Scholar Nims University, Assistant Professor, Department of Biochemistry, Mayo Institute of Medical Sciences, Barabanki, Uttar Pradesh, India.
2 Professsor, Department of Biochemistry, National Institute of Medical Sciences and Research, Jaipur, Rajasthan, India.
3 Assistant Professor, Department of Obstetrics and Gynaecology, Mayo Institute of Medical Sciences, Barabanki, Uttar Pradesh, India.
NAME, ADDRESS, E-MAIL ID OF THE CORRESPONDING AUTHOR: Chaitali Maitra, Assistant Professor, Department of Biochemistry, Mayo Institute of Medical Sciences, Faizabad Road, Gadia, Barabanki, Uttar Pradesh, India.
E-mail:chaitaliarjunmaitra@gmail.com
Introduction
Polycystic Ovarian Syndrome (PCOS) is a common endocrine disorder in the women of reproductive age. Studies show that there is an intensive relationship between insulin and gonadal function. As per Rotterdam Criteria, there are four major phenotypes of PCOS with different presentation. Early detection of Insulin Resistance (IR) and consequential prevention of Metabolic Syndrome (MS) associated with PCOS may lead to better prospect for the disease.
Aim
To find the pattern of IR in all the phenotypes of PCOS in relation to Waist Hip Ratio (WHR), Body Mass Index (BMI) and Testosterone and thereby, providing data for designing phenotype specific treatment of the disease.
Materials and Methods
In this cross-sectional observational study, fasting insulin and fasting glucose were analysed to calculate Homeostasis Model Assessment (HOMA-IR) and Testosterone for total 144 female subjects of reproductive age group (18-40 years). Subjects were classified in to four groups as per Rotterdam Criteria. Complete PCOS (PCO-COM), PCO with Oligo/Anovulation (PCO-O), Anovulation with Hyperandrogenism (O-HA), and PCO with Hyperandrogenism (PCO-HA). Regression analysis was done to find the relation among the study variables. Analysis of Variance (ANOVA) was used to analyse the significant variance among the groups.
Results
IR was found to be maximum among O-HA phenotype (2.4±0.37) and lowest among PCO-HA phenotypes (1.3±0.22). Regression analysis shows that there exist significant associations between IR and BMI (t=4.96, p=0.001) as well as between IR and WHR (t=2.97, p=0.003). No independent association between testosterone and IR was observed.
Conclusion
Significant difference of IR, WHR, and BMI was observed among the four phenotypes of PCOS. Due to increased IR, O-HA and PCO-COM phenotypes are more predisposed to Cardiometabolic consequences of PCOS.
Body mass index, Metabolic syndrome, Testosterone
Introduction
The PCOS is considered as a multifactorial disorder and it affects female population of both developing and developed nations. A uniform definition of PCOS does not exist, in large part because of its diverse and heterogeneous nature [1]. However, it is identified as an endocrine disorder and it is considered as a syndrome rather than a disease [2]. As per diagnostic criteria adopted from Rotterdam consensus, PCOS population can be classified into four identifiable phenotypes [Table/Fig-1] [3]. The MS is a widely prevalent and multi-factorial disorder that presents in a distinct, albeit heterogonous phenotype [4]. Obesity is common among females with PCOS and it is well-established that body fat plays a crucial role in development and maintenance of PCOS. Studies also support the fact that adiposity may have an effect on hyperandrogenism found in PCOS [5]. Although obesity and IR are not synonymous with the MS, they are integral features in this derangement of adipocyte physiology and carbohydrate metabolism. Studies suggest a greater than 25% incidence and prevalence of PCOS in overweight and obese women. Data regarding prevalence of PCOS in overweight and obese women varies widely but studies suggest that prevalence of PCOS increases among women with obesity [6]. IR can be understood as the inability of body cells to respond to insulin and thereby, decreased entry of glucose into the cell. IR is significantly associated with the PCOS and it is often observed that PCOS patients develop Diabetes mellitus type 2 (D2M) or MS [7,8]. Reduced insulin sensitivity causes compensatory hyperinsulinemia leading to different co-morbidities [9]. IR followed by hyperinsulinemia resulting in hyperandrogenemia which turns into a vicious cycle. In-vitro studies show insulin modulate secretion of Luteinizing Hormone (LH) and Gonadotropin-Releasing Hormone (GnRH) secretion in dose dependent and time dependent manner [10,11]. This continuous production and stimulation ultimately result in elevated ovarian steroidogenesis in particular androgens [12]. Studies suggest that insulin appears to be involved in adrenal steroid secretion in an unclear manner [13]. The inverse relationship of Sex Hormone Binding Globulin (SHBG) and insulin leads to increased bioavailability of free androgen in the body. The paradox is inspite of systemic IR ovarian tissues remain sensitive to insulin leading to selective IR [14]. PCOS exerts a severe threat to health and lifestyle of a patient. It is important to know the status of IR among the PCOS as both obese and non obese patients develop complications independent of IR. The present study explores the status of IR along with BMI, WHR and testosterone in the different phenotypes of PCOS defined by the Rotterdam Criteria.
Phenotypic classification as per Rotterdam criteria [3].
| Phenotype | Echographic polycystic ovary | Oligo/Anovulation | Clinical/Biochemical signs of hyperandrogenism |
|---|
| PCO-COM | + | + | + |
| O-HA | - | + | + |
| PCO-HA | + | - | + |
| PCO-O | + | + | - |
Materials and Methods
This is a cross-sectional observational study conducted with the involvement of Department of Biochemistry and Department of Obstetrics and Gynaecology of Mayo Institute of Medical Sciences, Barabanki, Uttar Pradesh, India. Study was planned during May 2019. Sample collection was done between November 2019 to March 2020 and had to be halted due to COVID-19 pandemic due to closure of OPD services. Later we resumed the study from January 2021 to February 2021. Altogether the study period was about seven months. Study was approved by the Institutional Ethics Committee vide approval letter no. MIMS/Ex/2019/199 dated 19/11/19 and written informed consent was obtained from all participants. A total of 144 female subjects diagnosed with PCOS aged between 18-40 years were chosen from OPD of Obstetrics and Gynaecology department of Mayo Institute of Medical sciences, Barabanki, India.
Sample size calculation: For the calculation of sample size, we used the formula based on prevalence,
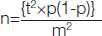
where,
n=Sample size,
t=Confidence level at 95%,
p=estimated prevalence,
m=margin of error
Inclusion criteria: Subjects aged between 18-40 years who were already diagnosed with PCOS as per Rotterdam criteria were included in the study [3]. Subjects underwent clinical examination, Sonography, biochemical and hormonal assay during the process of diagnosis. Subjects were categorised in to four different phenotypes of PCOS:
A) PCOS complete fulfilling all three criteria (PCO-COM),
B) PCO with Hyperandrogenism (PCO-HA),
C) Anovulation with Hyperandrogenism (O-HA)
D) PCO on ultrasound with Oligo or Anovulation (PCO-O).
Exclusion criteria: Subjects less than 18 years and more than 40 years of age, with late onset congenital adrenal hyperplasia, thyroid disease, hyper prolactinemia, androgen secreting tumours were excluded from the study. Subjects using medication (including oral contraceptives), a hormonal intrauterine device and pregnant or lactating subjects were excluded from the studies.
Height and weight were recorded with a standard stadiometer and BMI was calculated. Waist circumference was measured at the mid-way between lowest rib and iliac crest after expiration and hip circumference was measured at the greatest protrusion of the buttocks parallel to the floor. WHR was calculated. Overnight fasting blood sample was drawn for estimation of biochemical parameters. Enzyme linked Immunosorbent assay method was used for estimation of serum insulin and testosterone using Human Insulin ELISA Kit and Human testosterone ELISA kit manufactured by Diametra Italy. Serum Glucose was measured using GOD-POD (Glucose Oxidase Peroxidase) method. Homeostasis Model Assessment (HOMA) was calculated to estimate IR.
Statistical Analysis
Data were analysed using Microsoft Excel 365 Statistical plugin software and statistical package provided by www.stats.blue. Results are expressed as Mean and Standard deviation. ANOVA with Post-hoc Tukey pairwise multiple comparison test was performed to analyse any significant difference for IR among the phenotypic groups. Regression analysis was performed with data obtained. Results were considered statistically significant whenever p<0.05.
Results
Most common phenotype of PCOS encountered in this study belonged to O-HA phenotype (40.27%), followed by PCO-COM (31.94%), PCO-HA (18.75%) and PCO-O (9.02%) [Table/Fig-2].
Demographic details of study population showing the baseline data of different variables/parameters.
| Variables/Parameters | PCO-COM (n=46) Oligo or anovulation+Echographic PCOS+Hyperandrogenism | O-HA (n=58) Oligo or anovulation+Hyperandrogenism | PCO-O (n=13) Oligo or anovulation+Echographic PCOS | PCO-HA (n=27) Echographic PCOS+Hyperandrogenism |
|---|
| Age (in years) | 25.02±3.61 | 24.87±3.29 | 24.16±4.21 | 26.01±5.36 |
| Weight (in kg) | 63.94±11.65 | 66.73±10.02 | 64.91±7.65 | 62.96±12.61 |
| BMI (kg/m2) | 24.45±0.45 | 29.61±2.4 | 25.5±1.54 | 23.1±0.82 |
| Waist circumference (cm) | 94.38±1.8 | 96.84±2.44 | 80.01±1.32 | 87.41±2.91 |
| Hip circumference (cm) | 100.67±2.09 | 100.86±1.59 | 97.79±1.17 | 96.60±2.16 |
| Ovarian follicle count | 13.5±1.0 | 6.1±2.3 | 12.4±2.0 | 12.7±3.1 |
| Waist hip ratio | 0.93±0.025 | 0.96±0.025 | 0.81±0.022 | 0.90±0.038 |
| Fasting blood glucose (mg/dL) | 89.7±6.27 | 95.8±7.15 | 87.1±11.08 | 80.3±5.9 |
| Fasting insulin (μIU/mL) | 10.71±1.31 | 10.54±1.3 | 7.21±0.95 | 6.93±1.01 |
| Testosterone (ng/mL) | 0.693±0.082 | 0.691±0.081 | 0.429±0.039 | 0.69±0.059 |
Significant difference was observed for IR, WHR, BMI, and serum testosterone among the different phenotypes [Table/Fig-3]. IR was found to be maximum among O-HA phenotype (2.4±0.37) and lowest among PCO-HA phenotypes (1.3±0.22). Post-hoc Tukey pairwise multiple comparison test [Table/Fig-4] shows that difference of IR between O-HA, PCO-COM and PCO-HA, PCO-O is not significant. Overall BMI and WHR was found to be maximum among the O-HA phenotypes and lowest BMI in PCO-HA, WHR in PCO-O phenotype. Regression analysis shows that there exists a significant association between IR and BMI (t=4.96, p=0.001) as well as between IR and WHR (t=2.97, p=0.003).
Descriptive table for observed variables with ANOVA results.
| Parameters | PCO-COM (n=46) | O-HA (n=58) | PCO-O (n=13) | PCO-HA (n=27) | ANOVA |
|---|
| F | p-value |
|---|
| Insulin resistance | 2.373±0.328 | 2.497±0.374 | 1.554±0.301 | 1.372±0.222 | 92.46 | <0.001* |
| Waist hip ratio | 0.937±0.025 | 0.960±0.025 | 0.818±0.022 | 0.905±0.038 | 98.68 | <0.001* |
| BMI (kg/m2) | 24.45±0.452 | 29.613±2.408 | 25.530±1.540 | 23.1±0.828 | 130.18 | <0.001* |
| Testosterone (ng/mL) | 0.693±0.082 | 0.691±0.081 | 0.429±0.039 | 0.69±0.059 | 47.802 | <0.001* |
*Significant at p<0.05
Post-hoc multiple pairwise comparative analysis of parameters among the phenotypes of PCOS.
| Comparison | WHR (p-value) | BMI (p-value) | Testosterone (p-value) | IR (p-value) |
|---|
| (μO-HA)-(μPCO-COM) | 0.001 | 0.001 | 0.899 | 0.230 |
| (μPCO-O)-(μPCO-COM) | 0.001 | 0.167 | 0.001 | 0.001 |
| (μPCO-O)-(μO-HA) | 0.001 | 0.005 | 0.001 | 0.001 |
| (μPCO-HA)-(μPCO-COM) | 0.001 | 0.001 | 0.899 | 0.001 |
| (μPCO-HA)-(μO-HA) | 0.001 | 0.001 | 0.899 | 0.001 |
| (μPCO-HA)-(μPCO-O) | 0.001 | 0.001 | 0.001 | 0.365 |
S*=Significant difference at p<0.05; NS: Non-significant difference at p≥0.05
Discussion
The scope of this study was to illuminate the pattern of IR among the different phenotypes of PCOS as per Rotterdam Criteria. Our results do show there are significant differences in IR among the four phenotypes. The pattern of IR observed in decreasing order can be expressed as O-HA>PCO-COM>PCO-O>PCO-HA [Table/Fig-5]. O-HA and PCO-COM both phenotypes show higher IR than the rest of the groups and it is concurrent with the other previous studies [15]. In another study, it was observed that the IR is significantly high in full blown PCOS (PCO-COM) patients compared to O-HA phenotype contrary to our observation [16]. Insulin maintains the glucose homeostatsis primarily increasing glucose uptake by target tissues which includes adipose tissues [17], cardiac muscle and skeletal muscle tissues. Insulin prevents lipolysis and thereby, decrease circulating free fatty acids. It has been observed that the number of subcutaneous adipocytes increase in both lean and obese PCOS patients [18]. It is also reported that the number of beta subunits of insulin receptors decrease in visceral adipocytes. It is assumed that the structural change may affect the glucose transport by altered post receptor events such as decrease in expression of Glucose Transporter Type 4 (GLUT 4) in adipocytes [19]. This may suggest the reason for IR in lean PCOS patients [20]. Prenatal androgen exposure and overexposure due to genetic predisposition during growth phase may influence the various hormonal axes leading to development of central obesity and metabolic derangements [21]. Androgens by its effect on skeletal tissues and adipocytes influence the insulin action by alteration in adipokine secretion and increase visceral adipose tissue and thus, increase the IR more [20]. As previously mentioned IR followed by hyperinsulinemia induced hyperandrogenemia turns into a vicious cycle in these PCOS patients.
Patterns observed for different parameters among the PCOS phenotypes.
| Parameters | Patterns observed |
|---|
| Insulin Resistance (HOMA-IR) | O-HA>PCO-COM>PCO-O>PCO-HA |
| Waist Hip Ratio (WHR) | O-HA>PCO-COM>PCO-HA>PCO-O |
| Body Mass Index (BMI) | O-HA>PCO-O>PCO-COM>PCO-HA |
| Testosterone | PCO-COM>O-HA>PCO-HA>PCO-O |
Abnormal fat distribution and IR are two prominent features of PCOS. There are conflicting observations with respect to abnormal fat distribution among lean PCOS and obese PCOS of different ethnicity citing significant and non significant differences [22]. BMI and WHR both were observed maximum for O-HA phenotype showing android type of fat distribution. In the present study, it was observed that three of the phenotypes (PCO-COM, O-HA and PCO-HA) with higher testosterone showed android type fat distribution. Despite having the higher BMI, sex specific fat distribution is observed in non hyperandrogenic PCO-O phenotype. Interestingly lowest BMI was observed in PCO-HA phenotype with android fat distribution. Exposure to higher testosterone level may modify the body fat distribution in these phenotypes. Sex difference in androgen action has been noticed as androgens (testosterone) reduces visceral adipocity in males [23], but it contributes in opposite manner in females [24]. The effect may be mediated by altering sensitivity of insulin in site specific adipocytes [25] and by altering the adipokines secretion [26]. It is observable from this study that irrespective of BMI, truncal obesity is common to the phenotypes with hyperandrogenemia. It was observed that the prevalence of diabetes, atherosclerosis, hypertension appears to be higher in the women with android obesity [27].
Overall WHR, BMI and testosterone was found to be positively associated with IR. BMI and WHR were found to be independently associated with IR. Evidence also suggest that testosterone correlate with IR, but the role of hyperandrogenism causing IR or vice versa are still controversial [28-30]. It has also been suggested that testosterone may play the role via the Cytosine-Adenine-Guanine (CAG) polymorphism within Androgen receptors [30]. Complicated inter-relationship between body fat, hyperandrogenism and IR makes the task difficult to identify the role of each component.
This study suggests that the presentation of PCOS is heterogenous with respect to IR, testosterone, fat distribution and BMI. Comparison of IR among the four phenotypes with their obesity pattern would surely be beneficial for the treating doctors to choose the treatment protocol in better way to reduce the disease burden.
Limitation(s)
Small sample size and regional subject pool were the limitations for this study. Due to regional sample pool the study explores the data regarding semiurban Indian patients and cannot focus on the ethnic diversities.
Conclusion(s)
Phenotypes O-HA and PCO-COM both tend to show the higher IR and testosterone level among all PCOS phenotypes. Though both phenotypes show androgenic fat distribution, significant difference in BMI and WHR was observed. On the contrary PCO-O phenotype shows gynoid pattern of fat distribution despite having appreciably higher BMI. Thus, it may be assumed that the phenotype O-HA and PCO-COM both are more predisposed to MS and other cardiometabolic consequences. Phenotypic division of PCOS patients may be of help to understand the phenotype specific pathophysiology of PCOS and thereby, designing the treatment protocol to minimise the deleterious co-morbidities associated with PCOS.
*Significant at p<0.05
S*=Significant difference at p<0.05; NS: Non-significant difference at p≥0.05
Author Declaration:
Financial or Other Competing Interests: None
Was Ethics Committee Approval obtained for this study? Yes
Was informed consent obtained from the subjects involved in the study? Yes
For any images presented appropriate consent has been obtained from the subjects. NA
Plagiarism Checking Methods: [Jain H et al.]
Plagiarism X-checker: Mar 09, 2021
Manual Googling: May 17, 2021
iThenticate Software: May 27, 2021 (9%)
[1]. Balen AH, Conway GS, Kaltsas G, Techatrasak K, Manning PJ, West C, Polycystic ovary syndrome: The spectrum of the disorder in 1741 patientsHum Reprod 1995 10(8):2107-11. [Google Scholar]
[2]. Balen A, Michelmore K, What is polycystic ovary syndrome? Are national views important?Hum Reprod 2002 17(9):2219-27. [Google Scholar]
[3]. Shroff R, Syrop CH, Davis W, Van Voorhis BJ, Dokras A, Risk of metabolic complications in the new PCOS phenotypes based on the Rotterdam criteriaFertil Steril 2007 88(5):1389-95. [Google Scholar]
[4]. Kar S, Anthropometric, clinical, and metabolic comparisons of the four Rotterdam PCOS phenotypes: A prospective study of PCOS womenJ Hum Reprod Sci 2013 6(3):194-200.10.4103/0974-1208.12142224347934 [Google Scholar] [CrossRef] [PubMed]
[5]. Barber TM, McCarthy MI, Wass JAH, Franks S, Obesity and polycystic ovary syndromeClin Endocrinol (Oxf) 2006 65(2):137-45.10.1111/j.1365-2265.2006.02587.x16886951 [Google Scholar] [CrossRef] [PubMed]
[6]. Anderson AD, Solorzano CMB, McCartney CR, Childhood obesity and its impact on the development of adolescent PCOSSemin Reprod Med 2014 32(3):202-13.10.1055/s-0034-137109224715515 [Google Scholar] [CrossRef] [PubMed]
[7]. Apridonidze T, Essah PA, Iuorno MJ, Nestler JE, Prevalence and characteristics of the metabolic syndrome in women with polycystic ovary syndromeJ Clin Endocrinol Metab 2005 90(4):1929-35.10.1210/jc.2004-104515623819 [Google Scholar] [CrossRef] [PubMed]
[8]. Reaven G, Insulin resistance and compensatory hyperinsulinemia: The linchpin between obesity and cardiovascular diseaseOfficial Journal of the Chair on Cardiometabolic Risk 2008 1(2):03-10. [Google Scholar]
[9]. Rojas J, Bermúdez V, Leal E, Insulinorresistencia e hiperinsulinemia como factores de riesgo para enfermedad cardiovascularArchivos Venezolanos de Farmacología y Terapéutica 2008 27(1):29-39. [Google Scholar]
[10]. Sekar N, Garmey JC, Veldhuis JD, Mechanisms underlying the steroidogenic synergy of insulin and luteinizing hormone in porcine granulosa cells: Joint amplification of pivotal sterol-regulatory genes encoding the low-density lipoprotein (LDL) receptor, steroidogenic acute regulatory (stAR) protein and cytochrome P450 side-chain cleavage (P450scc) enzymeMol Cell Endocrinol 2000 159(1-2):25-35.10.1016/S0303-7207(99)00203-8 [Google Scholar] [CrossRef]
[11]. Morley P, Calaresu FR, Barbe GJ, Armstrong DT, Insulin enhances luteinizing hormone-stimulated steroidogenesis by porcine theca cellsBiol Reprod 1989 40(4):735-43.10.1095/biolreprod40.4.7352473786 [Google Scholar] [CrossRef] [PubMed]
[12]. Kim HH, DiVall SA, Deneau RM, Wolfe A, Insulin regulation of GnRH gene expression through MAP kinase signaling pathwaysMol Cell Endocrinol 2005 242(1-2):42-49.10.1016/j.mce.2005.07.00216144737 [Google Scholar] [CrossRef] [PubMed]
[13]. Alesci S, Koch CA, Bornstein SR, Pacak K, Adrenal androgens regulation and adrenopauseEndocrine Regulations 2001 35(2):95-100. [Google Scholar]
[14]. Dunaif A, Book CB, Insulin Resistance in the Polycystic Ovary Syndrome. In: Draznin B, Rizza R, editorsClinical Research in Diabetes and Obesity 1997 Totowa, NJHumana Press:249-74.10.1007/978-1-4757-3906-0_14 [Google Scholar] [CrossRef]
[15]. Panidis D, Tziomalos K, Misichronis G, Papadakis E, Betsas G, Katsikis I, Insulin resistance and endocrine characteristics of the different phenotypes of polycystic ovary syndrome: A prospective studyHum Reprod 2012 27(2):541-49.10.1093/humrep/der41822144419 [Google Scholar] [CrossRef] [PubMed]
[16]. Sachdeva G, Gainder S, Suri V, Sachdeva N, Chopra S, Comparison of the different PCOS phenotypes based on clinical metabolic, and hormonal profile, and their response to clomipheneIndian J Endocrinol Metab 2019 23(3):326-31.10.4103/ijem.IJEM_30_1931641635 [Google Scholar] [CrossRef] [PubMed]
[17]. Groop LC, Bonadonna RC, Simonson DC, Petrides AS, Shank M, DeFronzo RA, Effect of insulin on oxidative and nonoxidative pathways of free fatty acid metabolism in human obesityAm J Physiol 1992 263:E79-84.10.1152/ajpendo.1992.263.1.E791636701 [Google Scholar] [CrossRef] [PubMed]
[18]. Dunaif A, Segal KR, Shelley DR, Green G, Dobrjansky A, Licholai T, Evidence for distinctive and intrinsic defects in insulin action in polycystic ovary syndromeDiabetes 1992 41:1257-66.10.2337/diab.41.10.12571397698 [Google Scholar] [CrossRef] [PubMed]
[19]. Seow KM, Juan CC, Hsu YP, Hwang JL, Huang LW, Ho LT, Amelioration of insulin resistance in women with PCOS via reduced insulin receptor substrate-1 Ser312 phosphorylation following laparoscopic ovarian electrocauteryHuman Reproduction 2007 22:1003-10.10.1093/humrep/del46617204522 [Google Scholar] [CrossRef] [PubMed]
[20]. Kandarakis E, Dunaif A, Insulin resistance and the polycystic ovary syndrome revisited: An update on mechanisms and implicationsEndocrine Reviews 2012 33(6):981-1030.10.1210/er.2011-103423065822 [Google Scholar] [CrossRef] [PubMed]
[21]. Franks S, Berga SL, Does PCOS have developmental origins?Fertility and Sterility 2012 97:02-06.10.1016/j.fertnstert.2011.11.02922192134 [Google Scholar] [CrossRef] [PubMed]
[22]. Satyaraddi A, Cherian KE, Kapoor N, Kunjummen AT, Kamath MS, Thomas N, Body composition, metabolic characteristics, and insulin resistance in obese and nonobese women with polycystic ovary syndromeJ Hum Reprod Sci 2019 12:78-84.10.4103/jhrs.JHRS_2_1931293320 [Google Scholar] [CrossRef] [PubMed]
[23]. Mårin P, Krotkiewski M, Björntorp P, Androgen treatment of middle-aged, obese men: Effects on metabolism, muscle and adipose tissuesEur J Med 1992 1:329-36. [Google Scholar]
[24]. Elbers JM, Asscheman H, Seidell JC, Megens JA, Gooren LJ, Long-term testosterone administration increases visceral fat in female to male transsexualsJ Clin Endocrinol Metab 1997 82:2044-47.10.1210/jc.82.7.2044 [Google Scholar] [CrossRef]
[25]. Arner P, Effects of testosterone on fat cell lipolysis. Species differences and possible role in polycystic ovarian syndromexsBiochimie 2005 87:39-43.10.1016/j.biochi.2004.11.01215733735 [Google Scholar] [CrossRef] [PubMed]
[26]. Xu A, Chan KW, Hoo RL, Wang Y, Tan KC, Zhang J, Testosterone selectively reduces the high molecular weight form of adiponectin by inhibiting its secretion from adipocytesJ Biol Chem 2005 280:18073-80.10.1074/jbc.M41423120015760892 [Google Scholar] [CrossRef] [PubMed]
[27]. Vague J, The degree of masculine differentiation of obesities: A factor determining predisposition to diabetes, atherosclerosis, gout, and uric calculous diseaseAm J Clin Nutr 1956 4(1):20-34.10.1093/ajcn/4.1.2013282851 [Google Scholar] [CrossRef] [PubMed]
[28]. Dunaif A, Insulin resistance and the polycystic ovary syndrome: Mechanism and implications for pathogenesisEndocr Rev 1997 18(6):774-800.10.1210/er.18.6.7749408743 [Google Scholar] [CrossRef] [PubMed]
[29]. Franks S, Polycystic ovary syndromeN Engl J Med 1995 333(13):853-61.10.1056/NEJM1995092833313077651477 [Google Scholar] [CrossRef] [PubMed]
[30]. Möhlig M, Jürgens A, Spranger J, Hoffmann K, Weickert MO, Schlösser HW, The androgen receptor CAG repeat modifies the impact of testosterone on insulin resistance in women with polycystic ovary syndromeEur J Endocrinol 2006 155(1):127-30.10.1530/eje.1.0219516793958 [Google Scholar] [CrossRef] [PubMed]