Worldwide, in patients with end stage renal disease, kidney transplantation is the most apt form of renal replacement for both improving the quality of life and reducing the cost of treatment as compared to dialysis. When compared to cadaveric and non-heart beating donors, kidney harvested from live donors perform better. This could be ascribed to lesser ischaemic times [1-5]. However this does not confer improved recipient survival despite better graft function [6]. The overall mortality has been reported as 0.03%-0.06% in a study on 3000 to 10,000 kidney donors in the United states. [7]. It should always be remembered that the donor would be undergoing a major surgery especially for the benefit of another individual with a chronic debilitating illness.
With only 2% of kidney transplants from deceased donors out of 3000 kidney transplants done every year, living donor kidney transplant remains the main workhorse for renal replacement [8]. There, however remains the constraint of apprehension about quality of life with solitary kidney and exposure to a major surgery among the kidney donors. As per the latest reports there is increased risk of End-Stage Renal Disease (ESRD) in donors and possibly an increase in mortality due to cardiac events [9,10]. Moreover, despite being screened stringently some donors will develop hypertension later and may have higher risk of developing diabetes mellitus [11,12].
Minimising these risks thus becomes one of the most key issues in kidney donation. A healthy donor with healthy renal functions is important to achieve the same and to ensure this a preoperative evaluation of the kidney donor is an essential first step. The ideal test considered for assessment of overall renal function is measurement of Glomerular Filtration Rate (GFR) [13]. Assessment of kidney function should be accurate, cost effective and safe. GFR estimation using creatinine clearance which utilised 24 hours urine collection, was most widely used technique of donor evaluation. However, Urine-CrCl has insufficiencies like errors in urine collection and tubular secretion of creatinine [14,15]. Other methods of assessing GFR is measurement of clearance of exogenous substances such as inulin, chromium-51-Ethylenediaminetetraacetic Acid (EDTA), iohexol, 99mTc-DTPA or I-125 labelled iothalamate [16].
In voluntary kidney donors, GFR value remains the most important measure for early identification of deteriorating renal function. So, an important question would be, how well do these methods correlate? This study was undertaken to correlate some widely used methods of GFR estimation namely formula based CG method, 24 hours urine-CrCl with 99mTc-DTPA renography as reference in kidney donors before and after donor nephrectomy.
In kidney donors, there is compensatory hyper function of remaining kidney postdonation. The successive changes that occur in remaining kidney after donor nephrectomy, have not been sufficiently studied using radionuclide technique. Therefore, we compared the pre and early postdonation 99mTc-DTPA GFR of remaining kidney in the same individuals within a limited time frame to find out the compensatory increase in GFR.
Materials and Methods
A prospective longitudinal cohort study was conducted in the Department of Urology, Nephrology and Nuclear Medicine at a Tertiary care hospital in New Delhi from November 2016 to March 2018 on living related kidney donors with follow-up at 1 and 3 months after kidney donation. The study was initiated after obtaining permission from the Institutional Ethics Committee, Army Hospital (R&R), Delhi Cantt (IEC Regn No. 61/2016). A written informed consent was taken from all the participants.
Inclusion criteria: All voluntary kidney donors who were worked up, found suitable and underwent donor nephrectomy were included.
Exclusion criteria: Donors with preexisting renal disease or any other co-morbidities such as diabetes, hypertension or obesity were excluded from the study. Those kidney donors who were either lost to follow-up or who refused or failed to give informed consent to participate in the study were excluded.
Sample size calculation
Parameter of interest: GFR value by different methods
The formula used is as under:
n=(σ12+σ22) (Zα+Zβ)2/(m1-m2)2Where,
Zα=Value of standard normal variate corresponding to α level of significance
Zβ=The standard normal deviate for desired power
m=Average
σ=Standard deviation
Assumptions
Z1-α/2=1.96 (corresponding to 0.05 level of significance)
Zβ=0.84 (corresponding to 80% power)
From the study by Kumar AVSA et al., on correlation of different methods of GFR estimation in patients of diabetic nephropathy [18]. With the above assumptions, the sample size for 95% confidence level and 80% power for different comparison group works out as below: Due to single centre study, limited time frame and assuming the lost to follow-up up to 10%, the minimum sample size for 95% confidence level and 80% power works out to 50 [Table/Fig-1a,b].
Variables used in sample size calculation.
| Parameters | 99mTc-DTPA | Creatinine clearance (CrCl) | Cockcroft-gault (CG) |
|---|
| Mean (m) | 63.24 | 43.06 | 54.87 |
| Standard deviation (σ) | 22.39 | 13.83 | 18.25 |
Variables used in sample size calculation.
| Comparison between | Sample size (n) |
|---|
| 99mTc-DTPA Renogram Vs. Creatinine clearance (CC) | 13 |
| 99mTc-DTPA Renogram Vs. Cockcroft-Gault (CG) | 93 |
| Creatinine clearance (CC) Vs. Cockcroft-Gault (CG) | 29 |
| Average | 45 |
Measurement of GFR by DTPA renogram (99mTc-DTPA GFR) with split renal function was conducted on E-Cam, Dual Head SPECT GC. GFR assessment by 99mTc-DTPA renography was done using Gates’ protocol [17]. 99mTc-DTPA was prepared using a fresh elute and a DTPA kit supplied by Board of Radioisotope Technology, Mumbai 30-60 min before injection.
Study Procedure
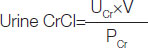
All study participants were asked to collect 24-hour urine in a container without any preservative. The collected urine was sent to the lab and the GFR (based on 24 h urine creatinine clearance) was calculated on the basis of urine creatinine values. Urine creatinine clearance was calculated using (UV/P) formula, where U is the concentration of creatinine in urine in mg/dL and V is the volume of urine produced per minute and P is the plasma creatinine in mg/dL.
An average of two 24-hour urine-CrCls was taken for final calculation.
A marker which is commonly used to estimate creatinine clearance is the Cockcroft-Gault (CG) formula, which estimates GFR in mL/min. It is named after the scientists who developed it and it uses serum creatinine and a patient’s body weight to predict the creatinine clearance [19,20].

The CG equation corrected for GFR was calculated according to equation:
CG·GFR·estimate·[21]=0.84×CG·CrCl
The results of the 24-hour urine-CrCl, CG equation, CG equation corrected for GFR and 99mTc-DTPA GFR were corrected to BSA of 1.73 m2 (1.73/BSA).
On follow-up visit at 30 days, every kidney donor underwent general physical examination and was evaluated for renal function by means of Serum creatinine. On next follow-up visit at 90 days, all kidney donors underwent general physical examination and evaluation of renal function by means of DTPA renography, CG CrCl, CG GFR and 24 hour urine-CrCl corrected for BSA.
The predictive capabilities of GFR estimation by CG equation, CG equation corrected for GFR and 24-hour urine-CrCl corrected for BSA, for both predonation and postdonor nephrectomy at 90 days, were assessed and further compared with 99mTc-DTPA-GFR as reference GFR. To evaluate the compensatory hyperfunction of retained kidney after donor nephrectomy, we compared the 99mTC-DTPA GFR of the retained kidney after nephrectomy with the value of split 99mTC-DTPA GFR of the same kidney before nephrectomy.
Statistical Analysis
Patient profiling was done based on various demographic, clinical and laboratory parameters. The square of the correlation coefficient (R2) between estimated GFR and measured GFR was used to express the precision of the equations. Simple linear regression analysis was used to obtain the R2 statistic. For GFR estimate, a graph was constructed by plotting the difference between the estimated and measured GFR against their mean with 95% limits of agreement between ±2SD. Individual quantitative parameters were compared using Student t test. For the normally distributed GFR data, Pearson’s correlation coefficient was also calculated (p-value <0.05 was taken as a significant). Statistical Package for the Social Sciences (SPSS), version 24.0, software and MS Excel were used for analysis.
Results
A total of 50 subjects were included in the study. The age of the donors varied from 25 years to 62 years. The demographic characteristics are summarised in the [Table/Fig-2].
Base line characteristics of the study population.
| Variables | Frequency (%) |
|---|
| Male/Female (%) | 12/38 (24/76%) |
| Age (years) (Mean±SD) | 44.34±9.51 (25-62) |
| BMI (Kg/m2) (Mean±SD) | Prekidney donation | 23.43±2.63 (18.5-32.4) |
| Postkidney donation | 23.7±2.3 (19-31.1) |
| BSA (m2) (Mean±SD) | Prekidney donation | 1.62±0.13 (1.35-1.92) |
| Postkidney donation | 1.63±0.12 (1.38-1.87) |
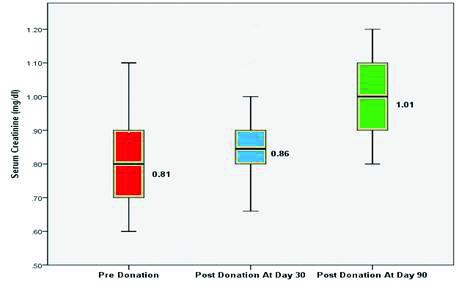
Out of 50 kidney donors, 43 individuals donated the left kidney and 07 individuals donated the right kidney. The mean serum creatinine was 0.81±0.11 mg/dL before kidney donation. The mean serum creatinine increased to 0.86±0.10 mg/dL and 1.01±0.12 mg/dL at 30 and 90 days postdonation respectively which was statistically significant (p-value <0.0001) as compared to serum creatinine predonation as depicted in [Table/Fig-3].
Serum creatinine at different time point.
There was no significant variation in Serum creatinine and DTPA GFR values in different age groups as shown in [Table/Fig-4].
Serum creatinine and DTPA GFR as per the age.
| Predonation | Age (years) | p-value |
|---|
| <35 (n=6) | 35-40 (n=6) | >45 (n=22) |
|---|
| Serum creatinine | 0.88±0.15 | 0.82±0.11 | 0.78±0.1 | 0.103 |
| DRPA GFR (mL/min/1.73 m2) | 99.1±18.8 | 92.5±13.1 | 91.3±10.8 | 0.422 |
The mean GFR measured by 99mTc-DTPA scan was 97.3±16.5 mL/min/1.73 m2 in males and 91.4±11.4 mL/min/1.73 m2 in females which was not statistically significant (p-value <0.05) as depicted in [Table/Fig-5].
DTPA GFR as per gender, student t-test.
| Method | Gender mean±sd | p-value |
|---|
| Male (n=12) | Female (n=38) |
|---|
| DTPA GFR (mL/min/1.73m2) | 97.3±16.5 | 91.4±11.4 | 0.169 |
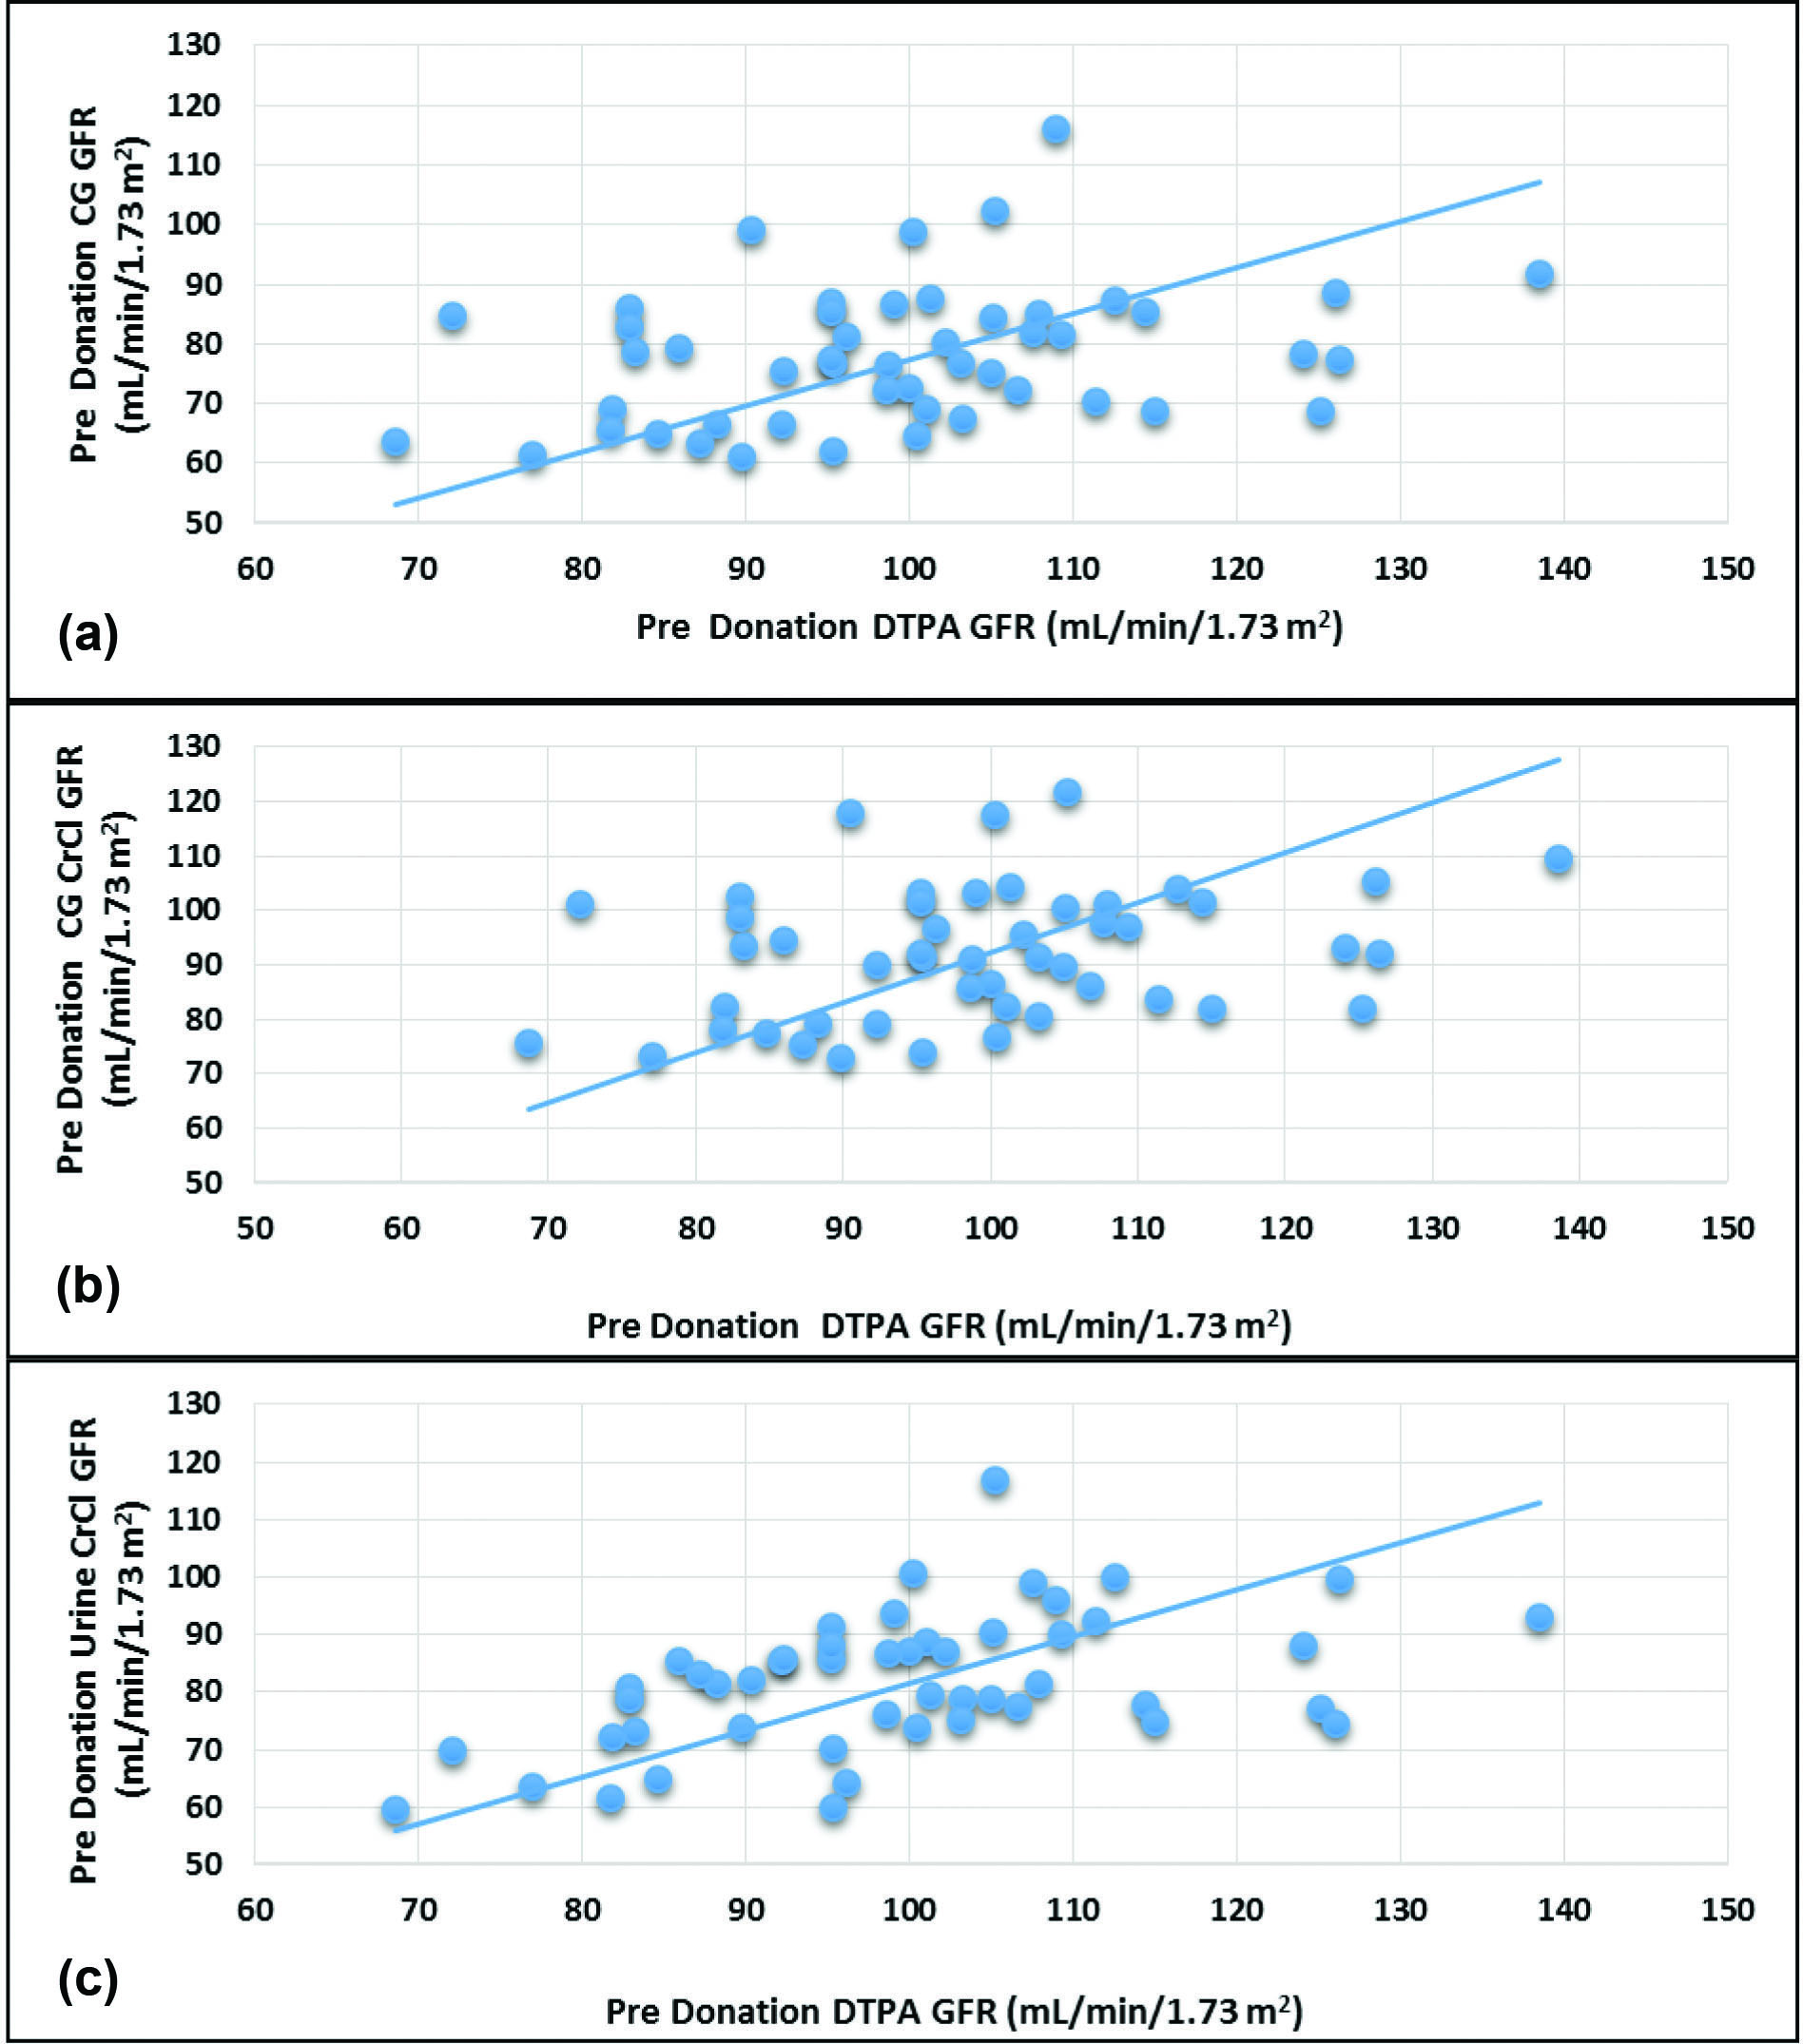
Scatter Plots: Predonation
All the equations fared poorly when compared to DTPA GFR. The Urine-CrCl (r=0.480, p=0.032) correlated better than CG CrCl and CG-GFR (r=0.304, p<0.001) as depicted in [Table/Fig-6a-c].
Scatterplots of predonation Glomerular Filtration Rate (GFR) values of 99mTc DTPA versus 24 h urine creatinine clearance, 99mTc DTPA versus Cockcroft-Gault and 99mTc DTPA versus Cockcroft-Gault corrected for GFR.
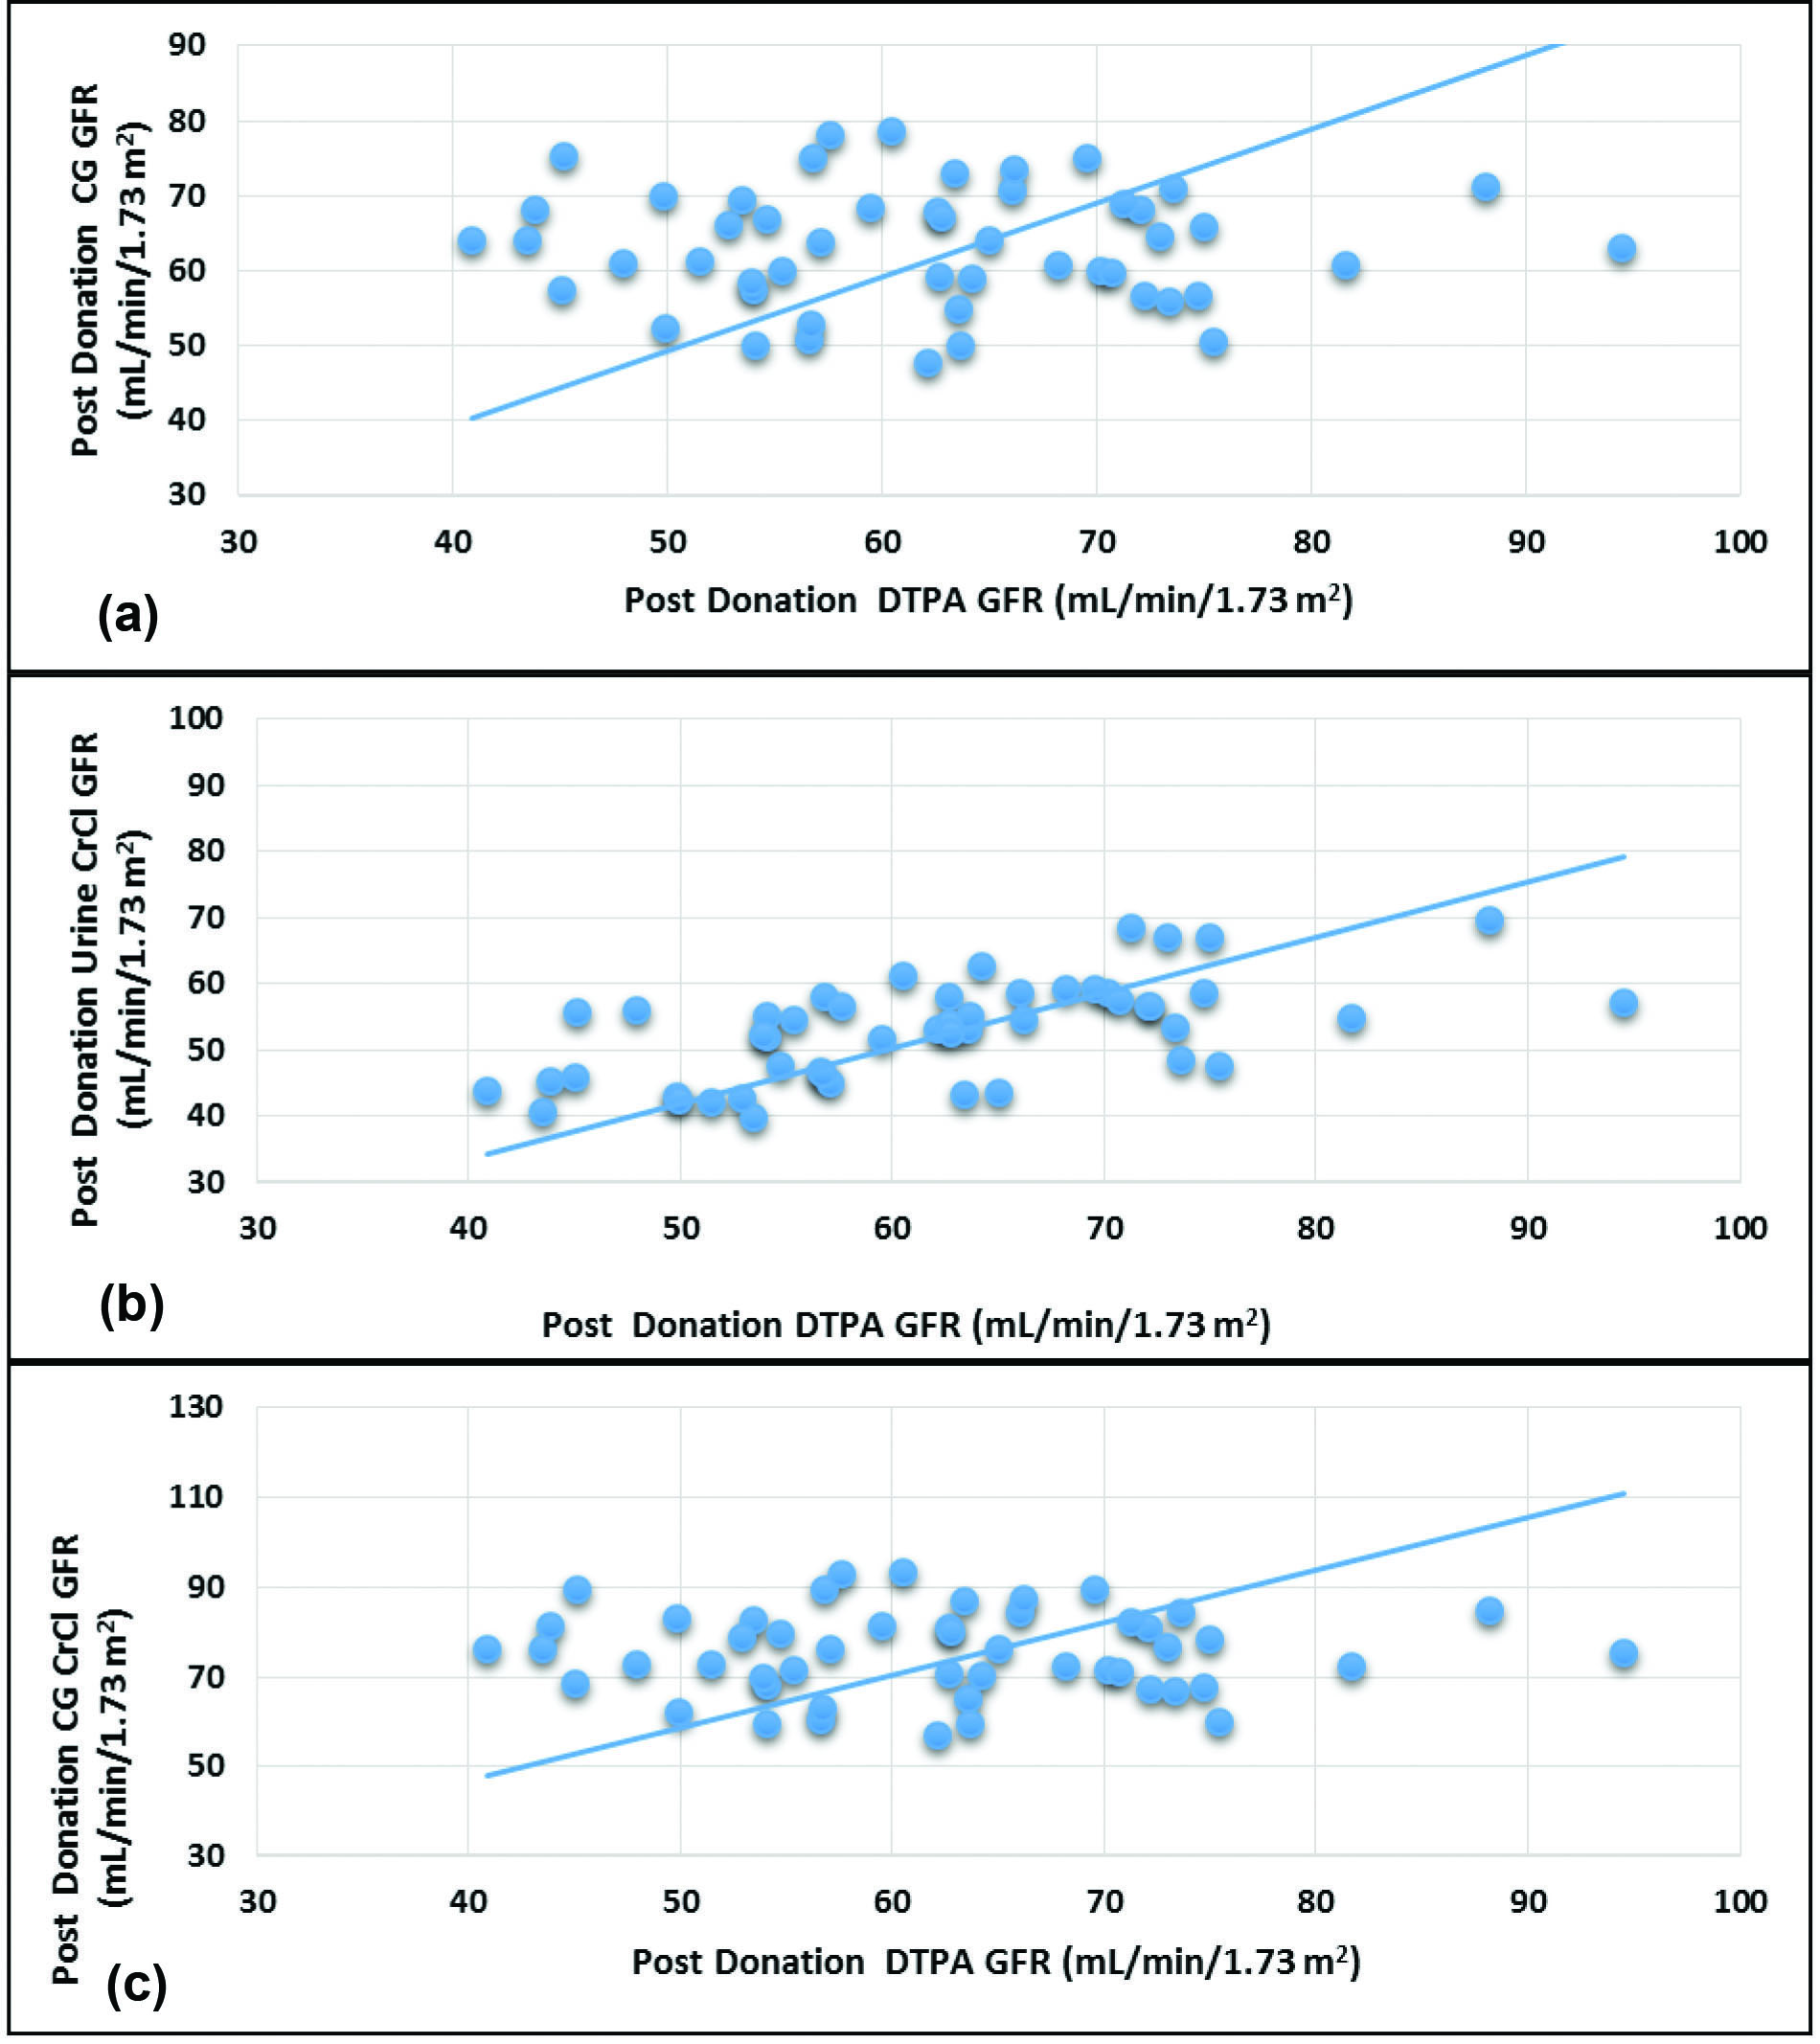
Scatter Plots: Postdonation
The correlation between the DTPA GFR and Urine-CrCl was good (r=0.600, p<0.0001) whereas there was no correlation with CG CrCl and CG-GFR (r=-0.002, p=0.991) as depicted in [Table/Fig-7a-c].
Scatterplots of postdonation Glomerular Filtration Rate (GFR) values of 99mTc DTPA versus 24 h urine creatinine clearance, 99mTc DTPA versus Cockcroft-Gault (CG) and 99mTc DTPA versus Cockcroft-Gault (CG) corrected for GFR.
Bland Altman Plots: Pre and Postdonation
Graphic technique developed by Bland and Altman was used to demonstrate the differences between eGFR and mGFR. These figures exhibit the span between +1.96 and -1.96 SD of the mean difference (limit of agreement), representing 95% CI.
Plots of the differences between eGFR and mGFR against their mean are shown in [Table/Fig-8a-c]. The large scattering of the data in all the equations, emphasises the poor agreement of each predictive equation with DTPA-GFR.
Bland-Altman plot of predonation Glomerular Filtration Rate (GFR) values of 99mTc DTPA versus 24 h urine creatinine clearance, 99mTc DTPA versus Cockcroft-Gault (CG) and 99mTc DTPA versus Cockcroft-Gault (CG) corrected for GFR with 95% limits of agreement.
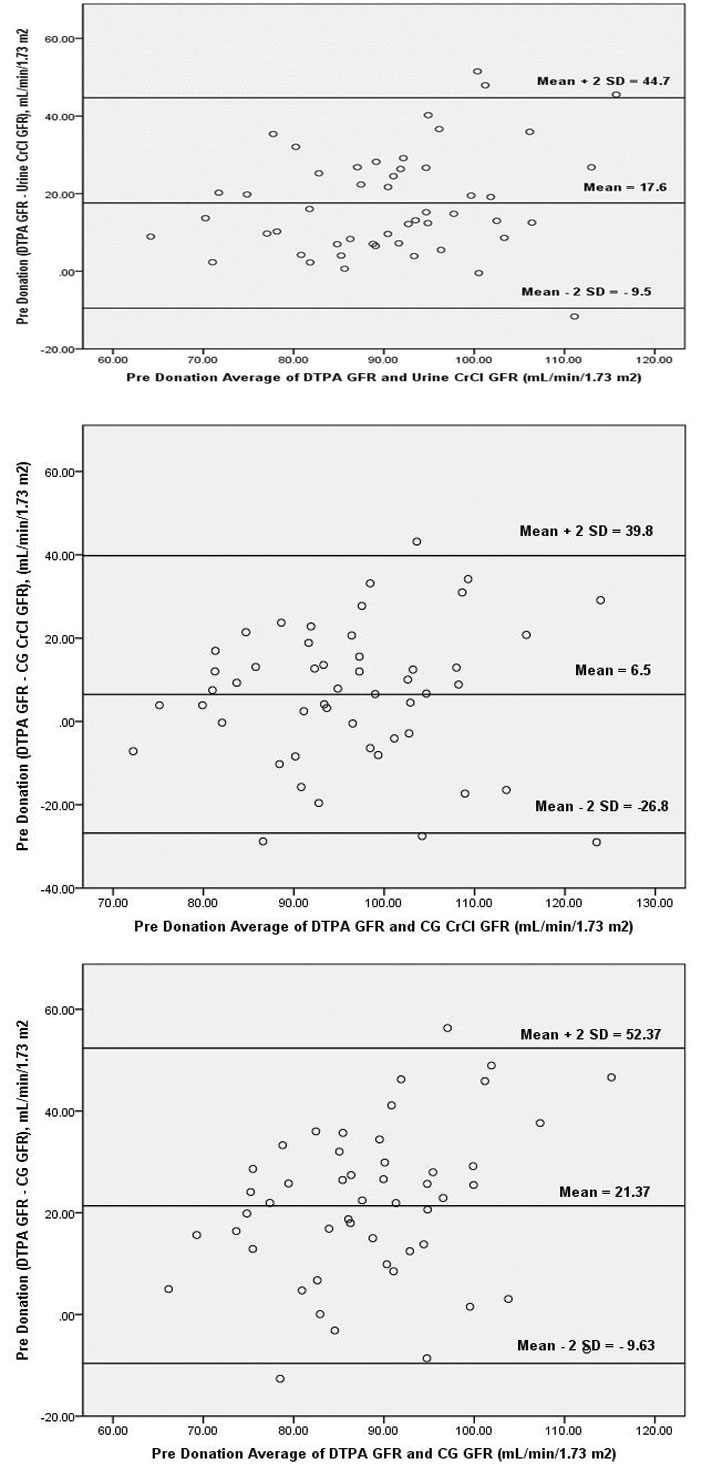
Inspecting the Bland-Altman plot of urine-CrCl, CG CrCl and CG GFR revealed that the ±2 SD interval was smaller for urine-CrCl (range, 44.7 unit to -9.5 unit) as compared to CG CrCl (range, 39.8 unit to -26.8 unit) and CG GFR (range, 52.37 unit to -9.63 unit).
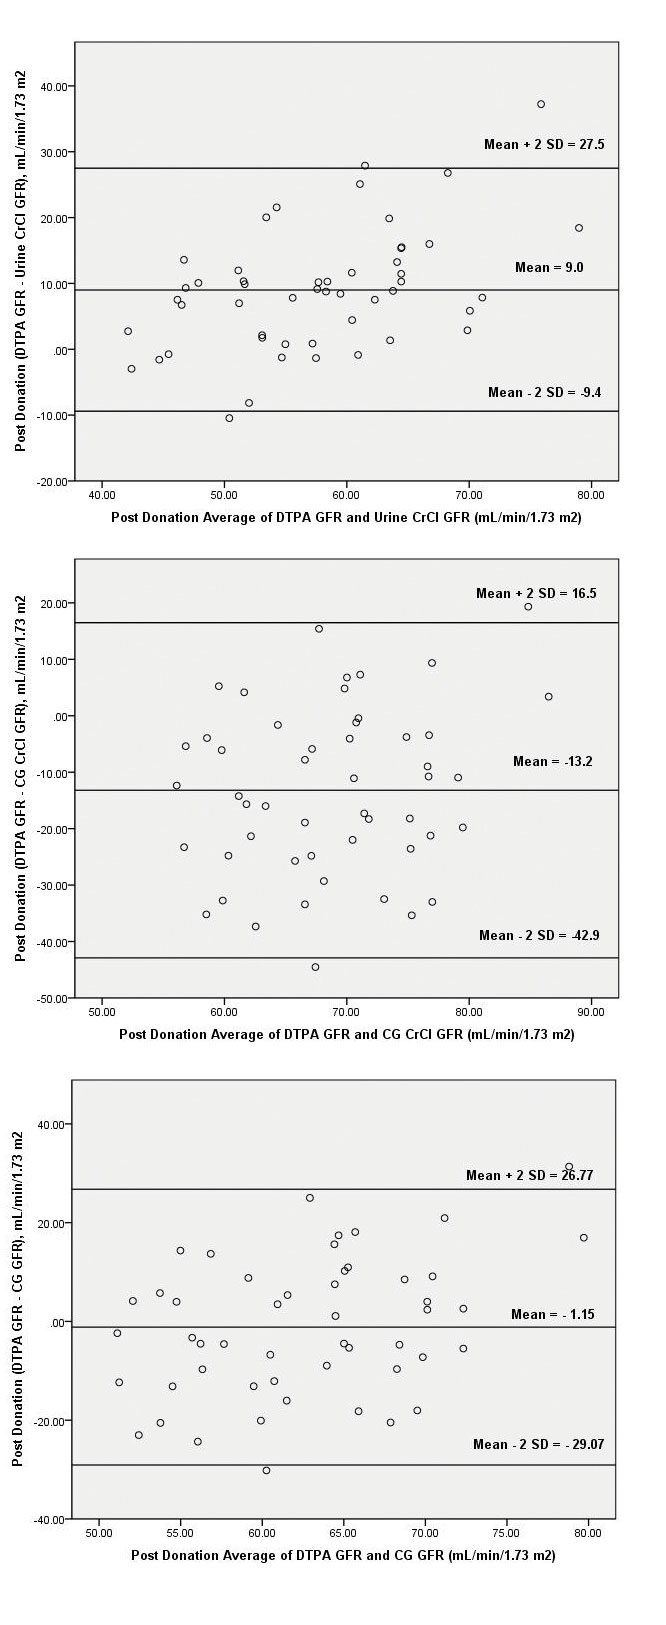
Pattern similar to predonation was found after kidney donation, the urine-CrCl, CG CrCl and CG GFR equations though all had poor correlation, the urine-CrCl had relatively better prediction power in terms of R2. Inspecting the Bland-Altman plot [Table/Fig-9a-c] of urine-CrCl, CG CrCl and CG GFR revealed that the ±2SD interval was smaller for urine-CrCl (range, 27.5 unit to -9.4 unit) as compared to CG CrCl (range, 16.5 unit to -42.9 unit) and CG GFR (range, 26.77 unit to -29.07).
Bland-Altman plot of postdonation Glomerular Filtration Rate (GFR) values of 99mTc DTPA versus 24 hour urine creatinine clearance, 99mTc DTPA versus Cockcroft-Gault (CG) and 99mTc DTPA versus Cockcroft-Gault (CG) corrected for GFR with 95% limits of agreement.
Glomerular Filtration Rate Estimation: Pre and Postdonation
The mean GFR measured by 99mTc-DTPA scan was 99.47±14.4 mL/min/1.73 m2. The mean GFR estimated by CG equation, 24-hour urine creatinine clearance and CG equation corrected for GFR were 92.99±13.7 mL/min/1.73 m2, 81.90±11.7 mL/min/1.73 m2 and 78.10±11.55 mL/min/1.73 m2 respectively as depicted in [Table/Fig-10]. All the predicting equations underestimated the GFR as compared to GFR measured by 99mTc DTPA.
Comparison of GFR by different methods Pre and Postdonation.
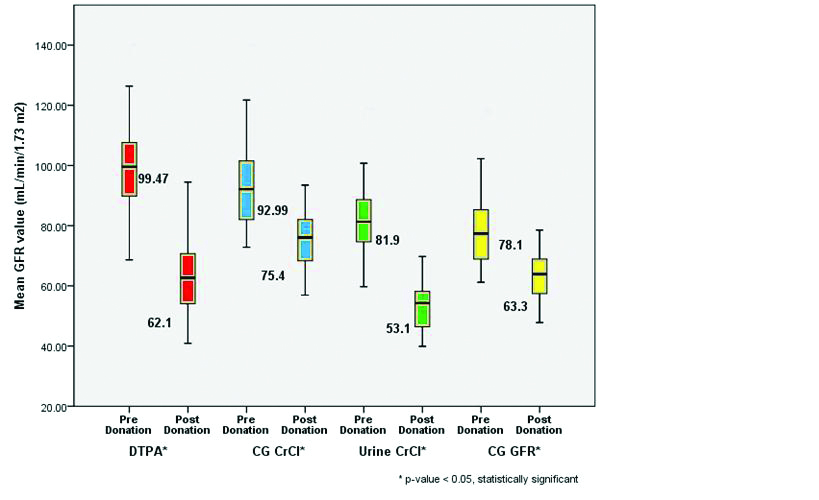
The mean GFR measured by 99mTc-DTPA scan 90 days after kidney donation was 62.1±11.5 mL/min/1.73 m2. The mean GFR estimated by CG equation, 24 Hour urine creatinine clearance and CG corrected for GFR were 75.4±9.4 mL/min/1.73 m2, 53.1±7.5 mL/min/1.73 m2 and 63.30±7.89 mL/min/1.73 m2 respectively as depicted in [Table/Fig-10]. The GFR estimated by CG equation and CG corrected for GFR overestimated the GFR measured by 99mTc-DTPA scan whereas GFR estimated by 24 Hour urine creatinine clearance underestimated the GFR measured by 99mTc-DTPA scan.
There was significant fall in GFR (p-value <0.0001*) postkidney donation by paired student t-test as depicted in [Table/Fig-9].
Compensatory Hyperfunction of the Retained Kidney after Nephrectomy
The mean split DTPA GFR of single kidney predonation was 51.35±8.22 mL/min/1.73 m2 which increased to 62.15±11.5 mL/min/1.73 m2 after kidney donation. The mean increase in 99mTc DTPA GFR of remaining kidney was 21.2 % which was statistically significant as shown in [Table/Fig-11].
Mean increase in GFR (mL/min/1.73 m2) of retained kidney after kidney donation.
| Parameters | Predonation (mL/min/1.73 m2) | Postdonation (mL/min/1.73 m2) | Percentage change (%) | p-value |
|---|
| Mean DTPA (Rt) Kidney (n=43) | 51.05±8.09 | 62.23±11.75 | 22.35 | <0.0001* |
| Mean DTPA (Lt) Kidney (n=7) | 53.17±9.44 | 61.63±10.57 | 16.04 | 0.041* |
| Mean DTPA (n=50) | 51.35±8.22 | 62.15±11.50 | 21.2 | <0.0001* |
DTPA=99mTc-Diethylenetriaminepentaacetic acid GFR estimation, Paired student t-test
Discussion
Preliminary renal function of the kidney donor significantly effects the long-term health of the donor as well as its functioning in the recipient. Filtration marker such as 99mTc-DTPA are precise and accurate in measuring GFR. However, the logistics and cost of GFR measurement using DTPA, preclude its widespread use in developing nations such as ours. This has led to development of various equations for GFR estimation based on serum creatinine, age, gender and body habitus [21].
The mean BSA predonation in the present study was 1.62±0.13 m2 similar to the findings observed by Zhao WY et al., [21] (1.65±0.14 m2) however slightly higher than findings observed by Mahajan S et al., (1.52±0.21 m2) and Chaurasia RK et al., (1.53±0.16 m2) in their study on kidney donors [22,23]. In contrast to present study the mean BSA in a study on European population as reported by Lin J et al., was 1.9±0.2 m2 [24]. This can be explained by difference in the anthropometric measurements of Asian and European population.
The mean serum creatinine in the present study was 0.81±0.11 mg/dL before kidney donation which increased to 0.86±0.10 mg/dL and 1.01±0.12 mg/dL at 30 and 90 days postdonation respectively and was found to be statistically significant (p-value <0.0001) as compared to serum creatinine predonation. Similar results were found in a study by Bieniasz M et al., in which he analysed data of 46 living donor open nephrectomies in Poland [25]. They found that mean creatinine concentration was significantly higher at three months after donor nephrectomy (p-value <0.05).
Comparison of predonation: Measured and estimated GFR: The mean GFR measured by 99mTc-DTPA renal scan was 99.47±14.4 mL/min/1.73 m2. These results were comparable to study by Chaurasia RK et al., on Nepalese kidney donors (Mean 99mTc-DTPA GFR 102.75±16.71 mL/min/1.73 m2) [23]. However, the mean DTPA GFR in a study by Mahajan S et al., was slightly lower than present study (Mean 99mTc-DTPA GFR 83.85±15.42 mL/min/1.73 m2) [22]. In contrast to present study, the mean GFR observed by Zhao WY et al., was on the higher side (Mean 99mTc-DTPA GFR 115.3±25.8 mL/min/1.73 m2) [21]. Lin J et al., in their study on European population showed mean GFR calculated by DTPA to be 125.1±20.3 mL/min/1.73 m2 [24].
The reasons for low GFR in our population can be two folds. Firstly, the low dietary protein intake, known to modulate GFR for almost half a century, reduces the GFR in indigenous population [26]. Secondly, low birth weight, incidence of which is high in South Asian, leads to fewer number of nephrons and a consequent reduced GFR [27]. All the predicting equations underestimated the GFR measured by 99mTc DTPA scan. Chung BH et al., in their study on Korean kidney donors found that urine-Crcl and CG CrCl significantly underestimated the Measured GFR by 99mTc DTPA scan [28]. These findings were similar to the present study. Zhao WY et al., in their study on Chinese kidney donors found that urine-CrCl significantly overestimated the GFR measured by 99mTc DTPA scan with a bias of 14.2 mL/min/1.73 m2, however similar to our study CG CrCl and CG GFR under estimated the measured GFR with a bias of -3.7 and -26 [21]. They also found that urine-CrCl were more precise and better correlated with 99mTc DTPA scan as compared to CG equation. Mahajan S et al., in his study on Indian kidney donors found that CG CrCl overestimated the measured GFR and CG GFR underestimated the measured GFR [22]. Contrary to the present study they found that the worst performer in terms of accuracy, precision and median percent absolute difference was urine-CrCl estimation of GFR. Kumar AVSA et al., in their study on patients of diabetic nephropathy, observed results similar to present study [18]. They correlated three methods of GFR estimation urine-CrCl, CG CrCl and 99mTc-DTPA renography. Both the equation i.e., urine-CrCl and CG CrCl significantly underestimated the GFR measured by 99mTc DTPA scan.
Amongst all the equations tested to estimate the measured GFR predonation, urine-CrCl was most precise, better correlating and the least scattered. The correlation between the measured and estimated GFR was maximum with urine-CrCl (0.480). Precision as reflected by the statistic R2 was much higher for Urine-CrCl (R2=0.23) as compared to CG CrCl and CG-GFR (R2=0.092).
Few studies in literature have compared the various methods of GFR estimation with each study having difference in opinion regarding superiority of one method over other or correlation between the methods [29-31].
Comparison of postdonation: Measured and estimated GFR: The mean GFR measured at 90 days postdonation by 99mTc-DTPA scan was 62.1±11.5 mL/min/1.73 m2. The mean GFR estimated by CG equation, 24 hour urine creatinine clearance and CG corrected for GFR were 75.4±9.4 mL/min/1.73 m2, 53.1±7.5 mL/min/1.73 m2 and 63.30±7.89 mL/min/1.73 m2 respectively. The GFR estimated by CG equation and CG corrected for GFR overestimated the GFR measured by 99mTc-DTPA scan whereas GFR estimated by 24 hour urine creatinine clearance underestimated the GFR measured by 99mTc-DTPA scan.
Similar to findings observed predonation, urine-CrCl was most precise, better correlating and the least scattered. However, the literature on comparison of various GFR estimating equations postdonor nephrectomy is scarce, so it was difficult to conclude the comparability of these findings with other studies.
Changes in the function of retained kidney after donor nephrectomy: The mean increase in 99mTc DTPA GFR of retained kidney was 21.2% which was statistically significant.
Our results were consistent with the study by Chen Z et al., where the donors mean GFR was 59.00±19.55 mL/min at 1 month after surgery as compared to 48.10±14.03 mL/min before surgery [32]. The 22% average increase in GFR was statistically significant.
Cho HJ et al., measured the changes in remaining kidney function using serial technetium 99mTc- DTPA scans after Laparoscopic donor nephrectomies [33]. They found that there was an increase by 14.8% in DTPA GFR of the remaining kidney making it 58.2±10.6 mL/min/1.73 m2 (p-value <0.001) at 1 month and by 33.9% making it 78.0±14.0 mL/min/1.73 m2 at 1 year after surgery (p-value <0.001).
Chien CH et al., evaluated the changes in renal function after donor nephrectomy [34]. They measured serum creatinine and urine-CrCl on 2nd postoperative day and 3 monthly thereafter. An increase in urine-CrCl from 58.2 mL/min to 79.6 mL/min was found in the preserved kidney.
The studies in current literature have mostly compared the renal function of both kidneys of a donor prior to donation with function of the remaining kidney postdonation. Nevertheless, this study on Indian renal donors, assesses the functional change in the retained kidney pre and postdonation using 99mTc-DTPA scans, which makes it a unique one as per best of our knowledge. We are certain that the results of this study will add significant value to current literature about renal function after unilateral nephrectomy.
Limitation(s)
This was a single centre study with small sample size and limited duration of study. A gold standard method for reference was not chosen for measurement of GFR, like inulin clearance rate and double plasma methods. Although highly accurate, these methods have poor patient compliance and are more time and labor intensive, making them less acceptable.
Conclusion(s)
Living kidney donation entails a risk for donors, chiefly for those with suboptimal renal function. The GFR estimating equations have been found to be insupportable. Thus, it is worthwhile that every donor should undergo a more accurate GFR measurement with 99mTc-DTPA to assess the risk of living kidney donation.