Malocclusion is the most widespread oral health problems in the society. The acceptable physical appearance, including the dentition is an important aspect of human self-esteem. Malocclusion is closely related to an individual’s social performance and well being. Malocclusion can be defined as an occlusion having a abnormal relationship between the arches in any of the planes or in which there are anomalies in tooth position beyond the normal limits [1]. Malocclusion is multifactorial. It develops slowly as a child grows. The high prevalence has made it a public health problem in the world; and it is now considered the third highest oral health problem [1,2].
According to literature, different authors have evaluated and reported the prevalence of malocclusion to be 23.1%, 33.3% and 21.5%, respectively [3-5]. This may be due to change in food habits which can cause, an increase in dental caries and other associated factors. If malocclusion remains undiagnosed, then it might progress to severe form of malocclusion which requires more complicated treatment [4].
Children have increased plaque accumulation and are more susceptible to caries as it is difficult for them to maintain good oral hygiene. Dental caries is one of the most common predisposing factors for occlusal anomalies [5]. Good oral health is important for appearance, proper mastication and speech. However, inadequate oral hygiene, variable access to dental care and many other disability-related factors may account for differences [5,6].
In developing countries, socio-demographic background is also another relevant aetiological factor that determines the need for treatment of malocclusion. According to a research, author reported that children with high socio-economic status could easily afford for orthodontic treatment as compared to children from low or middle socio-economic status [6]. But the trend has changed now which can be due to the increase in literacy rate and better job opportunities which would have people to lead a better life style and meet their basic requirements [6,7].
The aetiology of malocclusion is considered to be multifactorial: it is mainly determined by the genetic factors, environmental factors and habits that can produce malocclusion during the growth and development process [7]. The variations in the prevalence rates between different regions and countries might be due to variations in ethnicity, nutritional status, religious beliefs, and dietary habits [6-8]. Hence, it is important to determine the prevalence of malocclusion and its relationship with several related factors, which might directly or indirectly cause malocclusion. Therefore, the present cross-sectional study was undertaken with an attempt to assess the prevalence of malocclusion and its relationship with socio-demographic factors, dental caries and oral hygiene status in 12-15-year-old school children of Lucknow city.
Materials and Methods
A descriptive cross-sectional study was carried out in the Department of Public Health Dentistry, Sardar Patel Postgraduate Institute of Dental and Medical Sciences, Lucknow, Uttar Pradesh, India from January 2017 to October 2017 (10 months). The Ethical institution approval was obtained from Institutional Ethical Committee (No. 911516/PHD/EC). A written consent was obtained from school authorities and informed consent was taken from the parents of children examined prior to the start of the study.
Inclusion criteria: Students aged 12-15 years on the day of examination and subjects who gave consent to do the oral examination were included in the study.
Exclusion criteria: Students undergoing orthodontic treatment (orthodontic appliances like braces, removable or fixed prosthesis, crowns and overhanging restorations), students who were under any medication or suffering from systemic disease, physically handicapped children were excluded from the study.
The pilot study was conducted on 50 school going children in the age group of 12-15 year old to assess the operational feasibility and reliability of the study. Cronbach’s alpha was applied to check the reliability of the questionnaire, which is found to be 0.86.
Sample size calculation: The formula for determining the size of the sample was:
N=4pq/L2
Where, p=prevalence, q=(1-p), L=allowance error,
N=4.0×0.68 (1-0.68)/0.05×0.05
The sample size calculation was performed to seek the results at 95% confidence level for which the value of z=1.96, the allowable error (e)= 0.05. Thus using the above mentioned formula, pilot study was conducted and prevalence of the disease was estimated. So, the calculated minimum sample size was found to be 851 school going children.
The sample was selected by multistage cluster random sampling technique. In the first stage, Lucknow city was divided geographically into four zones i.e., East, West, North and South. Approximately, 22 wards came under each of these geographic zones. In the second stage, one ward was randomly selected from each of these geographic areas. In the third stage, two schools (one government and one private) from the list of District School Officer were chosen randomly. A list of class students was obtained from each school teacher.
A single investigator interviewed and examined the subjects. Prior to the study, the guide/mentor calibrated the investigator regarding the World Health Organisation (WHO) criteria for diagnosing the malocclusion in Public Health Dentistry Department [9]. A group of 50 children were selected and examined for the survey thoroughly. Subjects were again examined on consecutive days by the same criteria to estimate the extent and nature of diagnostic variability.
The study proforma consisted of two parts, first part consisted of a predesigned questionnaire. It included demographic details like age, gender, type of school (government or private) and socio-economic status (Modified BG Prasad socio-economic status scale, 2016) [10], which was obtained by the parents who were invited on the day of examination. This scale takes information about education, occupation and income of the family to categorise the families into class I, class II, class III, class IV and class V [Table/Fig-1].
Revised Modified BG Prasad socio-economic status scale, 2016 [10].
| Socio-economic status | Classes |
|---|
| Class I | Upper class |
| Class II | Upper middle class |
| Class III | Middle class |
| Class IV | Lower middle class |
| Class V | Lower class |
The second part consisted of oral examination including Oral Hygiene Index-Simplified (OHI-S) by John C. Greene and Jack R. Vermillion, 1964, [11] Dentition Status (WHO Oral Health Assessment Form, 2013) [9] and dentofacial anomalies was recorded using Dental Aesthetic Index (WHO Oral Health Assessment Form, 1997) which provide information on occlusal status [12].
A single examiner interviewed and examined the children. The examiner visited the selected public and private schools on the scheduled dates with one recording assistant on the day of examination. Children were allowed to sit comfortably on a chair and a total of 25-30 students were examined per day. The helping assistant was allowed to sit close to the examiner, so that instructions and codes could be heard easily and the findings were being recorded correctly. Detailed oral examination was conducted using sterile instruments. All the subjects were made to sit in a chair under natural light for examination (Type III examination) [9].
The examiner used disposable mouth masks and gloves during examination. Total of 23 sets of autoclaved clinical examination instruments were carried out at day of examination. Chemical method for disinfection was followed in which the solution of Korsolex (gluteraldehyde- 7.0 gm; polymethyl urea derivative- 11.6 gm and 1-6 dioxyhexane- 8.2 gm) was modified by adding 1 part to 9 parts of potable water for 15 minutes.
Statistical Analysis
The data collected was entered in Microsoft Excel 2013 spreadsheet and then checked for any missing entries and statistically analysed using Statistical Package for Social Science (SPSS) version 21.0 (SPSS Inc., Chicago, IL, USA). The data collected was coded and tabulated and subjected to appropriate analysis. Inferential statistics were performed using parametric tests of significance as well as Chi-square test. Multiple non linear regression analysis was used to find the association of malocclusion with socio-demographic details, oral hygiene status and dental caries. The p-value <0.05 considered statistically significant.
Results
Among the 851 students who were examined, 403 (47.4%) were male and 448 (52.6%) were females. Furthermore, 224 (26.3%) were 12 years of age, 200 (23.5%) were aged 13 years, 201 (23.6%) were 14-year-old and 226 (26.6%) were of 15 years. According to the type of school, 429 (50.4%) children studied in private schools while 422 (49.6%) children were enrolled in public schools.
Regarding socio-economic status, majority of students belonged to the middle class (upper-middle; 421: 49.5% and lower middle; 206 (24.2%) family followed by the children who belonged to upper class family i.e., 102 (12%). The remaining children belonged to lower class i.e., Upper lower 93 (10.9%) and 29 (3.4%) belonged to lower class family [Table/Fig-2].
Socio-demographic characteristics of children enrolled (N=851).
| Demographic characteristics | Number (N) | Percentage (%) |
|---|
| Age (years) |
| 12 | 224 | 26.3 |
| 13 | 200 | 23.5 |
| 14 | 201 | 23.6 |
| 15 | 226 | 26.6 |
| Gender |
| Male | 403 | 47.4 |
| Female | 448 | 52.6 |
| Type of school |
| Private | 429 | 50.4 |
| Government | 422 | 49.6 |
| Socio-economic status |
| Upper class | 102 | 12.0 |
| Upper middle class | 421 | 49.5 |
| Lower middle class | 206 | 24.2 |
| Upper lower class | 93 | 10.9 |
| Lower class | 29 | 3.4 |
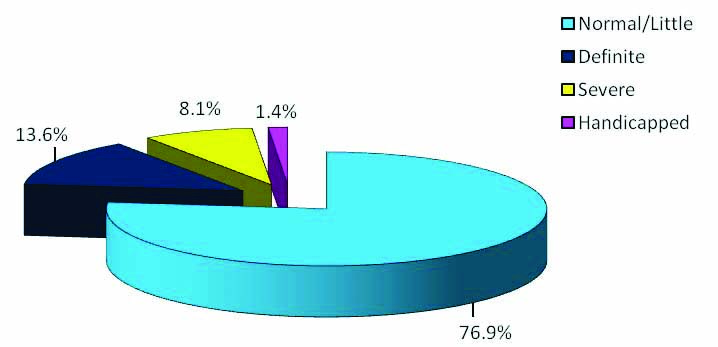
[Table/Fig-3] show the prevalence of malocclusion according to DAI. Study showed that 76.9% children have no/little malocclusion, which does not require any treatment. Whereas, malocclusion prevalence in age group of 12-15 years school children was 23.1% (definite/severe/handicapped).
Distribution of malocclusion according to DAI.
[Table/Fig-4] show the relationship between DAI with demographic characteristics, dental caries and OHI of children enrolled. It is observed that there is a statistically significant relationship between age (p-value=0.023), socio-economic status (p-value <0.001), dental Caries (p-value <0.001) and OHI (p-value <0.001) with malocclusion.
Relationship of malocclusion wth socio-demographic characteristics, dental caries and OHI of children enrolled.
| Variables | Malocclusion | χ2 value | p-value |
|---|
| Normal/Little (n=654) (%) | Definite (n=116) (%) | Severe (n=69) (%) | Handicapped (n=12) (%) |
|---|
| Age (years) |
| 12 | 176 (26.9) | 20 (17.2) | 25 (36.2) | 3 (25.0) | 19.33 | 0.023 |
| 13 | 160 (24.5) | 24 (20.7) | 14 (20.3) | 2 (16.7) |
| 14 | 144 (22.0) | 41 (35.3) | 15 (21.7) | 1 (8.3) |
| 15 | 174 (26.6) | 31 (26.7) | 15 (21.7) | 6 (50.0) |
| Gender |
| Male | 311 (47.6) | 55 (47.4) | 31 (44.9) | 6 (50.0) | 0.21 | 0.976 |
| Female | 343 (52.4) | 61 (52.6) | 38 (55.1) | 6 (50.0) |
| Type of school |
| Private | 337 (51.5) | 58 (50.0) | 27 (39.1) | 7 (58.3) | 4.15 | 0.246 |
| Government | 317 (48.5) | 58 (50.0) | 42 (60.9) | 5 (41.7) |
| SES |
| Upper class | 86 (13.1) | 10 (8.6) | 5 (7.2) | 1 (8.3) | 38.11 | <0.001 |
| Upper middle | 333 (50.9) | 47 (40.5) | 31 (44.9) | 10 (83.3) |
| Lower middle | 161 (24.6) | 29 (25.0) | 16 (23.2) | 0 (0.0) |
| Upper lower | 61 (9.3) | 20 (17.2) | 11 (15.9) | 1 (8.3) |
| Lower | 13 (2.0) | 10 (8.6) | 6 (8.7) | 0 (0.0) |
| Oral hygiene index |
| Good | 428 (65.4) | 46 (39.7) | 12 (17.4) | 2 (16.7) | 129.28 | <0.001 |
| Fair | 191 (29.2) | 44 (37.9) | 31 (44.9) | 6 (50.0) |
| Poor | 35 (5.4) | 26 (22.4) | 26 (37.7) | 4 (33.3) |
| Dental caries |
| No caries | 476 (72.8) | 31 (26.7) | 15 (21.7) | 4 (33.3) | 201.81 | <0.001 |
| Decayed teeth | 167 (25.5) | 71 (61.2) | 43 (62.3) | 6 (50.0) |
| Filled teeth | 8 (1.2) | 8 (6.9) | 0 (0.0) | 0 (0.0) |
| Missing teeth | 3 (0.5) | 6 (5.2) | 11 (15.9) | 2 (16.7) |
Multiple Nonlinear Regression test was applied; χ2 value- Chi-square coefficient; p-value <0.05 considered significant
[Table/Fig-5] show statistically significant relationship between malocclusion with age and highly significant relationship of malocclusion with socio-economic status (p-value=0.001), oral hygiene (p-value=0.0001) and dental caries (p-value=0.0001).
Pseudo- R square (Beta) value of Malocclusion.
| Variable | Pseudo- R square (Beta) value of malocclusion |
|---|
| Cox and Snell | Nagelkerka | Mcfadden | Chi-square | p-value |
|---|
| Age (Years) | 0.022 | 0.028 | 0.015 | 18.662 | 0.023* |
| Gender | 0.000 | 0.000 | 0.000 | 0.208 | 0.976 |
| Type of school | 0.005 | 0.006 | 0.003 | 4.167 | 0.243 |
| SES | 0.042 | 0.055 | 0.029 | 36.847 | 0.001** |
| OHI | 0.131 | 0.169 | 0.095 | 119.906 | 0.0001** |
| Dental caries | 0.203 | 0.263 | 0.153 | 192.562 | 0.0001** |
p-value <0.05 considered significant; *Statistically significant; **Highly significant
Discussion
The present cross-sectional descriptive study was conducted to assess the prevalence of malocclusion and its relationship with socio-demographic factors, dental caries and oral hygiene status between 12-15-years children of Lucknow city, India. In the present study, there were 47.4% (403) males and 52.6% (448) females.
Dental Aesthetic Index (DAI) is considered to be a quick and convenient index for evaluating malocclusion prevalence and the treatment needs for malocclusion. It also indicates high degree of reliability, validity and it is relatively easy to use for the large population. DAI consists of 10 prominent traits of malocclusion of their relative importance and it was universally accepted by WHO and also validated in India [13].
In India, prevalence of malocclusion ranges from 20%-43% [1-4,13]. In the present study, 76.9% of the students with the age group of 12-15 years had no/minor malocclusion. In case of handicapping malocclusion, which is less than 2% in the present study require mandatory treatment. These findings were in the agreement with the result of other Indian studies [Table/Fig-6] [1-3,5,14,15]. This variation in the percentage might be related to variations in growth factors, different cross cultural differences, occlusion, facial skeleton development, and predisposing genetic factors.
Prevalence of Malocclusion from different geographical regions.
| Author | Places | Age of children | Sample size | Malocclusion (%) |
|---|
| Tak M et al., (2013) [2] | Rajasthan | 12-15 | 887 | 33.3% |
| Gaikwad SS et al., (2014) [5] | Maharashtra | 12-15 | 880 | 26.8% |
| Sharma A et al.,(2015) [1] | Uttar Pradesh | 12-15 | 1012 | 33.1%, |
| Gupta R et al., (2015) [3] | Madhya Pradesh | 13-15 | 549 | 21.5% |
| Abbas A et al., (2015) [15] | Pakistan | 11-16 | 574 | 75.6% |
| Mtaya M et al., (2009) [14] | Tanzania | 12-14 | 1601 | 63.8% |
| Present study, (2020) | Lucknow | 12-15 | 851 | 23.1% |
Concerning malocclusion distribution with respect to gender; females presented a greater prevalence in our study, which was similar to the studies by Gailkwad SS et al., Mtaya M et al., and Otuyemi OD et al., [5,14,16]. However, numerous other studies like Sharma A et al., and Rashidah et al., found that higher occurrence was found among males which might be due to the fact that females have genetically smaller size of jaw, which can lead to crowding or different aspects of malocclusion [1,17]. Nevertheless, similarities and differences with previous studies and reports are not really relevant because the differences were found to be nonsignificant.
In relation to a possible association between malocclusion prevalence and age, the result was statistically significant. Age group 12-15 years, children hit puberty where they go through a lot of body changes. Children with good oral hygiene perform better in school according to the researches i.e., students are socially more interactive and perform better in overall performance. Aesthetics uplifts child’s spirit providing him with satisfaction and confidence in employment and socialisation [18]. Many researches have been done in the world that emphasised the importance of correcting malocclusion at the right age and stage (i.e., little/no, definite or severe malocclusion) [5,7,18,19].
Higher proportion of children had malocclusion were going to government school as compared to children going to private school, but the relationship was not statistically significant in this study. This might be attributed to the fact that children belonging to private school had better dental awareness as they were familiar with the dental terminologies used by the dentist regarding the visits to dental offices on regular basis. They were quiet keen to learn more from teachers and parents [18-20]. In comparison with private school children, public school children were not too familiar with the dental terms as they had had less dental visits [3,6].
The association between malocclusion and socio-economic status in this study was statistically significant. The finding was in the accordance to the study done by Pruneda JFM et al., Nalcaci R et al., [20,21]. In a similar study by Daragiu DE and Ghergic DL, stated that the need for orthodontic treatment might depend upon the willingness of the patient to pay for the cost of the treatment to correct the malocclusion.. It can be noticed that in the low-income families, there is inequality in the access to dental/ orthodontic treatment as well as the lack of knowledge, awareness of parents regarding the malocclusions leading to untreated dental disease [22]. The findings were in contrast to present study, where Ausim S and Hamid S who reported that the SES was not significantly associated with the DAI scores as according to the authors statement, this trend has changed now which may be due to the increase in the literacy rate and better job opportunities which would have people to lead a better life and meet their basic requirements. This difference might be due to variation in sample size and geographical location [18].
By examining the relationship between malocclusion, dental caries and oral hygiene, it was observed that with increase in DAI score increases the OHI scores as well as dental caries. The reason for this increase in dental caries in malaligned teeth might be due to the fact that with age, coronal caries chances also increase and teeth are more exposed with the oral environment [21]. It leads to more plaque accumulation and more presence of microorganisms, which results in cavity formation. But this trend has changed now, due to more utilisation of dental services. [5,13,14].
Regarding oral hygiene scores, studies were in accordance with current study done by Ashley FP et al., and Gusmao ES et al., in which poor oral hygiene was found to have a plausible link to malocclusion [7,23]. In contrast with this study, Mtaya MA et al., in Tanzania stated that students with fair or poor oral hygiene were less likely to be diagnosed with midline diastema than students with good oral hygiene [14]. Whereas, Sakri SB et al., revealed that the examination of oral cavity in every six months, good oral hygiene practices, care for tooth decay, correction of malocclusion and of all above, are likely to underestimate the prevalence of disease [24].
Strength of the present study was the diagnostic methods recommended by the WHO (DAI and DMFT). These indexes are considered valid and reliable, therefore leading to a lower level of measurement bias.
Limitation(s)
The present study was limited by it’s sample size and further longitudinal studies with more extensive survey would provide a better base line for planning purposes.
Conclusion(s)
The present study concluded that the malocclusion was one of the major concern for the child oral health. The malocclusion prevalence of the current study was 23.1%. Prevalence of definite, severe and very severe (handicapped) malocclusion was 13.6%, 8.1% and 1.4% respectively. There is positive association of DAI with age, socio-economic status, OHI and dental caries.
Since, the school children are not aware much about dental diseases and methods of their prevention, therefore education and motivation of students to maintain proper oral hygiene is of paramount importance. Teachers and parents play an important role in encouraging students to inculcate healthy lifestyle habits in their daily practice.
Multiple Nonlinear Regression test was applied; χ2 value- Chi-square coefficient; p-value <0.05 considered significant
p-value <0.05 considered significant; *Statistically significant; **Highly significant