Diabetes mellitus is a metabolic disorder and a silent epidemic that is growing at a steady rate. The International Diabetes Federation has estimated a burden of 642 million diabetics on health services of all the parts of the world by 2040 [1]. It is characterised by a relative or absolute insulin insufficiency with or without resistance to the metabolic actions of insulin. It progresses slowly and ultimately the body fails to maintain glucose homeostasis [2]. Systemically, these disturbances are accompanied by changes in the biochemical and metabolic functioning such as an altered lipid profile, lipid peroxidation and obesity. This is mainly due to imbalance between the excessive free fatty acids supply and their inadequate utilisation by mitochondrial beta-oxidation [3].
Dyslipidaemia is most commonly assessed by laboratory lipid profile analysis in serum sample. It has been documented that lipids are secreted in saliva [4].
Saliva is an ultra-filtrate of blood and is one the most copious secretions of the body. Also, its collection is easy and noninvasive. Recent data suggest that a salivary sample could be functionally equivalent to serum in reflecting the physiological state of the body [5]. Literature showed saliva as a tool for the screening and monitoring of chronic systemic diseases like DM [6]. Being one of the most abundant secretions of the body with its easy and non- invasive collection; saliva is a potential screening tool [7].
This study is a step towards validation of saliva as a tool for the screening and monitoring of dyslipidaemia. Therefore, the aim of the present study was to measure, compare and correlate the serum and salivary lipid profile parameters (TC, HDL and LDL) in diabetic and healthy individuals.
Materials and Methods
This Case-control study was conducted in the Department of Biochemistry of Santosh Medical College, Santosh deemed to be University Ghaziabad, Uttar Pradesh, India. The study was carried out for a period of one year i.e. from March 2019 to February 2020. Permission of Institutional Ethics Committee (IEC) was taken before carrying out the study (Reference No: SU/2018/122). Written informed consent was taken from each participant of the study.
Sample Size
Calculation of sample size was done by the formula
n=(Zα/2+Zβ)2 *2*σ2/d2,Considering confidence level of 95%, α is 0.05 and the critical value is 1.96), Zβ is the critical value of the Normal distribution at β (for a power of 90%, β is 0.05 and the critical value is 1.64), σ2 is the population variance, and d is the difference between the 2 means. The calculated minimum sample size was 78, each in the control and diabetic group. However, to account for any loss of follow-up of reports or confounders; 100 subjects were taken each in the diabetic and control group.
Inclusion criteria: The study comprised of 200 participants between the ages 31-70 years. The participants included 100 diabetic subjects with a history of DM for at least three years and 100 age matched controls.
Individuals were included in the study irrespective of any other co-morbidities, the medications being taken them or their current glycemic status.
Exclusion criteria: Patients diagnosed with type 1 DM, salivary gland disorders, periodontitis, having pan masala, beetle nut, smoking and tobacco chewing habits were excluded from the study.
Collection of Sample
Serum- 2 mL of venous blood sample was collected in the morning on an empty stomach after at least 12 hours of fasting. The samples were collected in plain (serum) red top vacutainers for estimation of lipid profile parameters.
Saliva- Subjects were asked to rinse their mouth twice with distilled water after which saliva was collected by passive drooling. Stimulated saliva has been shown to have an altered pH, water content, protein and electrolytes [8,9]. The pooled unstimulated saliva was collected in a sterile, disposable plastic container over a period of five minutes after which the samples were stored on ice and sent to laboratory to be processed immediately. The saliva samples were then centrifuged at 2000 rotation per minute (rpm) for five minutes after which the supernatant was used for lipid profile parameters estimation.
Lipid Parameters
Total Cholesterol
The TC was estimated by kits manufactured by Chema Diagnostica that are based on Cholesterol Oxidase (CO)-Peroxidase method. The instructions given in the kit insert were followed to carry out the test. The Principle of the method states that all cholesterol esters present in serum are hydrolysed into free cholesterol and fatty acids by Cholesterol Esterase (CHE). In the presence of oxygen, free cholesterol is then oxidised by CO to produce Hydrogen peroxide (H2O2). The H2O2, reacts with p-chlorophenol and 4-aminoantipyrine in the presence of peroxidase to form a quinoneimine dye, the intensity of which is proportional to the cholesterol concentration and can be measured photometrically between 480 and 520 nm.
High Density Lipoprotein
The HDL was estimated by kits manufactured by Chema Diagnostica that are based on the principle that Anti human p-lipoprotein antibody binds to lipoproteins (LDL, VLDL, and chylomicrons) other than HDL. CHE and CO react only with HDL-C. Hydrogen peroxide produced by the enzyme reactions with HDL-C yields a blue colour complex upon oxidative condensation with 4-aminoantipyrine. The absorbance of the blue colour complex at 593 nm which is proportional to the HDL-C concentration. The instructions given in the kit insert were followed to carry out the test.
Low Density Lipoprotein
The LDL was also estimated by kits manufactured by Chema Diagnostica that are based on the principle that CHE and CO react with non-LDL lipoproteins. Hydrogen peroxide produced is decomposed by catalase and then CHE and CO react only with LDL-C which yields a coloured complex, the absorbance of which when measured at 600 nm is proportional to the LDL concentration. The instructions given in the kit insert were followed to carry out the test.
All these estimations are based on spectrophotometric principle [10]. The analysis was done on the fully- automated Dirui- 300B auto analyser.
Statistical Analysis
The obtained data was statistically analysed by the Statistical Package for Social Sciences (SPSS) Version 16.0. Mean, Standard deviation, Pearson’s correlation coefficient along with regression analysis was carried out and compared between the groups. A p-value <0.05 and <0.01 obtained by t-test was considered significant and highly significant respectively.
Results
The study had 200 participants between the age groups of 31-70 years. The average age of the participants was 54.3 years. The diabetic group included 58 males and 42 females whereas the control group included 54 males and 46 females. The age wise distribution in both the study groups is shown in [Table/Fig-1].
Age wise distribution of the participants (control and diabetic subjects) of the study.
| Age group (years) | Control group | Diabetic group |
|---|
| 31-40 | 11 | 13 |
| 41-50 | 29 | 31 |
| 51-60 | 39 | 37 |
| 61-70 | 21 | 19 |
| Total | 100 | 100 |
The serum and salivary concentrations of TC, HDL and LDL were analysed in all the participants of the study as shown in [Table/Fig-2,3].
Serum and salivary lipid profile parameters (mg/dL) in control subjects of the study.
| Parameters | Mean | Standard deviation | Minimum | Maximum |
|---|
| Total cholesterol (mg/dL) |
| Serum | 175.5 | 24.9 | 124.7 | 226.3 |
| Saliva | 17.82 | 2.87 | 11.3 | 23.8 |
| High density lipoprotein (mg/dL) |
| Serum | 49.75 | 8.55 | 35.1 | 65 |
| Saliva | 8.46 | 1.47 | 5.5 | 12.8 |
| Low density lipoprotein (mg/dL) |
| Serum | 98.47 | 22.9 | 60.3 | 139.4 |
| Saliva | 8.98 | 2.25 | 4.2 | 14.2 |
Serum and salivary lipid profile parameters (mg/dL) in diabetic subjects of the study.
| Parameters | Mean | Standard deviation | Minimum | Maximum |
|---|
| Total Cholesterol (mg/dL) |
| Serum | 175.08 | 18.16 | 117.7 | 220.2 |
| Saliva | 20.41 | 2.78 | 11 | 27 |
| High Density Lipoprotein (HDL) (mg/dL) |
| Serum | 29.44 | 8.39 | 14 | 48.8 |
| Saliva | 5.04 | 1.3 | 2 | 7.6 |
| Low Density Lipoprotein (LDL) (mg/dL) |
| Serum | 112.3 | 12.49 | 81 | 142 |
| Saliva | 10.59 | 1.27 | 7 | 14.5 |
In the controls [Table/Fig-2], the mean serum TC, HDL and LDL levels were 175.5 mg/dL, 49.75 mg/dL and 98.47 mg/dL, respectively. The mean salivary TC, HDL and LDL levels in this group were 17.82 mg/dL, 8.46 mg/dL and 8.98 mg/dL, respectively.
In the diabetics [Table/Fig-3], the mean serum TC, HDL and LDL levels were 175.08 mg/dL, 29.44 mg/dL and 112.3 mg/dL, respectively. The mean salivary TC, HDL and LDL levels in this group were 20.41 mg/dL, 5.04 mg/dL and 10.59 mg/dL, respectively.
Independent t test was performed between the controls and patient group comparing their respective salivary TC, HDL and LDL levels as shown in [Table/Fig-4]. A t-value of 2.23, 0.20 and 64.48 was obtained respectively and the difference was highly significant for all the parameters with a p-value <0.01.
Comparison of salivary lipid profile parameters (mg/dL) in controls and diabetic subjects.
| Salivary lipid profile parameters | Mean±SD | t-value | p-value (t-Test) |
|---|
| Total cholesterol (mg/dL) |
| Diabetics | 20.41±2.78 | 2.23 | <0.01 |
| Controls | 17.82±2.87 |
| High Density Lipoprotein (HDL) (mg/dL) |
| Diabetics | 5.04±1.3 | 0.20 | <0.01 |
| Controls | 8.46±1.47 |
| Low Density Lipoprotein (LDL) (mg/dL) |
| Diabetics | 10.59±1.27 | 64.48 | <0.01 |
| Controls | 8.98±2.25 |
The correlation of serum TC, HDL and LDL levels with its respective salivary levels was studied in all the participants (controls subjects and diabetic subjects) of the study as shown in [Table/Fig-5]. The correlation was found to be significant in both the groups for all parameters.
Correlation of serum and salivary lipid profile parameters in healthy controls and diabetic subjects of the study.
| Parameter | Group | Pearson correlation coefficient ‘R’ | p-value |
|---|
| Total cholesterol | Controls | 0.87 | <0.01 |
| Diabetics | 0.66 | <0.01 |
| High Density Lipoprotein (HDL) | Controls | 0.78 | <0.01 |
| Diabetics | 0.88 | <0.01 |
| Low Density Lipoprotein (LDL) | Controls | 0.81 | <0.01 |
| Diabetics | 0.87 | <0.01 |
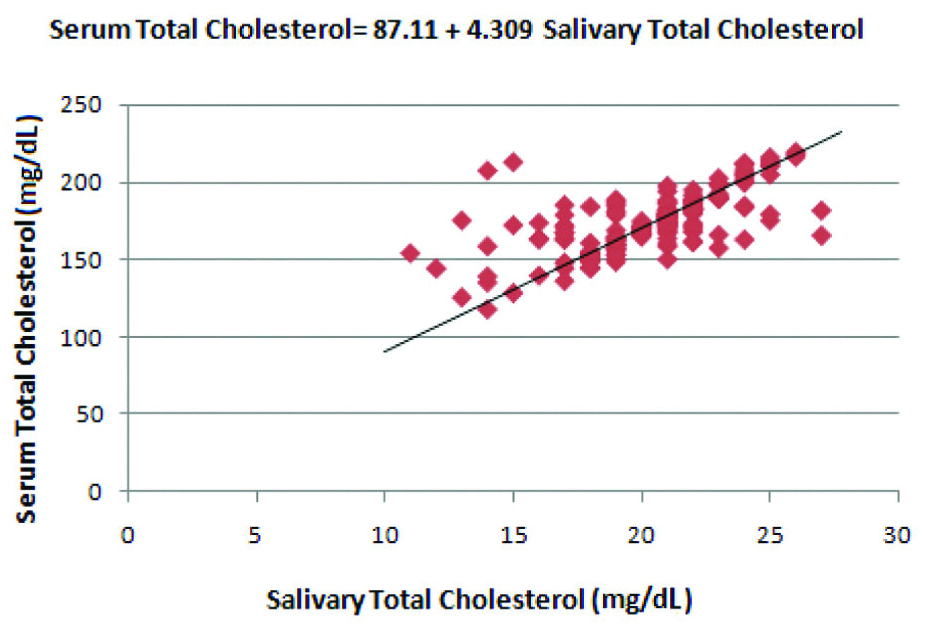
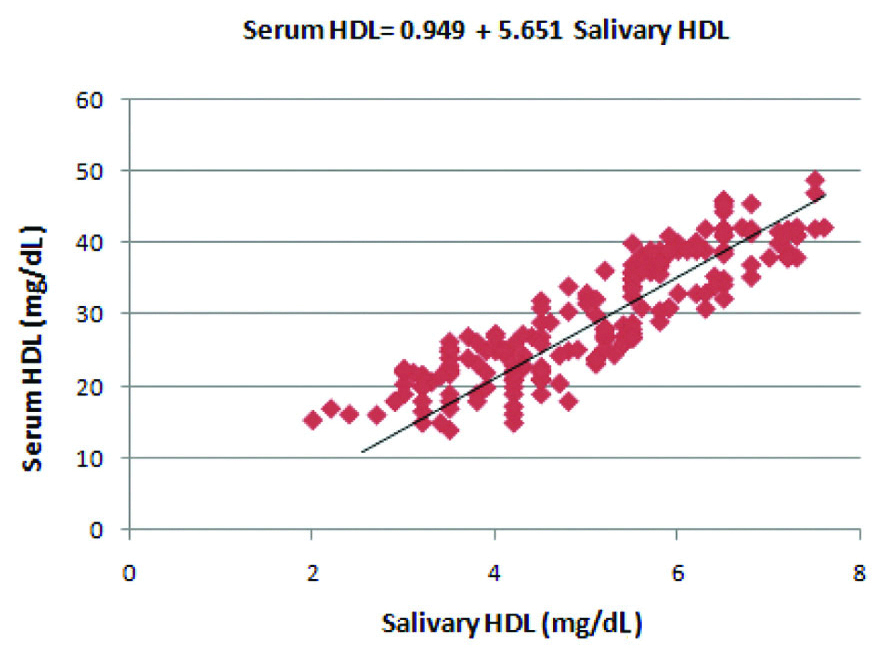
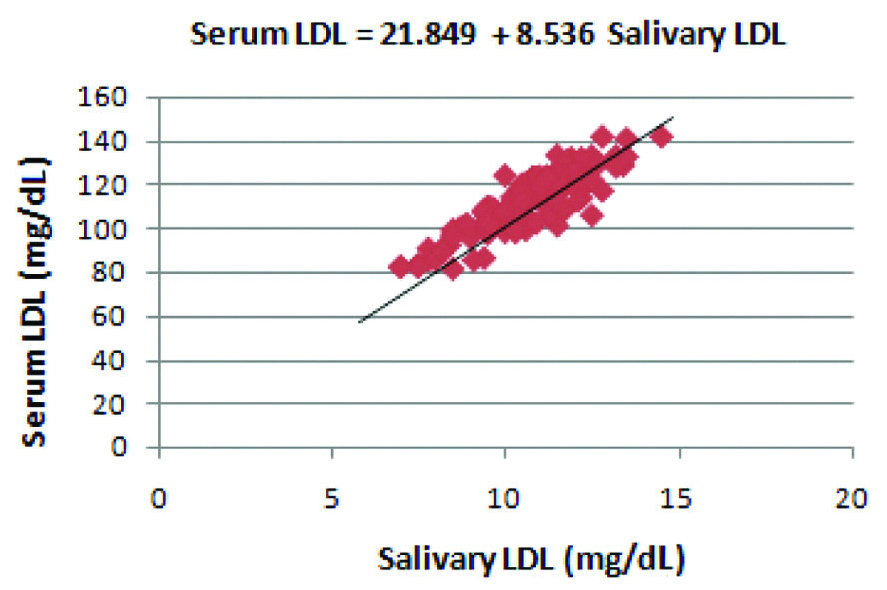
The correlation between serum and salivary TC, HDL and LDL levels in diabetics is represented in [Table/Fig-6,7 and 8], respectively. The regression coefficient was calculated which reflects the change in the serum concentration of the lipid profile parameter when there is a single unit change in their salivary counterpart. A formula was derived for the prediction of serum concentration of TC, HDL and LDL levels using their respective salivary concentrations by application of the regression equation.
Correlation between salivary Total Cholesterol (TC) and serum Total Cholesterol (TC) levels in the diabetic group.
Regression coefficient was calculated and a formula was derived for the prediction of serum TC from salivary TC in the diabetic group
Correlation between salivary HDL and serum HDL levels in the diabetic group.
Regression coefficient was calculated and a formula was derived for the prediction of serum HDL from salivary HDL in the diabetic group
Correlation between salivary LDL and serum LDL levels in the diabetic group.
Regression coefficient was calculated and a formula was derived for the prediction of serum LDL from salivary LDL in the diabetic group
Discussion
Diabetes mellitus is a chronic condition that affects the intermediary metabolism. The long-term complications associated with DM affects various organ systems of the body. Currently, the WHO and American Diabetic Association recommends the repeated evaluation of fasting blood glucose, HbA1C, Lipid profile and Kidney function tests every 3-6 months for the diagnosis, prognosis and evaluation of the long-term complications associated with DM [11].
Dyslipidaemia due to deranged lipid metabolism is a common characteristic feature of metabolic syndrome. Type 2 Diabetes mellitus patients often have an abnormal lipid profile that includes high TC, decreased HDL, increased LDL and high Triglycerides. The circulating high LDL levels and low HDL levels predisposes the individual towards increased cardiovascular risk [12].
Studies have shown that factors like age, obesity, persistent hyperglycaemia and dyslipidaemia have a role in of the development of atherosclerosis, arteriosclerosis, Coronary Heart Disease (CHD) and Hypertension (HTN) [13,14].
Determination of TC, LDL and HDL is included as a part of serum lipid profile. It is used to screen for arteriosclerotic cardiovascular disease. Persistent Low HDL cholesterol and high LDL cholesterol levels predisposes an individual to atherosclerosis [15].
The analysis of lipid profile along with other parameters requires invasive methods for blood collection which when carried out at regular intervals of time can be traumatic to the patients. Further, the anxiety and trauma associated with venipuncture itself discourages the patients further. Keeping these factors in mind; a simple, non- invasive and inexpensive method for screening and prognosis evaluation of DM is the need of the hour.
Saliva, being an ultra-filtrate of blood, is one the most abundant secretions of the body. It contains most compounds present in blood which enter the saliva by transcellular and paracellular routes [16]. It has been reported in the study by Chiappin S et al., that a salivary sample could be functionally equivalent to a serum sample in contemplating the physiological state of the body. Apparently, the metabolic and hormonal variations in analytes present in blood are also reflected in saliva. Also, its collection is easy, noninvasive and does not require any special expertise or equipment. Keeping these factors in mind, saliva has a great potential to be used as a screening tool for various conditions [17].
Whole saliva contains about 10-100 μg/mL lipids. Cholesterol esters, free cholesterol, triglycerides, diglycerides, monoglycerides and free fatty acids accounts for 96-99% of the total salivary lipids [18].
In the present study, we evaluated lipid profile parameters- TC, HDL and LDL levels in serum and saliva. The evaluation was done in both, diabetic subjects and age matched controls. The results of the study show there was a significant difference between the salivary TC, HDL and LDL levels in healthy individuals and diabetics indicating that a deranged lipid profile is reflected in their levels in saliva. A strong and significant positive correlation of serum TC, HDL and LDL level with its respective salivary levels was obtained in all the participants (controls and diabetics) of the study.
Similar results were also obtained in the study conducted by Singh S et al., [19]. Also, Al-Rawi NH concluded that the high concentration of lipid fractions in saliva usually follows their respective serum levels [20]. Based on their study on detection of ovulation using saliva as a biomarker, Alagendran S et al., concluded that saliva can be used to measure cholesterol and phospholipids as it reflects proportional levels [21].
Positive correlations between serum and salivary TC concentrations were obtained in the study conducted by Karjalainen S et al., and it was concluded that saliva cholesterol concentrations reflect serum concentrations in healthy adults [22]. Frances K and Edith BO in their study reported that, salivary cholesterol concentration reflected serum concentration in healthy adults and could be used to screen for individuals with high serum cholesterol levels [23].
Giuseppe R et al., demonstrated a positive correlation between salivary oxidised LDL and serum oxidised LDL levels in overweight and obese individuals in their study [24]. Leone A et al., and Zhang Y et al., in the scientific investigations conducted in their studies have concluded that lipid along with 30 other components is present in the salivary glands [25,26].
Rawi NA and Atiyah KM reported in their study that all the lipid fractions found in saliva followed similar pattern in the serum but lesser concentration [27].
Like the previously mentioned studies, the study by Kale K et al., showed that in the diabetic group there was a strong correlation of the serum and salivary TC, HDL and LDL values. In the control group there was a very strong correlation of TC values, moderate correlation of LDL values and VLDL values [28].
In the present study, the salivary lipid values show a positive association with the serum lipid concentrations. This would indicate that the serum lipids are reflected in their corresponding salivary values probably because some proportional amount of lipids is filtered into the saliva from the serum.
Various possible mechanisms can be used to explain this hypothesis. Intracellular route including passive diffusion and active transport has been studied. Also, extracellular route which mainly includes ultrafiltration that occurs through the tight junctions between the cells has also been reported. Lipids may also be present in saliva due to gingival crevicular outflow or from secretory vesicles and microsomes [29,30].
Chronic metabolic disorders like T2DM require repeated measurement of glucose, lipid profile, kidney function tests over time to keep prognosis in check. Collection of saliva being easy and noninvasive provides a significant advantage over peripheral blood sample. Also, using saliva as a sample, there is a reduced chance of transmission of infectious diseases by needle stick injury. It does not discourage the patient further as it is less traumatic to the patient. Also, the need for a trained individual e.g., Phlebotomist as in the case of blood collection is eliminated here [31,32]. These factors make assessment of saliva as a biomarker an economically friendly approach.
Limitation(s)
Some limitations like the oral retention of food, oral bacterial utilisation of glucose, undiagnosed parotitis and periodontitis has not been seen in the study which may influence the results and therefore have to be kept in mind before analysing the results.
Conclusion(s)
Saliva can hence be used as an initial screening tool of lipid profile in the population and will also have great utility to diabetics as metabolic syndrome is invariably associated with dyslipidaemia. This would limit the trauma and anxiety associated with the frequent venipuncture needed for monitoring the prognosis of the diabetic individuals. Standardisation of the techniques for the estimation of salivary lipid profile parameters, including triglycerides and VLDL and setting up a reference range will also make it useful in clinical practice.