Spinal anaesthesia is widely used for both elective and emergency procedures. The combination of analgesia, muscle relaxation and minimum physiologic changes means that spinal anaesthesia has the potential for being a uniquely safe anaesthetic technique. Although spinal anaesthesia provides excellent anaesthesia for many operations, certain complications are associated with it. Many of these complications are now avoidable but severe hypotension primarily due to pharmacological sympathectomy cause arterial and venodilation with subsequent functional hypovolemia, resulting in potential deleterious consequences, morbidity and mortality [1].
Both crystalloids and colloid pre loading is recommended and is a common research practice. Administration of intravenous fluids increases circulating volume and cardiac output in an effort to compensate for the expansion of the capacitance vessels [2]. Colloid may stay in the intra-vascular compartment longer but is more expensive and may be associated with anaphylaxis. Crystalloids had a short intra-vascular half-life and are poor plasma expanders, large volumes are thus required. Excess of crystalloid may produce pulmonary and peripheral oedema and may cause haemodilution [3]. Because of rapid transcapillary fluid loss into the extravascular space, the time elapsed between administration of fluids and subarachnoid block may influence their efficacy [4].
With this background, the present study was planned to compare the efficacy of 5 mL/kg of 6% Hetastarch to that of 15 mL/kg of Plasmalyte (crystalloid) solution in preventing hypotension during spinal anaesthesia in patients undergoing lower abdominal surgery. Hence, primary objective of the present study was the comparison between hemodynamic parameters (systolic, diastolic and MBP, pulse rate) and the secondary objective was measure of total ephedrine requirement and incidence of nausea/vomiting.
Materials and Methods
This randomised clinical study was conducted on 80 patients undergoing any lower abdominal surgeries over a period of 10 months (June 2016 to April 2017) in Paras Hospital, Gurugram, Haryana. After obtaining Ethical Committee clearance (ECC no: 101-23107- 141-200770) and an informed written consent was obtained from every patient.
Inclusion criteria: Patients 18-65 years of age, ASA grades I/II, undergoing surgery of lower abdomen in the hospital during the study time period with duration of surgery more than 30 minutes and less than two hours were included in the study after obtaining written informed consent.
Exclusion criteria: Pregnant women or those undergoing emergency surgery, with Body Mass Index (BMI) >30 kg/m2 or those on diuretic therapy, and patients with contraindications to central neuraxial blockade (raised Intracranial Pressure (ICP), hypovolemic states, abnormal coagulopathy) or known allergy to drugs used in the study, surgery levels reaching above T6 were excluded from the study.
Sample size estimation: The study was considered that define a relevant difference of 30% [1] in the incidence of hypotension between crystalloid group and colloid group. The sample size was calculated using the following formula:
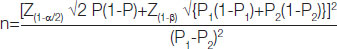
Using a two tailed alpha value (0.05) and a beta value (0.2), 40 patients per group was found to be sufficient to detect a significant difference. Keeping all the values-Where, P1=Anticipated proportion of incidence of hypotension in Plasmalyte group; P2=Anticipated proportion of incidence of hypotension in Hetastarch group P=(P1+P2)/2; Group H: (n=40) All Patients in this group received 5 mL/kg, 6% hetastarch, a colloid; Group P: (n=40) All patients in this group received 15 mL/kg plasmalyte, a crystalloid.
Methodology
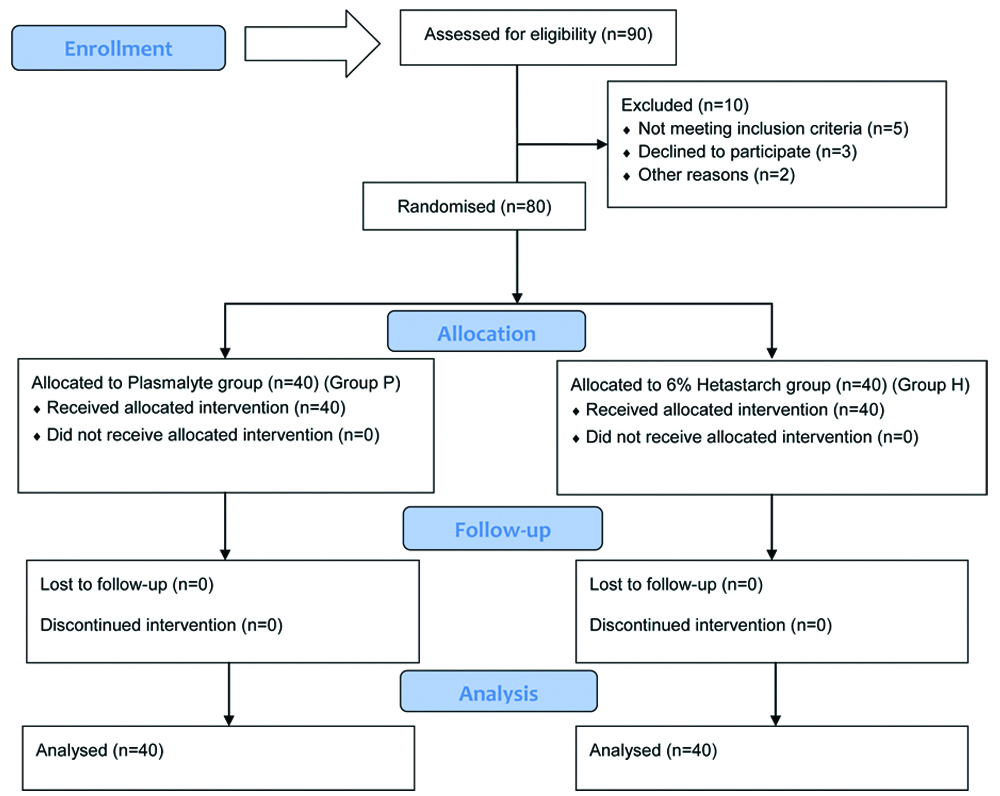
Randomisation of patients were done by computer generated random number table in two groups [Table/Fig-1]. A detailed Pre Anaesthetic Check-Up (PAC) including history, physical examination and routine investigations as guided by age and co-morbidities was carried out in all patients. The anaesthetic procedure as well as study design was explained to the patient and informed written consent was obtained. All patients were kept fasting for eight hours prior to surgery. Patient was shifted to the operating room and connected to multi parameter monitor and baseline vital signs including BP, pulse rate, electrocardiography and Oxygen Saturation (SpO2) was recorded.
Another anaesthesiologist, not involved in the study, allocated the patient to one of the two groups using computer generated random number table and pre-loaded the patient with the fluid according to the group. An Intravenous (IV) access was secured with 18 G cannula. The volume of fluid was given using a tri-way set attached to a cannula using a 50 mL syringe. Group allocation was not revealed till the end of observation period. After pre loading the vitals was recorded again by the investigating anaesthesiologist.
Spinal anaesthesia was then performed by the investigating anaesthetist. Under all aseptic precautions, with the patient in the sitting position, 25 G quincke’s needle was inserted in the L3-4 or L2-3 interspaces. All the patients were received 3 mL of 0.5% of bupivacaine heavy in the sub-arachnoid space over a period of 12-15 seconds. Immediately after the injection, the patients were positioned supine. The level of sensory block was checked by pin prick method. Supplemental oxygen was administered through nasal catheter at two litres per minute. Maintenance fluid of 1.5 mL/kg/hr of ringer lactate were administered to patients in both the groups.
Measurements
Using a multi parameter monitor, (MBP SBP DBP) and pulse rate were recorded at 20 minutes before pre loading (baseline), after pre loading (zero minute), 3 minutes interval up to 1st 30 minutes and 5 minutes interval till the end of surgery. Need for vasopressor (ephedrine hydrochloride) and episodes of nausea and vomiting also recorded in the two groups.
Spinal Induced Hypotension (SIH) [5] was defined as fall of mean arterial pressure by more than 20% from baseline values. Hypotension was treated with bolus doses of 3 mg ephedrine hydrochloride IV and was repeated as long as the BP stayed below 80% from the baseline. When the BP decreased to less than 70% of the calculated baseline value, ephedrine hydrochloride 6 mg intravenous boluses were administered till BP returned to within 80% of the baseline. Hypotensive events were not followed by extra fluid loading in the event of blood loss (more than 500 mL of blood loss as assessed by volume in suction bottle and weighing of swabs, the patient was excluded from the study and treated appropriately).
Bradycardia was defined as pulse rate less than 60 per minute. Bradycardia was treated with bolus dose of 0.6 mg of atropine IV and dose was repeated until pulse rate returns to ≥60/min. Episode of nausea was recorded by the nausea score [6] (0-no nausea, 1-mild, 2-moderate and 3-severe). Nausea was recorded any time the patient complains of nausea or notice to have vomited during intraoperative period.
Statistical Analysis
Statistical testing was conducted with the Statistical Package for the Social Science system (SPSS) version 17.0. Continuous variables were presented as mean±SD or median if the data was unevenly distributed. Categorical variables were expressed as frequencies and percentages. The comparison of normally distributed continuous variables between the groups was performed using Student’s t-test. Nominal categorical data between the groups was compared using Chi-square test or Fisher’s-exact test as appropriate. Non-normal distribution continuous variables were compared using Mann-Whitney U test (Wilcoxan Ranksum Test). For all statistical tests, a p-value less than 0.05 were taken to indicate a significant difference.
Results
A total of 80 patients of lower abdominal surgeries under spinal anaesthesia were enrolled in this study (40 patients in each group). The groups were comparable for demographic variables like age, gender, height, weight, and ASA physical status [Table/Fig-2].
Demographic data of the study subjects.
| Parameter | Group H (n=40) Mean±SD | Group P (n=40) Mean±SD | p-value |
|---|
| Age (years) | 42.00±10.12 | 40.33±8.59 | 0.43a |
| Gender (M:F) | 24:16 | 25:15 | 0.86b |
| Height (cm) | 164.9±8.98 | 165.13±10.32 | 0.92a |
| Weight (Kg) | 68.67±9.22 | 69.13±8.07 | 0.82a |
| ASA physical status (ASA I: ASA II) | 25:15 | 22:18 | 0.46b |
aUnpaired student t-test; bChi-square test
H: Hetastarch; P: Plasmalyte; ASA: American society of anaesthesiologist
The baseline readings of MBP and DBP for both the groups were comparable. Both the groups had initial rise in Mean and DBP from 20 minute (baseline value) till the time of block (at the time of block) due to fluid administration [Table/Fig-3,4].
Variation in Mean Arterial Blood Pressure (MBP).
| Mean Arterial Blood Pressure (MBP) time interval (Minutes) | Group H Mean±SD (mmHg) | Group P Mean±SD (mmHg) | p-value (Wilcoxanranksum) |
|---|
| MBP (20 minutes before pre loading) | 88.55±11.06 | 87.35±10.03 | 0.449 |
| MBP (at the time of block) | 92.35±13.65 | 91.40±10.44 | 0.758 |
| MBP (3 minutes after block) | 90.55±12.82 | 91.40±9.81 | 0.798 |
| MBP (6 minutes after block) | 88.17±9.80 | 87.47±10.24 | 0.754 |
| MBP (9 minutes after block) | 86.20±12.41 | 79.60±13.72 | 0.020 |
| MBP (12 minutes after block) | 85.45±11.40 | 77.77±11.73 | 0.003 |
| MBP (15 minutes after block) | 84.40±11.64 | 76.90±9.63 | 0.003 |
| MBP (18 minutes after block) | 83.11±9.20 | 77.70±11.90 | 0.008 |
| MBP (21 minutes after block) | 83.80±11.22 | 77.23±11.70 | 0.003 |
| MBP (24 minutes after block) | 83.47±11.50 | 78.93±12.40 | 0.069 |
| MBP (27 minutes after block) | 85.42±12.61 | 83.17±10.40 | 0.300 |
| MBP (30 minutes after block) | 83.35±13.80 | 79.67±12.21 | 0.208 |
| MBP (45 minutes after block) | 81.81±7.30 | 2.90±8.11 | 0.812 |
| MBP (60 minutes after block) | 82.10±9.41 | 76.11±7.50 | 0.087 |
| MBP (75 minutes after block) | 82.80±4.41 | 73.02±11.72 | 0.211 |
| MBP (90 minutes after block) | 80.50±3.51 | 72.00±12.10 | 0.374 |
MBP: Mean blood pressure; S: Significant (p<0.05), Mean±SD: Mean±Standard deviation; H: Hetastarch; P: Plasmalyte; bold p-values denote significance
Variation in Diastolic Blood Pressure (DBP).
| Diastolic Blood Pressure (DBP) time interval (Minutes) | Group H Mean±SD (mmHg) | Group P Mean±SD (mmHg) | p-value (Wilcoxanranksum) |
|---|
| DBP (20 minutes before pre loading) | 74.01±10.52 | 70.02±8.30 | 0.619 |
| DBP (at the time of block) | 76.32±12.91 | 76.77±8.90 | 0.988 |
| DBP (3 minutes after block) | 73.71±12.02 | 72.44±9.92 | 0.839 |
| DBP (6 minutes after block) | 73.11±9.81 | 69.61±9.42 | 0.210 |
| DBP (9 minutes after block) | 70.21±9.33 | 64.55±10.02 | 0.020 |
| DBP (12 minutes after block) | 70.92±11.04 | 65.12±8.30 | 0.023 |
| DBP (15 minutes after block) | 71.12±12.30 | 65.62±10.84 | 0.037 |
| DBP (18 minutes after block) | 70.44±10.82 | 64.81±10.35 | 0.015 |
| DBP (21 minutes after block) | 68.91±9.10 | 64.22±8.62 | 0.016 |
| DBP (24 minutes after block) | 68.75±11.13 | 66.14±10.60 | 0.323 |
| DBP (27 minutes after block) | 68.64±13.02 | 69.10±10.12 | 0.870 |
| DBP (30 minutes after block) | 67.51±14.51 | 65.81±10.30 | 0.563 |
| DBP (45 minutes after block) | 67.82±7.04 | 64.57±8.82 | 0.738 |
| DBP (60 minutes after block) | 67.11±8.80 | 64.65±7.22 | 0.480 |
| DBP (75 minutes after block) | 70.62±8.10 | 66.60±7.22 | 0.268 |
| DBP (90 minutes after block) | 69.01±1.42 | 65.32±8.01 | 0.563 |
DBP: Diastolic blood pressure; S: Significant (p<0.05), Mean±SD: Mean±Standard deviation; bold p-values denote significance
Both groups showed a fall in MBP and DBP immediately after the block. Both groups showed decline in MBP and DBP after the block but the difference was statistically significant at 9, 12, 15, 18 and 21 minute (p-value <0.05) in group P [Table/Fig-3,4]. The initial rise in SBP at the time of block was more in group H than in group P. Decline in SBP was seen in both the groups but the difference was not significant (p-value >0.05) [Table/Fig-5].
Variation in Systolic Blood Pressure (SBP).
| Systolic Blood Pressure (SBP) time interval (Minutes) | Group H (mmHg) Mean±SD | Group P (mmHg) Mean±SD | p-value (Wilcoxanranksum) |
|---|
| SBP (20 minutes before pre loading) | 124.80±12.51 | 124.01±11.73 | 0.678 |
| SBP (at the time of block) | 131.24±17.61 | 127.40±12.21 | 0.455 |
| SBP (3 minutes after block) | 121.52±21.94 | 121.30±12.04 | 0.531 |
| SBP (6 minutes after block) | 117.12±12.10 | 121.12±14.21 | 0.129 |
| SBP (9 minutes after block) | 116.52±10.84 | 121.30±15.34 | 0.360 |
| SBP (12 minutes after block) | 118.50±13.10 | 117.42±15.96 | 0.544 |
| SBP (15 minutes after block) | 127±17.09 | 118.75±13.95 | 0.567 |
| SBP (18 minutes after block) | 121.50±14.21 | 115.86±17.72 | 0.169 |
| SBP (21 minutes after block) | 119.71±14.32 | 114.73±10.44 | 0.109 |
| SBP (24 minutes after block) | 118.44±13.45 | 115.31±17.53 | 0.326 |
| SBP (27 minutes after block) | 119.30±15.82 | 112.41±15.30 | 0.054 |
| SBP (30 minutes after block) | 117.40±15.22 | 113.51±13.90 | 0.232 |
| SBP (45 minutes after block) | 115.82±10.52 | 110.12±15.50 | 0.245 |
| SBP (60 minutes after block) | 116.50±12.72 | 113.11±10.56 | 0.381 |
| SBP (75 minutes after block) | 118.2±15.84 | 109.3±26.00 | 0.099 |
| SBP (90 minutes after block) | 116.0±11.40 | 106.0±27.03 | 0.083 |
SBP: Systolic blood pressure; Mean±SD: Mean±Standard deviation
On comparison between the two groups, the readings were almost similar to each other and the difference of Pulse Rate (PR) in the two groups was not statistically significant (p-value >0.05) [Table/Fig-6].
Variation in Pulse Rate (PR).
| Pulse Rate (PR) | Group H Mean±SD (beats/min) | Group P Mean±SD (beats/min) | p-value (Wilcoxanranksum) |
|---|
| PR (20 minutes before pre loading) | 84.72±9.52 | 85.73±11.50 | 0.675 |
| PR (at the time of block) | 86.42±9.61 | 86.95±11.22 | 0.586 |
| PR (3 minutes after block) | 84.52±13.61 | 80.31±12.83 | 0.111 |
| PR (6 minutes after block) | 81.80±12.72 | 81.2412.13 | 0.843 |
| PR (9 minutes after block) | 81.25±13.81 | 81.90±10.43 | 0.873 |
| PR (12 minutes after block) | 79.92±14.11 | 81.83±10.45 | 0.556 |
| PR (15 minutes after block) | 78.93±13.35 | 80.01±10.80 | 0.710 |
| PR (18 minutes after block) | 79.02±13.32 | 77.71±11.30 | 0.661 |
| PR (21 minutes after block) | 78.45±12.53 | 77.10±11.32 | 0.596 |
| PR (24 minutes after block) | 77.74±13.12 | 75.32±10.92 | 0.330 |
| PR (27 minutes after block) | 76.77±10.92 | 73.83±10.10 | 0.205 |
| PR (30 minutes after block) | 74.84±10.21 | 71.81±10.72 | 0.121 |
| PR (45 minutes after block) | 73.66±8.73 | 69.54±11.01 | 0.133 |
| PR (60 minutes after block) | 72.36±7.32 | 68.01±5.80 | 0.607 |
| PR (75 minutes after block) | 69.22±10.45 | 72.02±5.34 | 0.794 |
| PR (90 minutes after block) | 67.55±10.61 | 69.35±8.40 | 0.275 |
PR: Pulse rate; Mean±SD: Mean±Standard deviation
A 30% patients in group P as compared to 10% in Group H required ephedrine for the treatment of hypotension and found significant. (p-value <0.05) [Table/Fig-7].
| Ephedrine requirement analysis | Group H | Group P | p-value (Chi-square test) |
|---|
| Number (%) | Number (%) |
|---|
| Ephedrine not required | 36 (90) | 28 (70) | 0.025 |
| Ephedrine required | 4 (10) | 12 (30) |
| Total | 40 (100) | 40 (100) |
Although no significant difference was observed between the two groups in terms of nausea and vomiting, however fewer patients had nausea in Hetastarch group. None of the patients experienced vomiting (p-value >0.05) [Table/Fig-8].
Nausea score of all subjects.
| Nausea score | Nausea and vomiting | p-value (Chi-square test) |
|---|
| Group H | Group P |
|---|
| Number | Number |
|---|
| 0 | 37 (92.5%) | 33 (82.5%) | 0.39 |
| 1 | 2 (5%) | 5 (12.5%) |
| 2 | 1 (2.5%) | 2 (5%) |
Discussion
This study was conducted to evaluate between Plasmalyte (isotonic crystalloid) and 6% Hetastarch (colloid) for prophylactic measures, to prevent and treat for spinal anaesthesia induce hypotension. Pharmacokinetics of crystalloid explains its limited efficacy as crystalloids is quickly distributed from intravascular to extravascular space [7]. It was found that both groups showed a fall in MBP immediately after the block. Group P showed more decline in MBP and DBP after the block and the difference was statistically significant at 9, 12, 15, 18 and 21 minute (p-value <0.05). A 30% patients in group P as comparison to 10 % in Group H required ephedrine for the treatment of hypotension and found significant (p-value=0.025). Pulse rate changes, SBP, nausea and vomiting among both groups was non-significant (p-value >0.05).
Blood Pressure (BP): Group H and group P, both showed initial rise in MBP, SBP and DBP at the time of block due to pre loading of fluids. Gousheh MR et al., found that the mean percentage of variation of SBP was negative in the intervention groups indicating decreased SBP from the beginning of spinal until 30 minutes after that [8]. The change in percentage of SBP in crystalloid solution group was higher (p-value=0.008). Also, mean percentage of variation of DBP was negative in the two groups and the percentage of this decrease was higher in the crystalloid solution group (p-value=0.042). Whereas, this study found significant decrease in MBP and DBP in Plasmalyte (crystalloid) group than 6% Hetastarch (colloid) group at 9, 12, 15, 18 and 21 minute after block (p-value <0.05). SBP changes were non-significant among both groups throughout the study period (p-value >0.05). Contrary to this study, Fathi M et al., used same amount of pre loading (10 mL/kg) for both colloid and crystalloid group and Saghafinia M et al., also did co-loading along with pre loading [9,10]. This is the reason they did not find any significant difference among both colloid and crystalloid group regarding the SBP and DBP.
Pulse Rate (PR): Group H and group P showed increase of pulse rate during pre loading, but this was not statistically significant. Gousheh MR et al., showed that mean percentage of HR changes had significant difference between the intervention groups; the rate of changes was more in the crystalloid group than the colloid group [8]. Whereas, Alimian M et al., found no significant difference between hydroxyethyl starch 6% and crystalloids group for heart rate [11].
Spinal induced hypotension: This study showed that hetastarch group had 10% incidence of hypotension and plasmalyte group had 30% incidence of hypotension. This was consistent with the findings of Siddik SM et al., who found less hypotension in colloid group than crystalloid group among parturients [12]. As far as non-parturients are concerned, the study by Madi-Jebara S et al., compared one litre of RL (crystalloid) with 500 mL of HES when used prior to spinal anaesthesia [13]. The study found the incidence of hypotension to be 63.9% in group HES (39 patients) and 81.4% in group RL (48 patients) and this difference was significant.
Kumar P and Rao S, showed higher BP decline in colloid solution group [14]. Osazuwa IH and Ebague A, and Cardoso MM et al., found no significant difference between the colloid and crystalloids groups regarding BP decline [15,16]. The mean total dose of ephedrine in the present study was smaller in group Hetastarch compared to Plasmalyte and the difference was statistically significant (p-value=0.025). This findings match with that of Madi-Jebara S et al., who found that the total dose of ephedrine was statistically smaller (p=0.001) in group HES compared with group LR [13]. Sharma SK et al., observed that the LR group required significantly more bolus doses of ephedrine [17].
Nausea and vomiting: The episodes of nausea/vomiting were recorded in the first 20 minutes after the block and nausea was less frequent in the colloid group than the crystalloid group. It was similar to the study done by Gousheh MR et al., and Sharma SK et al., who found no difference in the incidence of nausea and vomiting [8,17].
Limitation(s)
Rate of infusion was not fixed as it was injected via 50 mL syringe although it was given over 20 minutes. Adverse effects of colloids on coagulation profile were not studied using laboratory tests. Only clinical examination was done looking for excessive bleeding. The reason for not using laboratory investigations was that the amount of colloids was within the recommended dosages. Also, level of block was assessed by pin prick method, whereas sympathetic blockade may extend 2-6 segments above the somatic sensory dermatome level. Hetastarch though prevented hypotension more than Plasmalyte, it is much expensive than Plasmalyte.
Conclusion(s)
This study found that pre loading with 5 mL/kg of 6% Hetastarch is more effective than 15 mL/kg of Plasmalyte in preventing hypotension in patients undergoing lower abdominal surgeries under spinal anaesthesia. However, the incidence of hypotension was only reduced but not completely eliminated. It is possible that larger volumes of both the fluids might have reduced the incidence of hypotension even further. As compared to other crystalloids it has a similar osmolality as that of plasma it may be argued that if used in larger amounts it may negate the difference in the outcome found in this study.
aUnpaired student t-test; bChi-square test
H: Hetastarch; P: Plasmalyte; ASA: American society of anaesthesiologist
MBP: Mean blood pressure; S: Significant (p<0.05), Mean±SD: Mean±Standard deviation; H: Hetastarch; P: Plasmalyte; bold p-values denote significance
DBP: Diastolic blood pressure; S: Significant (p<0.05), Mean±SD: Mean±Standard deviation; bold p-values denote significance
SBP: Systolic blood pressure; Mean±SD: Mean±Standard deviation
PR: Pulse rate; Mean±SD: Mean±Standard deviation