Tuberculous Meningitis (TBM) infection is the most devastating form of Central Nervous System (CNS) infection. Although for improved diagnosis, a set of criteria like clinical findings, imaging, CSF profile, etc., has already been developed but not very useful for confirmed diagnosis as these mimic with other neurological infectious disorders hence do not provide a definite diagnosis. Microscopy and culture are still the major backbones for laboratory diagnosis of TBM but they are time-consuming and have a low sensitivity especially when dealing with CSF samples where bacterial load is quite low [1,2].
Molecular diagnostic testing for TBM has evolved over the last two decades and in general, the performance of molecular assays is acceptable, although variation in assay performance is observed, attributable not only to the design of the amplification step but also to sample preparation and the detection method. Secondly, variable sensitivity and specificity ranging from 20%-90% of the test is reported by various workers [1,3]. Another issue with molecular testing in developing and under-developing countries, it is not available in more than 70% of the diagnostic laboratory as it is quite expensive and sophisticated and also requires special expertise [4]. For detection of specific circulating antigens and antibodies, serological tests are more frequently used, particularly in epidemiological studies [5]. Serological testing detects an antigen or antibody generated as part of the immune response to infection with Mycobacterium Tuberculosis (MTB). Although several antigens and circulating antibodies of MTB have been evaluated for their diagnostic potential in screening TBM Cases. In previous studies using Sodium Dodecyl Sulphate-Polyacrylamide Gel Electrophoresis (SDS-PAGE), author’s have demonstrated a 30 Kd protein marker in the CSF of TBM patients. This 30 kD protein band was then analysed by Liquid Chromatography Tandem Mass Spectrometry (LC-MS/MS) and Two-Dimensional Polyacrylamide Gel Electrophoresis (2DPAGE). Both these studies i.e., LC-MS/MS and 2DPAGE identified the components of the TBM-specific 30 kD antigen: two mycobacterial antigens (Ag 85 A and B respectively, as members of Ag 85 complex) were also found to react with most CSF samples from TBM patients [6]. Jain RK et al., investigated the utility of Rv2623 a major dormancy regulon protein of MTB which might be useful as a potential biomarker for the diagnosis of the latent as well as active TBM infection [7]. Mishra AR et al., developed synthetic peptide based ELISA for the detection of antibodies using a panel of five MTB native proteins namely- Ag85B (Antigen 85B, Rv1886C), 45kDa (45kDa glycoprotein, Rv1860) HSP-16 (Heat Shock Protein 16, Rv2031c) CFP-10 (Culture filtrate Protein-10, Rv3874), ESAT-6 (Early Secretory Antigenic Target, Rv3875) for the rapid diagnosis of TBM Cases [8]. MTB antigen is an early marker for the acute stage of TBM and it is detectable in CSF earlier than MTB antibodies during acute infection [9]. When antibodies to MTB become detectable, antigens are often no longer demonstrable in the later stage of infection, most likely due to antigen-antibody complexing and may give false-negative tests [10]. This approach allows for the simultaneous detection of MTB antigens and antibodies and this approach may shorten the window period, i.e., the interval between TBM infection and detectable antigens/antibodies [11].
To overcome the above problems, present study aimed to evaluate the combination of MTB antigen Ag85 Complex (30KD Protein antigen) and Rv2623 (MTB universal stress protein) and antibodies (Anti-Ag85, Anti-45kD, Anti-HSP-16, Anti-CFP-10 Anti-GroES and Anti-ESAT-6) immunoassay panels in CSF sample of TBM patients admitted at a different time interval for the identification of an efficient biomarker panel for accurate diagnosis of the TBM cases.
Materials and Methods
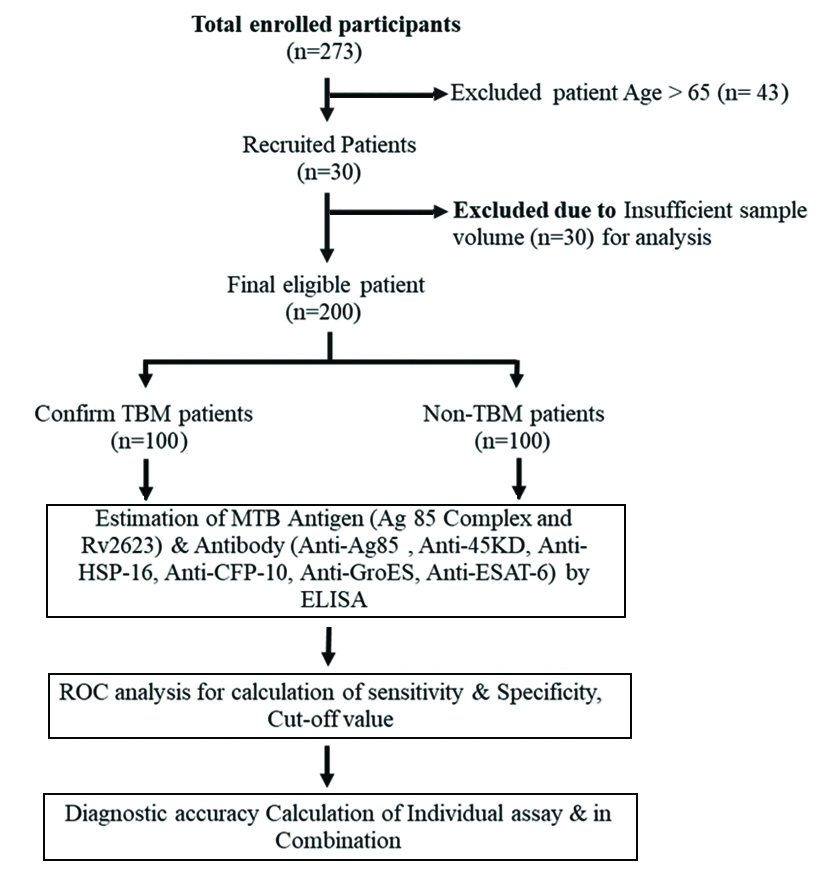
This prospective study was conducted in the Neurology Department of Central India Institute of Medical Sciences (CIIMS), a tertiary care hospital in Nagpur from October 2013 to April 2015. A total of 200 CSF samples were analysed. These consisted of confirmed TBM cases (n=100) and non-TBM cases i.e., disease control subjects with noninfectious neurological disorders (n=100). The sample size (n=187) was calculated using online available Raosoft Software, considering 90% of Confidence level and 6% of error rate. The diagnosis of the TBM patients was based on the clinical features including signs of meningeal irritation and subacute or chronic fever, and with or without other features of CNS along with CSF findings and diagnosis of non-TBM patients were based on the patients who had no evidence of CNS or extra-CNS tuberculosis and who had no clinical features of meningitis [6]. Present study was the part of inhouse research project of CIIMS, for which the approval of Institutional Ethics Committee of CIIMS, Nagpur was taken (CIIMS/IAEC/2012/TB-01).
Patients were eligible for participation in the study if they were between the ages of 18 and 65 years. Written consents were obtained from all the patients/or their relatives. To establish a diagnosis of TBM, 2-5 mL of CSF was withdrawn from patients using a lumbar puncture. A detailed clinical history of all the eligible patients was taken with particular emphasis on cough, headache, fever, neck stiffness, vomiting, abnormal, unconsciousness behaviour. CT or MRI scan was performed in all the patients.
CSF samples were collected for routine investigations such as cell count, India ink preparation for fungal protein, glucose measurement, and Acid-Fast Bacilli (AFB) staining [Table/Fig-1], microbial culture and Molecular diagnosis with Polymerase Chain Reaction (PCR) and remaining samples were stored at -80°C for estimation of MTB antigen (Ag85 Complex and Rv2623) and antibody (Ag85B, Hsp16, 45kD, GroES, CFP-10 and ESAT-6) immunoassay panel.
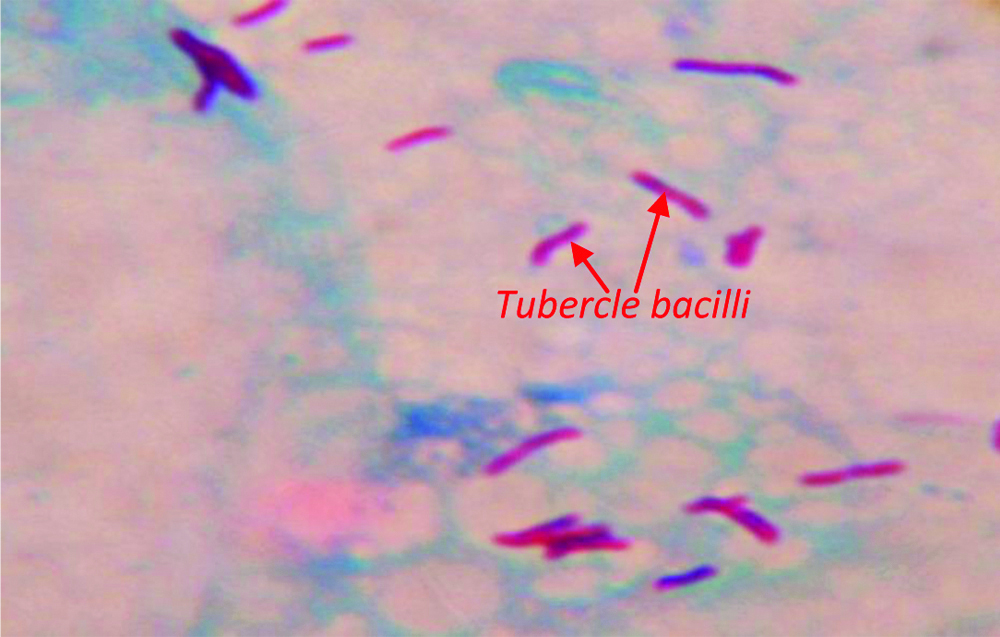
Photomicrograph depicting Acid Fast acid-fast Ziehl-Neelsen Staining of Mycobacterium tuberculosis in CSF sample; 1000 X.
Culture of CSF samples was done in BAC T/ALERT 3D machine which is an automated liquid culture system. It detects live microorganisms (Mycobacterium species or other microorganisms) based on CO2 (gas) generated as a byproduct of the metabolic growth of organisms. In brief, CSF was pelleted and suspended in MP bottles containing Middlebrook 7H11 medium (bioMérieux, Inc, Durham, NC) and was loaded into a BacT/Alert 3D machine (bioMérieux, Inc, Durham, NC). Bottles were then incubated at 37°C for 42 days as per the manufacturer’s instructions [12].
Inclusion criteria: Inclusion criteria for TBM and non-TBM patients are as follows:
TBM group: This included patients in whom AFB was demonstrated by smear and/or cultures or PCR positive along with subacute or chronic fever and signs of meningeal irritation with or without other features of CNS abnormality. CSF finding showed increased protein level and decreased glucose level (CSF/blood glucose ratio, 0.5) and/or pleocytosis with a lymphocytic predominance [13]. Patients with radiological findings (i.e., CT or MRI) were included in this group.
Non-TBM group: This included patients with no evidence of extra-CNS tuberculosis either by smear and/or cultures or PCR and radiological findings. Patients diagnosed with pyogenic viral meningitis (n=3) were included in this group.
Exclusion criteria: Patients who had HIV or diagnosed with fungal infection were excluded from the study.
MTB Antigen detection
The presence of two MTB Antigens namely Ag85 Complex and Rv2623 was estimated using the indirect ELISA protocol as described by Kashyap RS et al., [7]. In brief 100 μL of CSF sample (1:5 dilutions) in Phosphate Buffer Saline (PBS) was coated on 96 well ELISA plates and Incubated for 90 minutes at 37°C. The wells were then washed with PBS-with Tween20 (PBS-T) and blocked with 0.5% Bovine Serum Albumin (BSA) in PBS for 45 minutes at 37°C. After blocking 100 μL of polyclonal antibody raised against Ag 85 complex antigen or monoclonal antibody against Rv2623 antigen were added to the wells (1:2000 dilutions) and incubated for 45 minutes at 37°C. The wells were washed with PBS-T three time followed by the addition of 100 μL of secondary antibody (Goat anti-rabbit IgG or Rabbit anti-mouse IgG HRP conjugated) at 1:10000 dilution in PBS and incubated at 37°C for 45 minutes. After another washing with PBS four time, 100 μL of the TMB/H2O2 substrate solution was added to the wells and incubated at room temperature for about 15 minutes. Then reaction was stopped using 100 μL of 2.5 N H2SO4. The colour absorbance of each well was read at 450 nm. Each sample was tested in triplicates.
Multiplex-Antibody detection
Antibody detection assay using antigens and immunogenic peptides of MTB was carried out using in house developed protocol by Kashyap RS et al., [8]. Multiplex antibody ELISA was used to detect antibodies to MTB antigens in the CSF samples of both groups. In brief, wells of microtiter plates were coated with 100 μL of six MTB antigens namely (Ag85B complex and Hsp16-4ng/well. A 45kD, GroES, CFP-10-1ng/well and ESAT-6-5ng/well) diluted in PBS (ph=7.4) and incubated three hours at 37°C. The wells were then washed and blocked with 0.5% BSA in PBS for two hours at 37°C. After blocking the plates were washed once and kept overnight at 4°C. Next day the plates were washed twice with PBS-T and 100 μL of CSF samples (1:5 dilution in PBS) were added and incubated for 35 minutes at 37°C. After incubation, the wells were washed three-time and incubated with secondary antibody goat anti-human IgG HRP conjugate (1:10000 dilution in PBS) for 30 minuts at 37°C. The wells were washed four times with PBS-T after the incubation followed by the addition of 100 μL TMB/H2O2 substrate and incubated at room temperature for 2-3 minutes. The reaction was stopped by the addition of 100 μL of 2.5N H2SO4. The colour absorbance of each well was read at 450 nm. Each sample was tested in triplicates.
Statistical Analysis
All the statistical analyses were performed using the MedCalc (version 10) statistical software. Cut-off, Diagnostic sensitivity and specificity of MTB antigen (Ag85 Complex and Rv2623) and antibody (Anti-Ag85, Anti-45kD, Anti-HSP-16, Anti-CFP-10 Anti-GroES and Anti-ESAT-6) immunoassay panel were calculated using Receiver Operating Characteristic (ROC) analysis. Accuracy of the diagnostic test is calculated using standard statistical formula (i.e., total no true Positive cases+total no true negative cases/Total no of cases). Here true positive cases means the evaluated test has correctly identified the diseased cases as positive, likewise true negative cases means the evaluated test has correctly identified not diseased as negative [14]. The comparison of the CSF parameter between TBM and non-TBM patients was performed using a student t-test. A p-value <0.05 was considered statistically significant for all the analyses.
Results
Out of 273 patients enrolled for study 73 were excluded due to overage (>65 years) (n=43) and due to very less CSF volume for analysis (n=30). Finally, antigen and antibody panel assay was performed in 200 patient samples which include 100 TBM patients and 100 Non-TB patients as shown in [Table/Fig-2].
Baseline and CSF characteristics of TBM and non-TBM patients were given in [Table/Fig-3]. There were significantly (p<0.05) more patients in the TBM group who had complaints of headache, fever, neck stiffness, vomiting, abnormal behaviour, unconsciousness as compared with non-TBM patients. There was a significant (p<0.05) decrease in CSF sugar in TBM patients (31.83±28.29) as compared with non-TBM patients (58.74±35.18). Similarly, Increase (p<0.05) in total cell count, protein, parallel blood sugar, and decline in CSF sugar and parallel blood sugar ratio were observed in TBM patients (vs. non-TBM).
Shows the baseline and CSF characteristics of TBM (n=100) and non-TBM (n=100) patients.
| Characteristics | Non-TBM n (%) | TBM n (%) |
|---|
| Age (years) |
| <18 | 10 (10) | 8 (8) |
| 18-65 | 40 (40) | 51 (51) |
| >65 | 50 (50) | 41 (41) |
| Sex (M/F) | 58/42 (58/42) | 61/39 (61/39) |
| Headache | 25 (25) | 44 (44)* |
| Fever | 12 (12) | 31 (31)* |
| Neck stiffness | 1 (1) | 10 (10)* |
| Vomiting | 12 (12) | 29 (29)* |
| Abnormal behaviour | 8 (8) | 20 (20)* |
| Unconsciousness | 32 (32) | 60 (60)* |
| Drowsiness | 11 (11) | 18 (18) |
| CSF profile |
| Total cell count (cells/cum) | 64±159 | 142±163* |
| Sugar (mg/dL) | 58.74±35.18 | 31.83±28.29* |
| Protein (mg/dL) | 75.88±45.79 | 148.76±250.74* |
| Parallel blood sugar (mg/dL) | 130.11±35.78 | 141±38.54* |
| Parallel blood sugar ratio | 0.57±0.3 | 0.39±0.21* |
*p<0.05 TBM VS non TBM
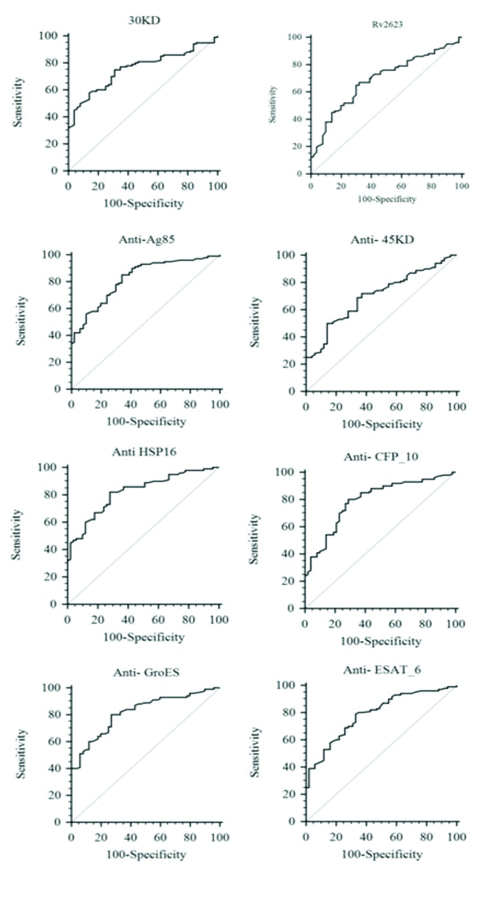
[Table/Fig-4,5] depicts the area under curve, cut-off, diagnostic sensitivity and specificity, of the studied antigen and antibody assay calculated using (ROC) analysis. Diagnostic sensitivity of MTB Antigen Ag85 Complex and Rv2623 is 75%, 67%. Diagnostic sensitivity of MTB Specific Antibody Anti-Ag85, Anti-45kD, Anti-HSP-16, Anti-CFP-10 Anti-GroES and Anti-ESAT-6 estimation was found to be 85% 50%, 82%, 80%, 80% and 79%, respectively (p<0.05). Similarly, diagnostic specificity of MTB Antigen Ag85 Complex and Rv2623 is 69% and 68%. Diagnostic specificity of MTB Specific Antibody Anti-Ag85, Anti-45kD, Anti-HSP-16, Anti-CFP-10 Anti-GroES and Anti-ESAT-6 estimation was found to be 66%, 86%, 72%, 71%, 73% and 67%, respectively (p<0.05). The area under the curve (AUC) as shown in [Table/Fig-5] was determined to evaluate accuracy of each biomarker. The AUC of eight biomarkers were ranges from 0.6-0.8. Highest AUC values were observed for Anti-Ag85 complex (AUC-0.823), followed by Anti-HSP-16 (AUC-0.821) and Anti-GroES (AUC-0.818) antibody detection, indicating the high discriminatory ability for TBM and non-TBM cases compared with other biomarkers in the panel. It was found that the sensitivity of individual antigen and antibody assay ranges from 50% to a maximum of 85%. Likewise, the specificity of individual antigen and antibody assay ranges from 66% to 86%.
Represent the Receiver Operating Characteristic curve (ROC) analysis, of MTB antigens (Ag85 Complex and Rv2623) and antibody (Anti-Ag85, Anti-45kD, Anti-HSP-16, Anti-CFP-10 Anti-GroES and Anti-ESAT-6) immunoassay result in CSF sample of TBM patient.
Shows the sensitivity, specificity, % cut-off value of eight biomarkers (Two antigens and six antibodies) for diagnosis of differential diagnosis of TBM and non-TBM patient calculated by ROC curve analysis.
| Biomarkers | AUC | Sensitivity (%) | Specificity (%) | 95% CI range | Cut-off | p-value |
|---|
| Ag85 complex | 0.756 | 75 | 69 | 0.690 to 0.814 | >0.516 | 0.0001 |
| Rv2623 | 0.689 | 67 | 68 | 0.620 to 0.753 | >0.239 | 0.0001 |
| Anti-Ag85 | 0.823 | 85 | 66 | 0.763 to 0.873 | 0.259 | 0.0001 |
| Anti-45kD | 0.703 | 50 | 86 | 0.634 to 0.765 | >0.569 | 0.0001 |
| Anti-HSP-16 | 0.821 | 82 | 72 | 0.761 to 0.871 | 0.312 | 0.0001 |
| Anti-CFP-10 | 0.793 | 80 | 71 | 0.730 to 0.847 | 0.305 | 0.0001 |
| Anti-GroES | 0.818 | 80 | 73 | 0.758 to 0.869 | >0.333 | 0.0001 |
| Anti-ESAT-6 | 0.789 | 79 | 67 | 0.726 to 0.844 | 0.268 | 0.0001 |
AUC: Area under curve
This study depict the positivity of the MTB antigen (Ag85 Complex and Rv2623) and antibody (Ag85B, Hsp16, 45kD, GroES, CFP-10 and ESAT-6) immunoassay in CSF samples of TBM (n=100) and non-TBM (n=100) cases. A significant number (p<0.05) of TBM patient positive (96/100) for at least 2 assays as compared to non-TBM patients (52/100) were observed (supplemental data).
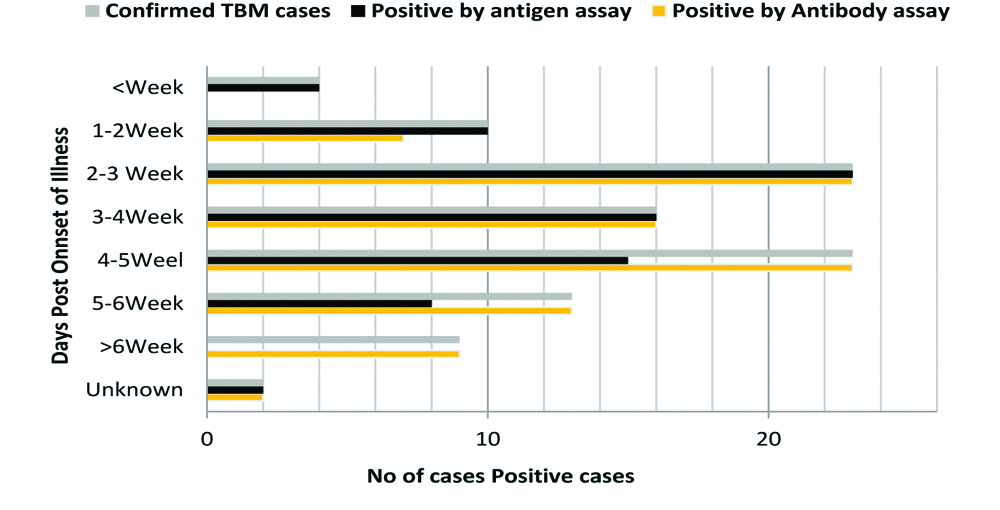
[Table/Fig-6] shows MTB antigen (Ag85 Complex and Rv2623) and antibody (Anti-Ag85, Anti-45kD, Anti-HSP-16, Anti-CFP-10 Anti-GroES and Anti-ESAT-6) response in TBM subjects admitted at different time interval (in weeks). It was found that the frequency of antigen positivity was more in patients admitted early (i.e., <2 weeks) and the frequency of antibody positivity was more among the late referral cases (i.e., >4 weeks). While positivity of the antigen and antibody assay was observed to be similar among the TBM cases referred between 2nd and 4th weeks, respectively.
Shows MTB antigens (Ag85 Complex and Rv2623) and antibody (Anti-Ag85, Anti-45kD, Anti-HSP-16, Anti-CFP-10 Anti-GroES and Anti-ESAT-6) response in TBM subjects admitted at different time interval (in weeks).
Total confirm cases (n=100); positive by antigen (n=78) and positive by antibody (n=92)
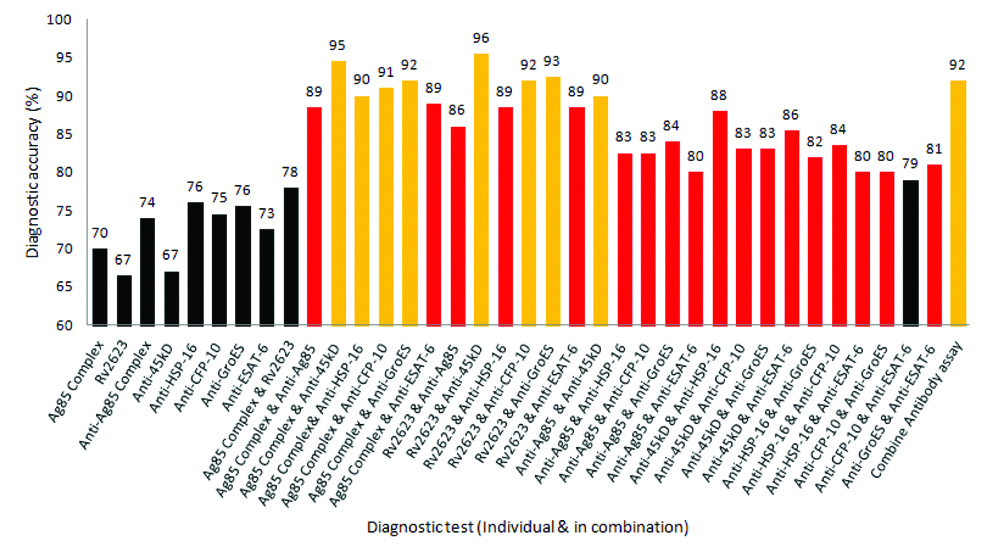
[Table/Fig-7] depicts the accuracy of antigen (Ag85 Complex and Rv2623) and antibody (Anti-Ag85, Anti-45kD, Anti-HSP-16, Anti-CFP-10 Anti-GroES and Anti-ESAT-6) immunoassay, with all possible combinations for diagnosis of TBM. It was found diagnostic accuracy individual assay ranges from 67% to a maximum of 76%. Interestingly, the accuracy of the combined assay (2 assays at a time) shows more than 85% accuracy with most of the combination. Two Combinations of antigen and antibody assay i.e., (30KD-Anti 45KD antibody assay and Rv2623-Anti 45KD antibody assay) had shown an accuracy of 95% and 96%, respectively.
Depicts the accuracy of antigen (Ag85 Complex and Rv2623) and antibody (Ag85B, Hsp16, 45kD, GroES, CFP-10 and ESAT-6) immunoassay, with all possible combinations for diagnosis of TBM.
Discussion
In the present study, distribution of age and sex was similar in the study population. Complaints of headache, fever, vomiting and unconsciousness were more common among the TBM patients as compared with non-TBM patients. Similarly TBM patients had an increased total cell count, protein, parallel blood sugar, and decline in CSF sugar and parallel blood sugar ratio. These finding were in agreement with the previous report by Luo M et al., [15].
The present study has comparatively evaluated the combination of MTB antigens (Ag85 Complex and Rv2623) and antibody (Anti-Ag85, Anti-45kD, Anti-HSP-16, Anti-CFP-10 Anti-GroES and Anti-ESAT-6) immunoassay in CSF sample of TBM and non-TBM patient admitted at a different time interval of towards identification of an efficient biomarker panel for accurate diagnosis of the TBM cases.
Frequency of antigen positivity was more in patients admitted early (i.e., <2 weeks) and the frequency of antibody positivity was more among the late referral cases (i.e., >4 weeks). While the positivity of the antigen and antibody assay was observed to be similar among the TBM cases referred between the 2nd and 4th week, respectively. It was found an accuracy of 67% to 76% with individual antigen and antibody assay and combinations of immunoassay increase the diagnostic acucracy of up to 96%. Two combination of antigen and antibody assay i.e., (30KD-Anti 45KD antibody assay and Rv2623-Anti 45KD antibody assay) was observed to be the best combination for accurate diagnosis of TBM cases.
Detection of MTB antigen and its antibody in the CSF sample provides a rapid means for the sensitive and specific diagnosis of TBM [16]. The number of MTB antigens has been evaluated so far for diagnosis of the extrapulmonary tuberculosis [17]. A 30KD antigen is a major secretion protein product of MTB also known as the Ag 85 complex consisting of three related proteins, Ag85A, Ag85B and Ag85C. It has been explored extensively for the diagnosis of pulmonary and extra-pulmonary tuberculosis [11,18]. Similarly, detection of the universal stress protein Rv2623 of MTB is also reported as a potential marker of TBM [7]. An increased level of MTB antigen RV2623 was also observed in the brain of MTB infected mice [19]. A significant immune response against the Rv2623 protein of MTB has also been reported in the sera of TB patients [10]. In this study, good sensitivity and specificity using Ag85 and RV2623 detection in CSF with an accuracy of 70% and 67% respectively was observed.
Similarly, antibodies against a variety of M. tuberculosis antigens have been detected in the sera and CSF of the active pulmonary and extrapulmonary TB [20]. Evaluation of the antibody response against MTB antigens like Ag8B [21], 45kD, GroES, CFP-10 [22] and ESAT-6 [20] have been used in many studies for sensitive and specific diagnosis of the TBM cases [8]. Similarly, significant increase in levels of MTB, Hsp16 and its Antibody have been reported in the TBM patient [23]. In this study, the detection of antibody against MTB antigens was in agreement with the above mentioned literatures. In the present study, good sensitivity and specificity with overall accuracy ranging from 67% to 76% was observed.
Prompt diagnosis of TBM infection allows early anti-TB treatment to minimise complications of the disease. Although antigen and antibody detection tests have been widely used for identifying TBM infection, their diagnostic sensitivity, specificity and accuracy get a compromise in many situations. Though the antigen detection test was reported to be the earliest specific test for the diagnosis of tuberculosis infection, its sensitivity varied greatly and has a limited value in the later stage of infection, most likely due to antigen-antibody complexing and may give false-negative test [17]. Further, sensitivity and specificity of antigen detection were reported to vary in a different population [24].
On the other hand sensitivity of the antibody detection assay was reported to compromise due to weak immune response in immune-compromised patients [20]. Similarly, a cross-reactivity of anti-TB antibody assay, with other Eukaryotic disease have also been reported and recommended to test antigen in combination with antibody [25]. Antibody detection also failed to distinguish between acute infection or a latent TB infection [26]. Antibody response also varies with antigen type as some antigens are more immunogenic than others, thus selection of the specific antigen for evaluation of antibody response is very crucial [27]. Similarly, heterogeneity in the antibody response to one or more antigens in the TB patients was observed as the recognition pattern to the particular antigen is different from person to person, indicating the role of genotype in the immune response [28].
The use of a combinatorial approach was reported to improve diagnostic sensitivity and reliability [29]. However, very limited data have been conducted to report for the evaluation of the combinatorial approach of Antigen and antibody estimation in the CSF sample for the diagnosis of TBM cases [22]. It was found that the frequency of antigen positivity was more in patients admitted early compared with late referral cases. The results of the combinatorial approach is in agreement with an earlier report, a significantly higher accuracy was observed with two combinations of antigen and antibody assay i.e., (30KD-Anti45KD antibody assay and Rv2623-Anti45KD antibody assay).
Limitation(s)
Few limitations associated with the study was that we have evaluated the panel in limited number of CSF sample (n=200), this is because, being a tertiary care center majority of patients were already been on different types of treatment from their family physician and primary health care centers, which affects their clear diagnosis, to be included them for the study. Despite this study, a good and accurate combined antigen and antibody panel was found, it demands further validation in the large set of samples, and multi-institutional involvement. It was also felt by authors that the evaluation of the panel in the follow-up CSF sample would also give important information regarding the patient prognosis which could not be done in the present study.
Conclusion(s)
The result of the present study suggested to consider the combination of antigen and antibody assay for early and accurate diagnosis of MTB infection and demand for further multicentric study to consolidate the present findings.
Authors contribution: ARN carried out the Conception and study design, acquisition of data, statistical analysis, data interpretation, literature search and manuscript preparation. VRH and ARM carried out the experiments and collected the data from all patients. PRK provided assistance in the preparation of the manuscript, study design and data interpretation. NHC participated in the preparation of the manuscript. HFD participated in study design, experiments, data interpretation, and literature search and manuscript preparation. LRS provided assistance in the preparation of the manuscript, data interpretation, study design and collecting funds. RSK planned and supervised the study design, statistical analysis, data interpretation, manuscript preparation and literature search. All authors read and then approved the final version of the manuscript.
*p<0.05 TBM VS non TBM
AUC: Area under curve