COVID-19 infection, which first reported as a cluster of pneumonia from Wuhan, China, in December 2019, has rapidly emerged as a global pandemic [1]. During the early course of the pandemic, Italy had the highest infection burden and India remained much less affected with corresponding mortality rates of 14.24% and 3.03% [2]. However, the recent trends from the country shows an exponential increase in daily spike and the total cases has crossed 75 lack mark, according to the Health Ministry data published on October 20, 2020; the officially confirmed deaths from the disease is around 1,14,646 [3].
Understanding and evaluating the demographic data pertaining to the disease is paramount to develop customised approaches to reduce the disease risk and public health policies. A study by Huang C et al., studied the clinical features of patients infected with 2019 novel coronavirus in Wuhan, China. The researchers found that 2019-novel coronavirus infection caused clusters of severe respiratory illness similar to Severe Acute Respiratory Syndrome Coronavirus (SARS-Cov) and was associated with ICU admission and high mortality [4]. A study conducted by Safdarjung Hospital COVID-19 working groups noted that the first 21 patients diagnosed with COVID-19 had the clinical presentation of mild upper respiratory tract infection, self-resolved with preserved vitals and organ-functions. All the subjects recovered with no residual symptoms [5].
Laskowski M et al., have reported that understanding the demographic characteristics of the population at risk is paramount to understand the pattern of epidemic spread and to determine the public health intervention measures to be adopted for effective disease management [6]. Novelty of study is its large sample size study with 577 patients having repeat swab to know the viral clearance.
The present study was intended to analyse demographic data of COVID-19 patients admitted in an Indian setting and to associate the same with clinical profile and disease outcomes.
Materials and Methods
The cross-sectional study was carried from March 2020 to June 2020 at a Bengaluru-based hospital setting. Approval and clearance were obtained from the Institutional Ethics Committee (BMCRI/PS/02/2020-21).
Inclusion criteria: The study included patients aged ≥18 years of both gender, diagnosed with COVID-19 infection by RT-PCR technique after taking informed consent within the defined study duration.
Exclusion criteria: The study excluded patients <18 years and those not willing to provide signed informed consent prior to the study.
Case record form with follow-up chart was used to record the demographic data, and duration and clinical features of the disease. The demographic and clinical data collected were age, sex, clinical symptoms and incidence of co-morbidities like hypertension, diabetes, and metabolic renal cardiac and respiratory disorders. All the selected participants were followed-up until discharge or death. Patients were grouped as survival and succumbed to death. As per the first swab discharge policy released by the state government, the patients were discharged after 14 days, if two consecutive throat/nasopharyngeal swabs taken 24 hrs apart were negative for SARS-CoV-2 Ribonucleic Acid (RNA) done using RT-PCR technique. If positive, the test was repeated after 72 hours [7].
As per the revised second policy, all mild and asymptomatic patients were discharged only after a repeat RT-PCR technique for SARS-CoV-2 RNA was negative, conducted seven days after the first test. If positive, test was repeated after 72 hours [8]. As per the third discharge policy, patients who had mild and moderate symptoms were discharged after 10 days without throat/nasopharyngeal swab test for COVID-19 [9]. In severe patients, 14th day discharge policy based on negative swab test was adopted and those who were positive, the tests were repeated every 3rd day till obtaining a negative result. For evaluating the mean days of viral clearance, many mild and moderate cases were not considered due to the implementation of the revised third discharge policy. The demographics and clinical outcomes (death and discharge) were further associated.
Statistical Analysis
Statistical analyses were carried out using software Ross Ilaha and Robert Gentleman (R) version 3.6. Continuous variables were expressed as means, and Standard Deviation (SD) and categorical variables were presented as counts and percentages. Different parameters were compared between the groups using t-test for continuous and Chi-square test for categorical data. The optimal cut points were estimated for significant continuous variables using Receiver Operating Curve (ROC) analysis. Multiple regression analysis was carried out and odds ratio with Confidence Interval (CI) were estimated to determine the effect of significant factors on outcome death and survival. A p-value <0.05 was considered as statistically significant.
Results
The study considered 2000 patients admitted to the hospital and was diagnosed positive for COVID-19. Twenty-three patients were referred to different hospitals due to various reasons. Among 1977 patients, 1419 (71.78%), 128 (6.47%) and 430 (21.75%) were classified according to the aforementioned third, first and second discharge policies. The average age of the patients was 43.89±15.58 years, and the mean age of survival and death noted were 42.74±15.15 years and 59.12±12.95 years, respectively (p<0.001). Fever, dyspnoea and cough were the major symptoms prevalent among patients who succumbed to death than in patients who survived (p-value <0.001) [Table/Fig-1].
Baseline and clinical characteristics of the participants.
| Variable | Total (n=1977) | Survived (n=1839) | Succumbed to death (n=138) | p-value* |
|---|
| Age (years) | 43.89±15.58 | 42.74±15.15 | 59.12±12.95 | <0.001 |
| Age group (years) n (%) |
| <30 | 422 (21.35) | 421 (22.89) | 1 (0.72) | <0.001 |
| 30-39 | 457 (23.12) | 448 (24.36) | 9 (6.52) |
| 40-49 | 369 (18.66) | 351 (19.09) | 18 (13.04) |
| 50-59 | 357 (18.06) | 314 (17.07) | 43 (31.16) |
| 60-69 | 246 (12.44) | 206 (11.2) | 40 (28.99) |
| ≥70 | 126 (6.37) | 99 (5.38) | 27 (19.57) |
| Gender n (%) |
| Male | 1215 (61.46) | 1119 (60.85) | 96 (69.57) | 0.042 |
| Female | 762 (38.54) | 720 (39.15) | 42 (30.43) |
| Smokers, n (%) | 32 (1.62) | 30 (1.3) | 2 (1.45) | 0.8795 |
| Laboratory parameters |
| Haemoglobin (g/dL) | 12.99±4.21 | 13.12±4.28 | 11.16±2.63 | <0.001 |
| TLC (counts/L) | 8292±9390.4 | 7872.18±3103.05 | 14078.4±3879.38 | <0.001 |
| Neutrophil (%) | 65.35±29.43 | 64.26±30.03 | 80.35±11.57 | <0.001 |
| Lymphocytes (%) | 26.00±11.83 | 27.18±11.47 | 13.45±9.02 | <0.001 |
| Neutrophils-lymphocytes ratio | 3.85±4.72 | 3.44±4.16 | 9.59±7.54 | <0.001 |
| LDH (U/L) | 299.2±168.21 | 281.46±142.42 | 542.43±275.36 | <0.001 |
| D-dimer (mcg/mL) | 1.14±5.27 | 1.05±5.4 | 1.81±2.92 | 0.248 |
| C-reactive protein (mg/dL) | 66.35±807.17 | 62.27±835.61 | 122.11±103.43 | 0.533 |
| Ferritin (ng/mL) | 341.36±747.79 | 285.71±391.99 | 1225.6±2502.91 | <0.001 |
| Co-morbidities |
| None | 1109 (56.09) | 1079 (58.67) | 30 (21.74) | <0.001 |
| Diabetes only | 118 (5.96) | 110 (5.98) | 8 (5.80) |
| Hypertension only | 98 (4.96) | 92 (5.00) | 6 (4.35) |
| Diabetes or hypertension with other complications | 418 (21.15) | 345 (18.76) | 73 (52.90) |
| CKD | 25 (1.26) | 17 (0.92) | 8 (5.80) |
| Other | 209 (10.58) | 196 (10.66) | 13 (9.42) |
| Oxygen requirement | 240 (7.08) | 103 (5.6) | 137 (99.28) | <0.001 |
| ICU requirement | 264 (13.35) | 126 (6.85) | 138 (100) | <0.001 |
| Asymptomatic | 941 (47.80) | 924 (50.24) | 17 (12.32) | <0.001 |
| Symptoms n (%) |
| Fever | 600 (30.35) | 532 (28.93) | 68 (49.28) | <0.001 |
| Dyspnoea | 361 (18.26) | 275 (14.95) | 86 (62.32) | <0.001 |
| Cough | 558 (28.22) | 489 (26.59) | 69 (30.00) | <0.001 |
| Sore throat | 132 (6.68) | 124 (6.74) | 8 (5.80) | 0.1842 |
| Myalgia | 207 (10.47) | 192 (10.44) | 15 (10.87) | 0.8738 |
| Headache | 19 (0.96) | 1 (0.72) | 18 (10.98) | 0.7679 |
| Others | 89 (4.50) | 80 (4.35) | 9 (6.52) | 0.2354 |
*Statistically significant if p<0.05 (t-test for continues data and chi-square test for categorical data)
For symptoms its only positive symptoms are mentioned. Its mentioned for each individual symptoms. Not overall. So total does not match
TLC: Total leucocyte count; LDH: Lactate dehydrogenase; CKD: Chronic kidney disease; ICU: Intensive care unit
Other symptoms noted were gastroenteritis (3), cold (10), pain abdomen (4), orbital cellulitis (1), diarrhoea (8), generalised weakness (19), pedal oedema (1), runny nose (1), generalised anorexia (1), decreased appetite (2), anosmia (8), taste loss (5), nasal congestion (3), burning micturition (1), diabetic foot (1), haemoptysis (1), joint pain (1), chest pain (3), haematuria (1), hiccups (1), nausea and pain (1), ansomia nasal block (1), loss of smell taste (1), nasal block (1), chills (1), anosmia and cold (1), bitter mouth (1), altered sensorium (3), psychosis (2) and nausea and vomiting (2).
The significant variables, except neutrophils and lymphocytes were further considered for multivariate logistic regression. Since NLR is a ratio of neutrophils and lymphocytes, only NLR was considered for the regression analysis. Variables like gender, haemoglobin, LDH, co-morbidities and asymptomatic nature of patients were found to be statistically significant. The analysis demonstrated that male patients were 2.68 times more likely to succumb to the disease when compared to female patients. A direct positive association was noted between asymptomatic status and increase chances for survival (OR 0.30, 0.09-0.78) [Table/Fig-2].
Results of multivariate logistic regression analysis of selected variables.
| Variables | OR | 95% CI | p-value |
|---|
| Age group (years) n (%) | <30 | 1 | | 0.12 |
| 30-39 | 8.46 | 1.07-67.04 |
| 40-49 | 21.59 | 2.87-162.53 |
| 50-59 | 57.65 | 7.9-420.92 |
| 60-69 | 81.75 | 11.16-598.8 |
| ≥70 | 144.82 | 15.42-855.13 |
| Gender | Female | 1.00 | 1.15-6.70 | 0.027 |
| Male | 2.68 |
| Laboratory parameters | Haemoglobin | 0.76 | 0.64-0.90 | 0.0017 |
| TLC count | 1.00 | 1.00-1.00 | 0.09 |
| Neutrophils lymphocytes ratio | 1.02 | 0.97-1.07 | 0.15 |
| LDH | 1.00 | 1.00-1.01 | 0.00019 |
| Ferritin | 1.00 | 1.00-1.00 | 0.08 |
| Co-morbidities | None | 1.00 | | 0.028 |
| Diabetes only | 1.84 | 0.36-7.32 |
| Hypertension only | 1.06 | 0.17-5.23 |
| Diabetes or hypertension with other complications | 1.80 | 0.69-4.49 |
| Chronic kidney disease | 12.97 | 1.17-118.54 |
| Other | 1.14 | 0.31-3.82 |
| Asymptomatic | No | 1.00 | | 0.019 |
| Yes | 0.30 | 0.09-0.78 |
TLC: Total leucocyte count; LDH: Lactate dehydrogenase
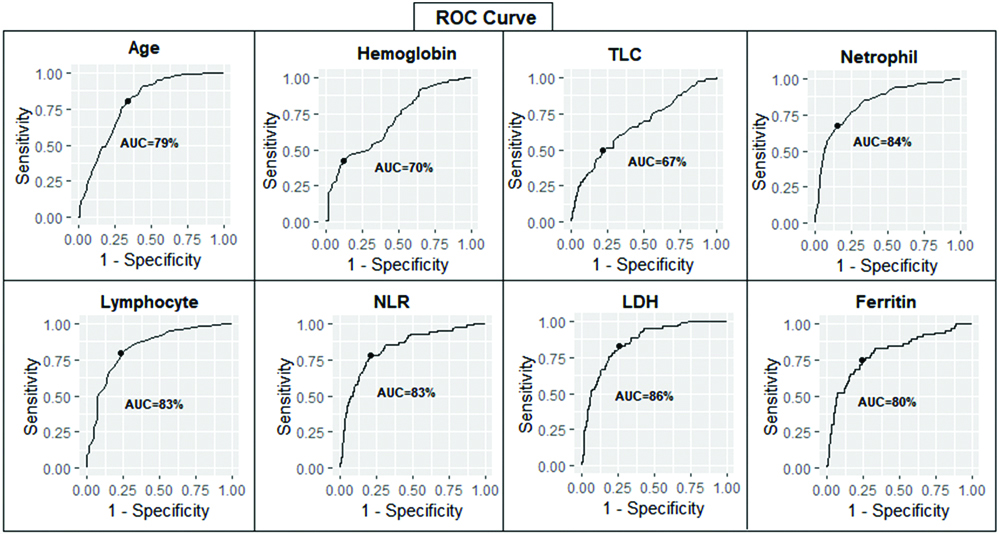
For continuous variables like age, Hb, TLC, Neutrophil, Lymphocytes, NLR, LDH and ferritin, cut-off points were determined through ROC analysis. All the variables were found to be potential predictors, as the Area Under Curve (AUCs) were more than 60%. Highest AUC was found for LDH (85.91%) with cut-off point of 318. Least AUC was found for TLC (67.01%) with cut-off point of 9800, and the corresponding specificity and sensitivity noted were 78.76% and 50% [Table/Fig-3,4].
Receiver Operating Curve (ROC) with Area Under Curve (AUC) noted for different variables.
Cut-points, AUC, specificity and sensitivity noted for potential predictors.
| Predictor | Cut point | Survival | Death | AUC | Specificity | Sensitivity | PPV | NPV | Accuracy |
|---|
| Age | 50 | 42.75±15.15 | 59.117±12.95 | 78.87 | 66.63 | 80.29 | 15.34 | 97.82 | 67.59 |
| Hb | 13.6 | 13.12±4.28 | 11.16±2.63 | 70.08 | 87.8 | 42.74 | 42.74 | 87.81 | 45.79 |
| TLC | 9800 | 7872.18±3103.05 | 14078.54±33879.38 | 67.01 | 78.76 | 50 | 50.00 | 78.76 | 76.82 |
| Neutrophil | 78 | 64.26±30.03 | 80.35±11.75 | 83.52 | 84.87 | 67.07 | 67.07 | 84.78 | 83.66 |
| Lymphocytes | 18 | 27.18±11.47 | 13.45±9.02 | 83.37 | 76.83 | 79.27 | 97.92 | 21.21 | 79.11 |
| NLR | 4.2 | 3.43±4.16 | 9.59±7.53 | 83.46 | 79.1 | 77.78 | 77.99 | 98.02 | 79.01 |
| LDH | 318 | 281.46±142.42 | 548.38±278.47 | 85.91 | 73.97 | 83.12 | 19.05 | 98.35 | 74.6 |
| Ferritin | 352 | 285.71±391.99 | 1225.60±2502.91 | 80.08 | 76.32 | 74.6 | 16.55 | 97.95 | 76.22 |
AUC: Area under curve; PPV: Positive predictive value; NPV: Negative predictive value
Based on the number of days required for viral clearance, the subjects were classified as: group 1: ≤14 days, group 2: 15-28 days, and group 3: >28 days. Out of 576 patients, who had viral clearance information, 449 (77.95%), 121 (21.0%) and 6 (1.05%) patients were categorised into group 1, 2 and 3, respectively. Respectively, with corresponding mean viral clearance time of 12.09±4.86, 18.12±5.06, and 10.56±5.72 days. The overall mean viral clearance time for 576 patients was found to be 8.98±3.54 days. Moreover, the distribution of patients across different age group was found to be statistically significant (p-value <0.001). Significant difference was noted between three groups with respect to the co-morbidity status (p-value <0.001). The corresponding number of subjects who succumbed to death in group 1, 2 and 3 were 42 (9.35%), 0 (0%) and 1 (17.63%) respectively (p-value=0.0187) [Table/Fig-5].
Comparison of the different variables across the three groups.
| Variable | Group 1 (n=449) | Group 2 (n=121) | Group 3 (n=6) | p-value |
|---|
| Age (years) | 37.57±13.65 | 37.12±13.73 | 49.50±23.56 | <0.001 |
| Age group (years), n (%) |
| <30 | 160 (35.63) | 42 (34.71) | 0 (0) | <0.001 |
| 30-39 | 118 (26.28) | 32 (26.45) | 3 (50.00) |
| 40-49 | 78 (17.37) | 22 (18.18) | 1 (16.67) |
| 50-59 | 53 (11.80) | 14 (11.57) | 0 (0) |
| 60-69 | 33 (7.35) | 10 (8.26) | 1 (16.67) |
| ≥70 | 7 (1.56) | 1 (0.83) | 1 (16.67) |
| Gender n (%) |
| Male | 279 (62.14) | 87 (71.90) | 5 (83.33) | 0.0886 |
| Female | 170 (37.86) | 34 (28.10) | 1 (16.67) |
| Smokers, n (%) | 9 (2.00) | 5 (4.13) | 0 (0) | 0.0040 |
| Laboratory parameters |
| Haemoglobin | 13.26±2.33 | 13.17±2.15 | 13.13±1.15 | 0.9223 |
| Total leucocyte count | 8126±2740.56 | 7516±2621.08 | 5717±2316.39 | 0.0114 |
| Neutrophil | 61.52±11.29 | 59.85±12.91 | 58.00±7.62 | 0.3007 |
| Lymphocytes | 28.75±10.08 | 29.37±10.90 | 30.83±6.68 | 0.7539 |
| Neutrophils lymphocytes ratio | 2.64±1.80 | 2.73±2.50 | 2.02±0.83 | 0.6603 |
| LDH | 245.80±105.33 | 243.5±96.17 | 281.30±39.83 | 0.6802 |
| D-dimer | 0.75±0.63 | 1.65±8.89 | 0.73±0.29 | 0.1015 |
| C-reactive protein | 13.28±35.16 | 16.13±44.25 | 32.07±45.04 | 0.3753 |
| Ferritin | 212.60±301.19 | 222.35±316.87 | 312.8±206.67 | 0.6987 |
| Co-morbidities |
| None | 310 (69.04) | 74 (61.16) | 3 (50.00) | <0.001 |
| Diabetes only | 25 (5.57) | 6 (4.96) | 2 (33.33) |
| Hypertension only | 21 (4.68) | 4 (3.30) | 0 (0) |
| Diabetes or hypertension with other complications | 38 (8.46) | 16 (13.22) | 0 (0) |
| Chronic kidney disease | 0 (0) | 0 (0) | 0 (0) |
| Other | 55 (12.25) | 21 (17.35) | 1 (16.67) |
| Oxygen requirement | 24 (5.35) | 15 (12.40) | 3 (50.00) | <0.001 |
| ICU requirement | 25 (5.57) | 17 (14.05) | 3 (50.00) | <0.001 |
| Asymptomatic | 316 (70.38) | 81 (66.94) | 3 (50.00) | 0.4469 |
| Symptoms n (%) |
| Fever | 77 (17.15) | 24 (19.83) | 2 (33.33) | 0.4975 |
| Dyspnea | 37 (8.24) | 12 (9.92) | 3 (50.00) | <0.001 |
| Cough | 69 (15.37) | 22 (18.18) | 3 (50.00) | <0.001 |
| Sore throat | 3 (0.67) | 2 (1.67) | 0 (0.00) | 0.5692 |
| Myalgia | 15 (3.34) | 7 (5.79) | 0 (0.00) | 0.4084 |
| Head ache | 3 (0.67) | 2 (1.65) | 0 (0.00) | 0.5692 |
| Others | 6 (1.34) | 3 (2.48) | 0 (0.00) | 0.6356 |
| Discharged | 407 (90.65) | 121 (100) | 5 (83.33) | 0.0016 |
| Death | 42 | 0 | 1 | 0.0187 |
Group 1=≤14 days, Group 2=14-28 days and Group 3=>28 days; statistically significant if p<0.05; different superscript across the row differ significantly (p<0.05 for t-test)
Discussion
The present study has demonstrated that the chances of survival are comparatively lower for patients >50 years of age. There is substantial literature evidence to validate the association between age-related COVID-19 severity and mortality. A meta-analysis and rapid review by Starke K et al., have also reiterated the positive associated between increased age-related risk of COVID-19 disease severity, admission to ICU, and mortality. The increased risk per age year noted for disease severity was 2.7% [10]. Similarly, a meta-analysis involving 611,583 subjects have reported that the mortality was <1.1% in subjects aged <50 years and the largest increase was observed in patients between the age group of 60-69 years, as opposed to 50-59 years [11].
Current study has noted fever, dyspnoea and cough as the major symptoms prevalent among patients who succumbed to death (late presentation would have caused worsening of underlying condition and subsequent ARDS or pulmonary embolism) when compared to those who survived (p-value <0.001). Zhang B et al., have also evaluated the clinical characteristics of 82 deaths cases, laboratory-confirmed as SARS-CoV-2 infection. The researchers have reported fever (78.0%), cough (64.6%), and shortness of breath (63.4%) as the prominent symptoms reported in the succumbed victims [12]. The study Gupta N et al., conducted in a tertiary care center in India, has also noted fever and cough (42.9%) as the most prominent symptoms, followed by headache, sore throat, and breathlessness [5].
The statistically significant variables noted between the survived and mortality groups were age, age groups, gender, haemoglobin, TLC, neutrophil, lymphocytes, NLR, LDH, ferritin, all the co-morbidity variables and the asymptomatic status of the subjects. In concurrence with these findings, a study conducted by Saluja M et al., in government medical college, Kota, Rajasthan has also observed increased male preponderance with majority being asymptomatic. Hypertension was the most common associated comorbidity reported followed by diabetes, and thrombocytopenia, lymphocytosis and raised LDH were the common clinical features observed in the selected subjects. The study has noted increase occurrence of severe illness and complications in patients aged >60 (p-value <0.05) [13].
Hb, TLC, neutrophils, lymphocytes, NLR, LDH and ferritin were identified as significant predictors of disease outcome. Among these variables, the highest specificity (73.97%) and sensitivity (83.12%) were noted for TLC and the corresponding values were found to be least for LDH (78.76% and 50%). A study by Singh P et al., have assessed the potential of routine haematological parameters and infectious biomarkers in evaluating the disease severity in 100 adult COVID-19 positive patients. The researchers have suggested that TLC, absolute neutrophil count and NLR may assist in triaging patients requiring ICU care and deciding on the interventions [14].
A review focusing on developing countries including India has reported that the presence of co-morbidities is linked to poor outcomes in COVID-19 subjects. The study has also found that majority of the COVID-19 subjects were asymptomatic with incidence ranging between 26-76% [15]. The present study has also noted more than half of the subjects belonging to the survived group being asymptomatic (58.24%).
Zhang B et al., studied the clinical characteristics of 82 cases of death due to COVID-19 and most of the findings are in line with the present results. The researchers noted increased incidence of mortality in male subjects (66%) and more than half of the subjects who died were >60 years of age. The most common comorbidity noted in patients who died were hypertension (56.1%), followed by heart disease (20.7%), diabetes (18.3%), cerebrovascular disease (12.2%), and cancer (7.3%). Lymphopenia, neutrophilia, and thrombocytopenia were the common clinical finding observed on admission. In addition, elevated NLR of >5, systemic immune-inflammation index of >500, CRP, LDH, and D-dimer were also observed in most of the patients. Respiratory failure was identified as the main cause of COVID-19 and high level of IL-6 (>10 pg/mL) was indicative of cytokine release syndrome-mediated damage to other vital organs [12].
Almost all the subjects in the current mortality group required oxygen and other ICU facilities when compared to the survival group (p-value <0.001). A retrospective, observational case series by Turcotte JJ et al., has reported that the average length of hospital stay for COVID patients was around 12 days and the morality rate noted among 31% of the subjects who required ICU care was 25%. The study has identified presence of insulin-dependent diabetes or CKD, increased sputum production and requirement of higher supplemental oxygen as the risk factors for severe illness [16].
Another paramount finding of the present study is the identification of 10.56±5.72 days as the mean time for final viral clearance in subjects who followed the second policy. The corresponding numbers noted in subjects who underwent first and third discharge policies were 18.12±5.06 days and 12.09±4.86 days, respectively. Carmo A et al., evaluated the clearance and persistence of SARS-CoV-2 RNA in subjects who received two negative RT-PCR results and those who kept testing positive. The study has noted persistence of viral RNA for more than two weeks, which may not be linked to disease severity, but with a weaker immune response [17].
The present study holds significant relevance, as there is very limited literature evidence from the subcontinent correlating demographic data of COVID-19 patients with clinical profile and disease outcomes. Moreover, it sheds light on several significant findings, which would assist clinicians in screening, treatment decision and estimating the disease prognosis.
Limitation(s)
Consideration of data only from a single center is one of the potential limitations of the study. In addition, the study has not evaluated the outcomes from treatment interventions, as no specific standard protocol was available at that point of pandemic for managing COVID-19 patients.
Conclusion(s)
The present study has underscored the clinical utility of Hb, TLC, neutrophils, lymphocytes, NLR, LDH and ferritin as significant predictors of COVID-19 outcome. Maximum of around 8.98±3.54 days has been concluded as mean days of viral clearance required in most of the COVID-19 positive patients.
*Statistically significant if p<0.05 (t-test for continues data and chi-square test for categorical data)
For symptoms its only positive symptoms are mentioned. Its mentioned for each individual symptoms. Not overall. So total does not match
TLC: Total leucocyte count; LDH: Lactate dehydrogenase; CKD: Chronic kidney disease; ICU: Intensive care unit
TLC: Total leucocyte count; LDH: Lactate dehydrogenase
AUC: Area under curve; PPV: Positive predictive value; NPV: Negative predictive value
Group 1=≤14 days, Group 2=14-28 days and Group 3=>28 days; statistically significant if p<0.05; different superscript across the row differ significantly (p<0.05 for t-test)