Epilepsy is defined as recurrent (two or more) epileptic seizures, without any immediate identified cause [1]. An epileptic seizure occurs as a result of excessive and abnormal neuronal activity originating in the gray matter of the cerebral cortex [2]. According to the World Health Organisation (WHO), of the 50 million people with epilepsy worldwide, 80% reside in developing countries [3].
The routine investigations of epilepsy include Electroencephalography (EEG) and neuroimaging. Despite the low sensitivity of EEG, an abnormal EEG helps to determine seizure type and epilepsy syndrome, and thereby choice of antiepileptic medication and prediction of prognosis [4]. Due to involved radiation exposure and poor sensitivity of Computed Tomography (CT) in demonstrating epileptogenic focus, MRI has largely replaced CT scan for epilepsy workup. However, CT retains a role in detecting calcification and in acute situations like head trauma, status epilepticus, and acute ischaemic insult in an emergency setting.
The introduction of MRI has revolutionised epilepsy work-up and is now-a-days considered the modality of choice for detecting any form of structural lesions. MRI is considered the imaging modality of choice because of superior anatomic resolution in the characterisation of pathological processes, its excellent ability to differentiate gray-white matter, and the status of myelination at no radiation risk. The sensitivity of MRI in identifying epileptogenic foci in patients with medically refractory patients has been reported to be more than 80% [5]. The basic role of radiological imaging in epilepsy is to define any structural anomalies or pathologies and to aid in the patient treatment protocol [6].
The purpose of this study was to assess the diagnostic accuracy of MRI in the detection and characterisation of causes of paediatric epilepsy and correlating the MRI findings with the EEG and the clinical features. Authors also discuss MRI imaging appearance of various causes of epilepsy in the paediatric population.
Materials and Methods
A cross-sectional observational study was conducted on 100 children with epilepsy in the age group of 1 month to 18 years who were referred for MRI scanning to the Department of Radiodiagnosis at Goa Medical College, Bambolim, Goa, India. The study was commenced following Institutional Ethical Clearance (approval letter dated Nov 18, 2017). This study was conducted using data collected from December 2017 to December 2019 for a period of two years. The informed consent was obtained from the patient’s guardians/parents before MRI scanning. All referred seizures patients (n=116) within the study duration fulfilling the inclusion criteria were included in the study, of which 16 patients didn’t have EEG records, hence sample size of 100 was chosen.
Inclusion criteria: All epilepsy patients in the age group of 1 month to 18 years, referred for MRI and presented to the Department of Radiodiagnosis in our institute during the study time period were included in the study.
Exclusion criteria: Patients beyond 18 years, or those with any known contraindication to MRI. e.g., cochlear implant, patients with previously diagnosed non-central nervous system disorder as a potential cause of epilepsy or Drug-induced seizures/hypoglycaemic attacks, those with a head injury and acute ischaemic insult were excluded from the study.
Patient’s characteristics: Epilepsy was defined as two or more episodes of unprovoked seizures 24 hours apart and was further categorised according to International League Against Epilepsy (ILAE) guidelines [1]. Clinical data including patient’s age, gender, family history, type of seizure, age at onset, and finding of neurological examination, were noted. Surface electroencephalogram data was also recorded.
MRI Imaging Technique
All MRI cases were performed on a 1.5 Tesla MAGNETOM AVANTO system using standard coils. Patients were scanned in the supine position using dedicated epilepsy protocol. This protocol at our institution include T1 weighted sagittal and axial images, T2 weighted axial image, coronal Fluid-Attenuated Inversion Recovery Sequences (FLAIR), diffusion-weighted imaging, T2 weighted coronal oblique sequence, FLAIR coronal oblique sequence, T1 inversion recovery sequence, and Magnetisation Prepared Rapid Gradient Echo (MPRAGE) Sequence. The parameters used are shown in [Table/Fig-1]. Intravenous gadolinium was used in few cases using T1 weighted fat suppressed sequences in axial, coronal, and sagittal planes. Sedation whenever needed was used under the careful observation of a paediatrician after due consent from the parents or guardian of the child.
MRI sequences and their parameters used at our institution as part of dedicated epilepsy protocol.
| Sequences | TE in ms | TR in ms | Slice thickness in mm | Field of view in mm |
|---|
| T2 Axial | 99 | 4090 | 3-5 mm | 201×230 |
| T2 Oblique coronal | 107 | 3850 | 3.0 mm | 180×180 |
| T1 Axial | 9 | 600 | 3-5 mm | 180×180 |
| T1 Sagittal | 8 | 500 | 3 -5 mm | 200×200 |
| FLAIR coronal | 114 | 8000 | 3.0 mm | 180×200 |
| FLAIR oblique coronal | 107 | 3050 | 3.0 mm | 180×180 |
| MPRAGE | 3.2 | 2000 | 1.0 mm | 208×256 |
| T1 IR coronal | 70 | 7150 | 3-5 mm | 240×180 |
| DWI | 103 | 5000 | 3-5 mm | 200×200 |
TE: Time to echo; TR: Repeatition time; FLAIR: Fluid-attenuated inversion recovery; MPRAGE: Magnetization prepared-rapid gradient echo; T: Time; IR:Inversion recovery; DWI: Diffusion weighted imaging; ms: Millisecond; mm: Millimetre; MRI: Magnetic resonance imaging
Interpretation of images: MR images were reviewed by two senior radiologists for the presence of any possible epileptogenic focus. Findings of the MRI were noted and later correlated with the EEG and clinical/neurological findings.
Statistical Analysis
Data obtained were recorded in Microsoft Excel worksheets and statistical analysis was done using International Business Machines (IBM) Statistical Package for Social Sciences (SPSS) version 23 program running on Windows Operating System. A categorical variable was displayed in terms of percentages and proportions. Continuous variables were expressed as mean and Standard Deviation (SD). Student t-test and Chi-square test were used to test the statistical significance. A p<0.05 was considered significant.
Results
Out of 100 paediatric patients, 53% were boys and 47% were girls. Most patients presented in the age group of 6-10 years (26%) [Table/Fig-2]. The mean age of presentation was 8.79±6.12 years. The occurrence of seizures was more in a male child at a younger age than a female child [Table/Fig-3].
| Age group | Frequency | Percent (%) |
|---|
| Boys (n=53) | Girls (n=47) |
|---|
| <1 year | 6 | 7 | 13 |
| 1-5 years | 13 | 12 | 25 |
| 6-10 years | 10 | 16 | 26 |
| 11-15 years | 10 | 6 | 16 |
| >15 years | 14 | 6 | 20 |
| Total | 53 | 47 | 100 |
Age of onset distribution according to gender.
| Clinical history | Girls (n=47) | Boys (n=53) | Student t-test |
|---|
| Mean | SD | Mean | SD | p-value |
|---|
| Age at onset (years) | 8.38 | 5.79 | 6.06 | 5.28 | 0.049 |
p-value <0.05 considered statistically significant
Among the seizure types, the most common pattern encountered was generalised tonic-clonic seizures accounting for 57%, followed by partial seizures (21%), absence seizures (16%), and myoclonic seizures (6%). Among partial seizures, 15 patients had simple partial seizures and 6 patients had complex partial seizures.
In present study, 72% of children with seizures had no significant or relevant clinical history. Rest of the patients had positive family history of seizures (15%), birth asphyxia (7%), trauma (4%), and cerebral palsy (2%).
The diagnostic yield of MRI was 39%. Almost 61% of patients did not have any epileptogenic cause identified on 1.5 Tesla MRI. The most common pathology encountered was cortical gliosis accounting for 10% of all the MRI positive cases [Table/Fig-4].
Various findings during the MRI investigation are listed.
| MRI findings | Frequency (n) | Percentage (%) |
|---|
| Normal | 61 | 61 |
| Pathological findings | 39 | 39 |
| Gliosis | 10 | 10 |
| Malformation of Cortical Development (MCD) | 8 | 8 |
| Hypoxic Ischaemic Encephalopathy (HIE) | 6 | 6 |
| Mesial Temporal Sclerosis (MTS) | 6 | 6 |
| Infection-Tuberculoma | 2 | 2 |
| Tuberous Sclerosis | 2 | 2 |
| Tumour and tumour like conditions | 5 | 5 |
| Total | 100 | 100 |
MRI: Magnetic resonance imaging
Among the 8% patients with Malformation of Cortical Development (MCD), focal cortical dysplasia was seen in 3 patients, polymicrogyria (2), heterotropias (2), and alobar holoprosencephaly (1). Authors found only 2% of patients with infection, both were tuberculomas. Among the tumours, 2 were ganglioglioma, 1 meningioma, 1 tectal glioma, and 1 patient had medulloblastoma.
Total 33% of patients with generalised seizures, 6% with myoclonic, 6% with partial type, and 16% with absence seizures had normal MRI. About 15 out of 21 patients (71.4%) with partial seizures had positive MRI findings [Table/Fig-5].
Cross table showing the result of comparison MRI findings with seizure type in children using Chi-square test.
| MRI diagnosis | Seizure type in group | Total |
|---|
| Absence | Focal | Generalised tonic clonic seizures | Myoclonic |
|---|
| Normal | 16 | 6 | 33 | 6 | 61 |
| Gliosis | 0 | 6 | 4 | 0 | 10 |
| Malformation of cortical development | 0 | 3 | 5 | 0 | 8 |
| Mesial temporal sclerosis | 0 | 5 | 1 | 0 | 6 |
| Hypoxic ischaemic encephalopathy | 0 | 0 | 6 | 0 | 6 |
| Tuberculoma | 0 | 0 | 2 | 0 | 2 |
| Tuberous sclerosis | 0 | 0 | 2 | 0 | 2 |
| Tumours | 0 | 1 | 4 | 0 | 5 |
| Total | 16 | 21 | 57 | 6 | 100 |
p-value <0.001 considered statistically highly significant
EEG investigation revealed 48% normal studies and 52% with positive findings (22% with focal and 30% with a generalised type of seizures on testing). [Table/Fig-6] shows the association between the various EEG findings and their respective MRI findings.
Association between the MRI and Electroencephalography (EEG) using Chi-square test; p=0.03 (p<0.05 is considered statistically significant).
| MRI | Electroencephalogram (EEG) | Total |
|---|
| Normal | Abnormal |
|---|
| Normal | 46 | 15 | 61 |
| Abnormal | 2 | 37 | 39 |
| Total | 48 | 52 | 100 |
[Table/Fig-7] shows the various clinical and neurological findings whether normal or abnormal against their respective MRI findings. On neurological examination, 82% were found to be normal. Among these on MRI investigation, 54 patients (65.9%) turned out to be normal and 28 patients (34.1%) had MRI demonstrable epileptogenic foci. The remaining 18% of patients who had positive neurological/clinical findings, 11 patients (61.1%) were MRI positive and 7 patients (38.9%) had normal MRI. Positive neurological findings were 5%-hypertonia, 5%-mental retardation, 4%-dysmorphic features, 2%-global developmental delay, 1%-failure to thrive, and 1% with hemiparesis.
Association between the MRI and Clinical/neurological findings using Chi-square test; p=0.001 (p<0.05 is considered statistically significant).
| MRI | Positive Clinical/Neurological findings | Total |
|---|
| Absent | Present |
|---|
| Normal | 54 | 7 | 61 |
| Abnormal | 28 | 11 | 39 |
| Total | 82 | 18 | 100 |
Discussion
The mean age of the children in the present study was found to be 8.79±6.12 years with maximum numbers of patients in the age group of 6-10 years which is in concordance with the study done by Gulati P et al., [7]. Eriksson KJ and Koivikko MJ, showed that the incidence of generalised seizures is higher in the age group of 0-5 years and that of partial seizures is higher in the age group of 6-15 years [8]. The present study did not reveal such distribution with generalised and partial seizures being distributed equally across all age groups. Approximately, 15% had a family history of seizures in the siblings and cousins. A study done by Narkhede N et al., showed that positive family history represents an adverse prognostic factor [9].
In the present study, 57% of the patients presented with generalised clonic tonic seizures, a finding comparable with studies documented by Singhvi JP et al., [10] and Bronnen RA [10,11]. The diagnostic yield of MRI in this study was 39%. This is consistent with the study done by Eriksson KJ and Koivikko MJ [8]. Studies by Riela AV et al., Jabbari B et al., and Heinz ER et al., revealed higher positivity rates of 45%, 43%, and 53%, respectively in their studies [12-14]. In present study, 24 out of 57 (42.1%) cases with generalised epilepsy showed positive MR results while 15 out 21 (71.4%) patients presenting with partial (focal) seizures showed positive MR results. This is similar to the frequency quoted by Berg AT et al., who also concluded that most patients with positive neuroimaging findings had partial and focal epilepsy [15].
Among the various causes identified on MR, Brain injury (gliosis) was the most commonly identified brain pathology (10%), followed by MCD (8%), HIE (6%), and MTS (6%). Other causes included were brain tumours, phakomatosis, and infections.
Brain injury and its sequelae: Gliosis is the outcome of different brain insults leading to epilepsy. The categories under this umbrella are inflammatory, vascular, and post-traumatic causes. MR imaging shows gliotic areas being T2/FLAIR hyperintense and hypointense on T1 weighted images. There is associated volume loss with thinned out cortex and dilated sulci [Table/Fig-8]. The frontal and temporal lobes are the most common sites of injury particularly the orbital surfaces of frontal lobes, ventral surface of temporal lobes, and frontal and temporal poles [16].
Cortical gliosis. Axial T2 weighted (a) and Coronal FLAIR (b) Images show presence of gliotic area in the left basi-temporal region (thick arrows). It appears hyperintense on T2 weighted sequence. There is associated volume loss with thinned out cortex and dilated sulci. Coronal FLAIR image (b) shows cavities (thin arrow) within the gliotic region. These cavities follow CSF signal intensity s/o encephalomalacia. The surrounding gliosis is evident as FLAIR hyperintense area. (FLAIR-Fluid attenuated inversion recovery sequence).
Porencephaly is one of the most common pre-natal brain lesions due to necrosis appearing on imaging as smooth-walled cavities that are isointense to Cerebrospinal Fluid (CSF) on all pulse sequences surrounded by gliotic white matter. It usually communicates with the ventricular margins, making it essential to differentiate it from schizencephaly [17].
Encephalomalacia [Table/Fig-8b] on imaging appears as shaggy walled cavities separated by thin septations. These cavities follow CSF signal intensities on all pulse sequences. The surrounding gliosis will be evident as T2 and FLAIR hyperintense and T1 hypointense signal [18].
Ulegyria is a manifestation of peri-natal vascular injury to the brain. It is characterised by a shrunken cortex having a peculiar pattern in which the deep portions of the gyri are more affected than the superficial portion creating mushroom-shaped gyri associated with underlying tissue loss and gliosis [19].
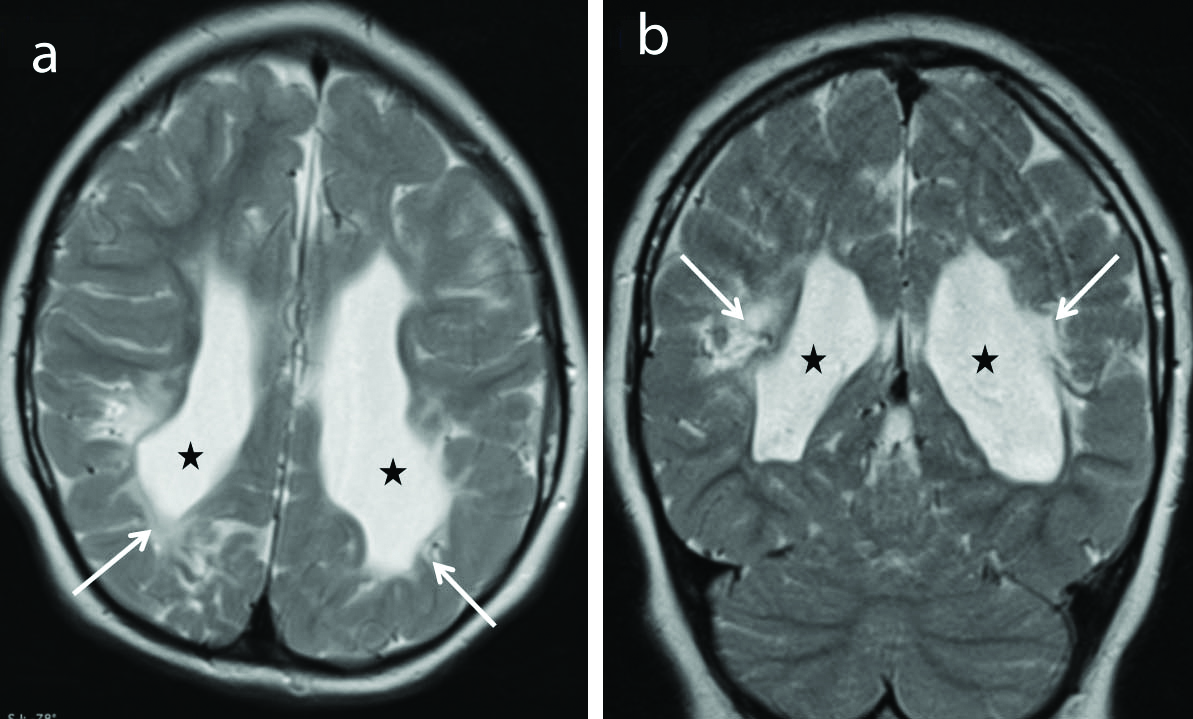
Hypoxic-ischaemic encephalopathy [Table/Fig-9] was noted in 6 out of 39 MRI positive patients. All 6 cases had generalised epilepsy, cerebral palsy with unprovoked epileptic seizures. Pre-term hypoxic injury with hypotension results in periventricular white matter injury with gliosis and cystic encephalomalacic changes. Term hypoxic injury results in changes in the cortex and subcortical regions as in adults [20].
Periventricular leukomalacia. Axial (a) and coronal (b) T2 weighted images show gliosis and loss of white matter in the peri-trigonal regions (arrows) and adjacent to the bodies of the lateral ventricles with ex-vacuo dilatations of the occipital horns (stars) bilaterally with irregular ventricular margins consistent with sequelae to hypoxic ischaemic encephalopathy.
Malformation of Cortical Development (MCD)
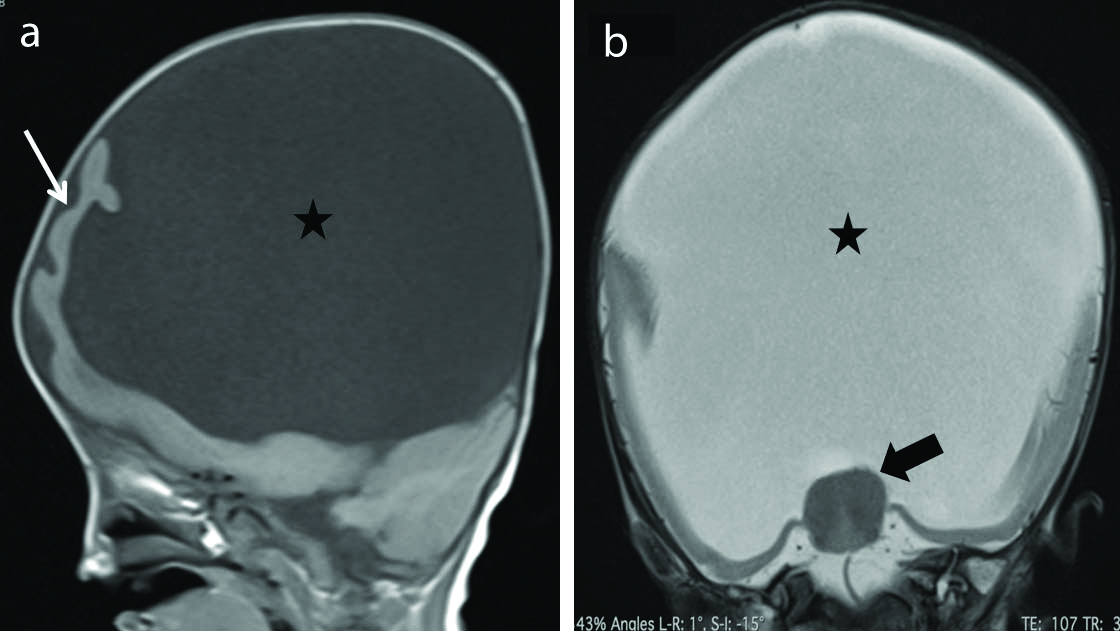
Eight cases of cortical malformations were identified in the present study among which one case of alobar holoprosencephaly was identified. This case [Table/Fig-10] showed classic findings of alobar holoprosencephaly with the incomplete division of cerebral hemispheres resulting in cerebral cortex confined predominantly to the anterior basicranium (pancake variety) along with the absence of corpus callosum, interhemispheric fissure, falx cerebri, and third/lateral ventricles. Midline fusion of the thalami with a single large ventricle was observed.
Alobar holoprosencephaly. Sagittal T1 weighted (a) and coronal T2 weighted (b) images show incomplete division of cerebral hemispheres with the cerebral cortex (thin arrow) confined predominantly to the anterior basicranium (pancake variety) with a large monoventricle (Star) in the midline. There is absence of corpus callosum, interhemispheric fissure and falx cerebri. There is fusion of the thalami noted (thick arrow). Posterior fossa and cerebellum appear normal. These features are consistent with alobar holoprosencephaly.
Barkovich AJ et al., suggested division of this malformation according to errors in major stages of cortical development. The major ones are discussed below [21]:
Microcephaly means small head and is defined as a head circumference more than three standard deviations below the mean for age and sex. It can be primary (genetic) or secondary (non-genetic). MRI demonstrates slanted frontal bones and a marked decrease in cranial-to-facial proportion. The brain appears small with simplified gyral patterns. T2* (GRE/SWI) sequence might delineate secondary insult with haemorrhagic residua. Other features such as calcification, cysts, gliosis, and encephalomalacia differentiate primary from secondary [22].
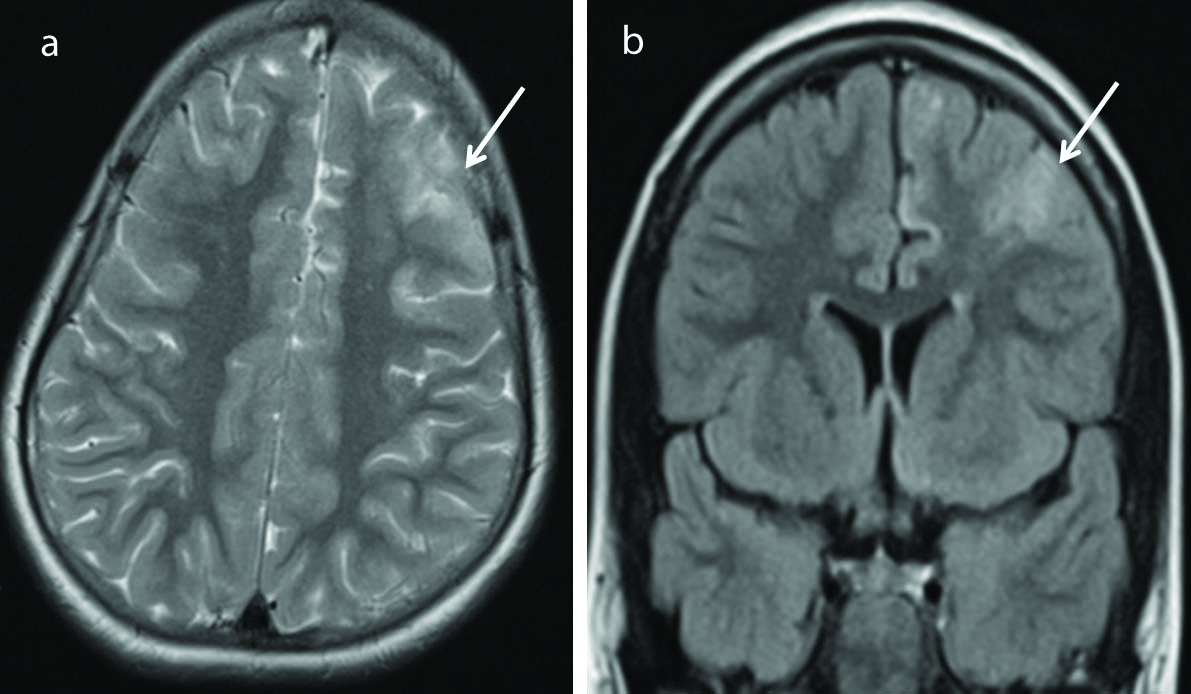
Focal cortical dysplasia is a subtype of MCD reflecting focal neuronal migrations abnormalities. It is a common cause of medically refractory epilepsy in both children and adults [23]. MRI features of focal cortical dysplasia [Table/Fig-11] include cortical thickening, abnormal gyri and sulci, blurring of white-gray matter junction, hyperintense signal in the white matter and gray matter on T2/FLAIR sequences. Transmantle sign refers to T2/FLAIR white matter hyperintensity extending from cortex upto the ventricle [24].
Focal cortical dysplasia. Axial T2 weighted (a) and coronal FLAIR (b) images show T2/FLAIR hyperintense lesion (arrows) in the left frontal lobe with thickened overlying cortex. No enhancement was seen following contrast injection. (FLAIR-Fluid Attenuated Inversion Recovery Sequence).
Polymicrogyria is characterised by abnormalities both in-migration of neurons to the cortex and abnormal cortical organisation. This pathology has a predilection for the perisylvian region, hence called perisylvian syndrome and bilateral involvement is common. Polymicrogyria represents areas of the brain with several small abnormal gyri separated by shallow sulci producing thickened cortex. The cortex has similar signal intensity to normal gray matter. It is often associated with schizencephaly; the CSF filled cleft is lined by abnormal gray matter. The gray-white junction appears indistinct in these patients [25].
Schizencephaly means split-brain and is characterised by a cleft that connects the cortical surface/pial surface with the ventricular ependyma. Two types noted–close lip and open lip types. MRI shows the presence of a gray matter lined CSF filled defect extending from the brain surface to the wall of the ventricle. The cleft is lined by dysplastic gray matter differentiating it from porencephalic cyst wherein the cyst/cleft is lined by gliotic white matter [26].
Heterotropias reflects abnormality of neuronal migration with normal-appearing gray matter visible at the abnormal location, anywhere between ventricles and the pia mater. They are categorised into two main types based on location as periventricular heterotropia and subcortical heterotropias. Based on the appearance, they can be either nodular, band/laminar, or mass heterotropias. MRI shows this ectopic gray matter along the ventricular wall (periventricular) or in the subcortical location. They have similar signal intensity to the gray matter on all pulse sequences. This basic feature helps these heterotropias to be differentiated from tumours (mainly gangliocytoma) or subependymal nodules of tuberous sclerosis [27].
Lissencephaly means “smooth brain”. Lissencephaly spectrum includes agyria, pachygyria, and subcortical band/laminar heterotropias representing severe to milder forms in that order. On imaging Type I lissencephaly shows a markedly thickened cortex with broad, flat gyri, diminished white matter, and shallow vertically oriented Sylvian fissures that produce a figure of eight appearance on axial images. In type II lissencephaly cortex has a micro-lobulated surface with characteristic finger-like projection from the inner margin of the thickened cortex in the underlying white matter [28,29].
Hemimegalencephaly (HMEG) also called unilateral megalencephaly characterised by the abnormal enlargement of part or all of the cerebral hemisphere. On imaging, this will be seen as one hemisphere appearing larger than other along with enlarged lateral ventricle on the involved side. It is usually associated with abnormal signal in the white matter appearing hyperintense on T2 and FLAIR sequence [26].
Mesial Temporal (Hippocampal) Sclerosis (MTS)
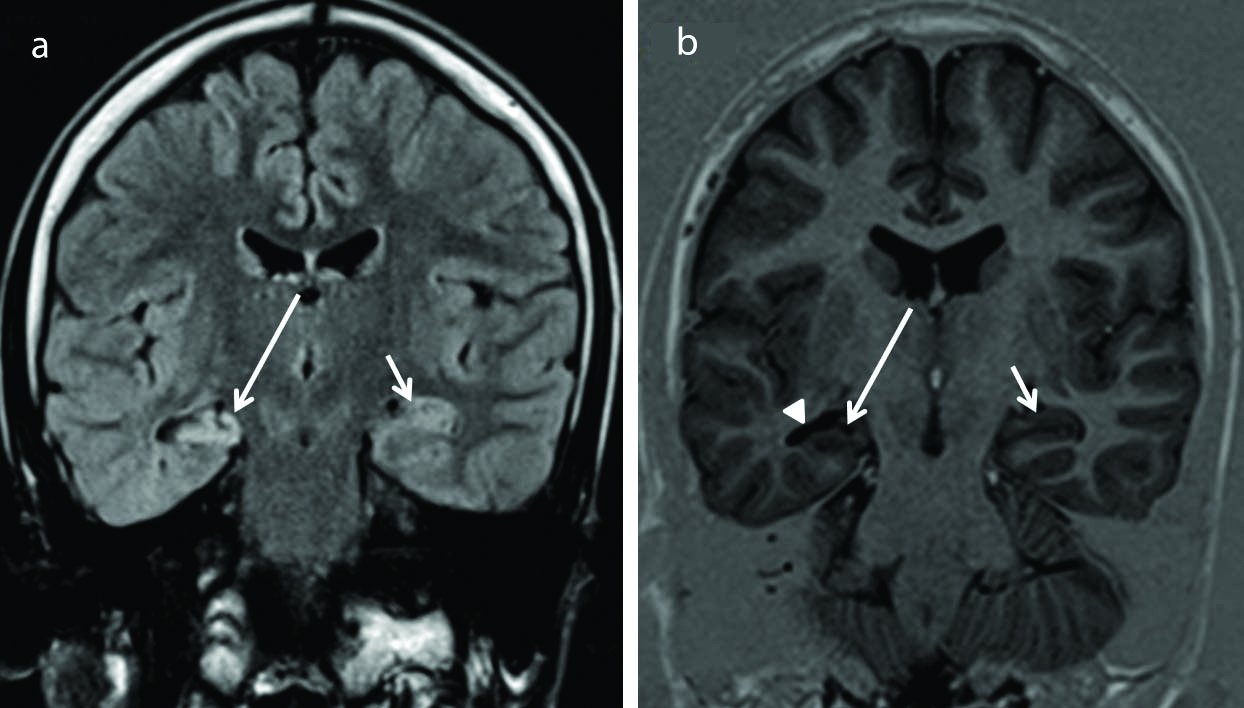
Among all causes of Temporal Lobe Epilepsy (TLE), MTS is considered the most common cause identified on imaging. Six cases of mesial temporal lobe sclerosis were identified constituting 15.38% of the positive cases. This correlated with the study done by Ponnatapura J et al., [30] and Liu RS et al., [31]. On imaging [Table/Fig-12] direct features of MTS include hippocampal atrophy, loss of surface indentations, an abnormal signal on T2 and FLAIR, enlargement of the temporal horn, and loss of stratum radiata (thin layer of white matter overlying the gray matter) [32].
Mesial Temporal Sclerosis (MTS). Coronal flair (a) image shows hyperintensity in the right hippocampus (long arrow) compared to the normal appearing left hippocampus (short arrow). Coronal inversion recovery sequence (b) shows atrophy of the right hippocampus (long arrow) compared to the normal volume of the contralateral left hippocampus (short arrow). The temporal horn on the right side is dilated (arrow head). This findings are direct evidences of right mesial temporal sclerosis. Careful observation also shows that white matter of the right temporal lobe appears less compared to the contralateral side representing secondary signs of MTS.
CNS Infections
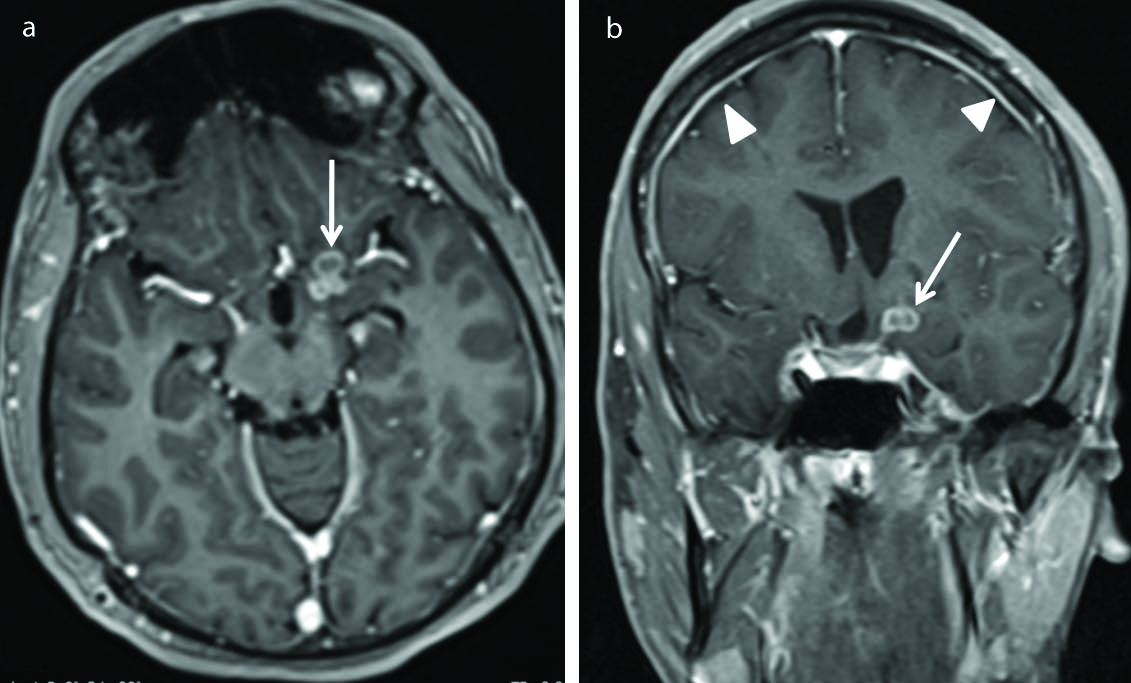
In developing countries, tuberculomas and neurocysticercosis are known to be the most common causes of new onset partial seizures [7,10]. Tuberculomas [Table/Fig-13] contributed two cases among 39 MRI positive patients which are in contrast to the study conducted by Gulati P et al., in which tuberculomas accounted for the maximum number of cases [7]. No case of neurocysticercosis was identified in the present study. On imaging, tuberculomas appear isointense on T1WI and hypointense on T2W sequences. If there is marked necrosis, it appears hyper on T2WI. Nodular and/or ring enhancement is noted on post-contrast images [33]. Neurocysticercosis develops through various phases-vesicular, colloidal vesicular, granular nodular and nodular calcified stage. Corticomedullary junction is the most common site of involvement. An eccentric nodule-scolex is seen within the lesion in the vesicular stage. Peripheral ring enhancement and peri-lesional oedema were noted in the colloidal vesicular and granular nodular phase [33]. The lesions usually spontaneously resolve on anti-epileptic medication alone and may calcify on healing.
Tuberculoma. Postcontrast T1 weighted axial (a) and coronal (b) images show conglomerate ring enhancing lesion (arrow) in left basi-frontal region adjacent to the sylvian fissure. These lesions were T2 hypointense (not shown in the images). There is associated pachymeningeal enhancement (arrow heads in b) s/o pachymeningitis.
Neoplasms associated with epilepsy
Neoplastic lesions contributed a total of five positive cases with ganglioglioma seen in two of the five patients. Other neoplastic aetiologies noted were one case each of cystic meningioma, tectal glioma, and medulloblastoma.
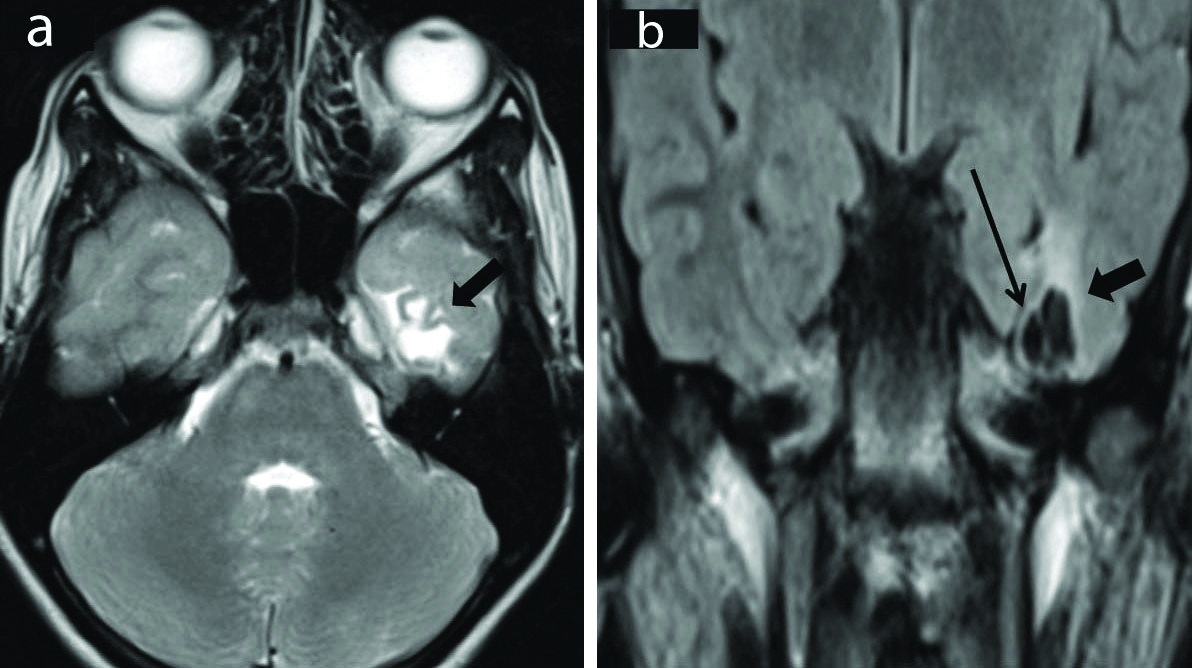
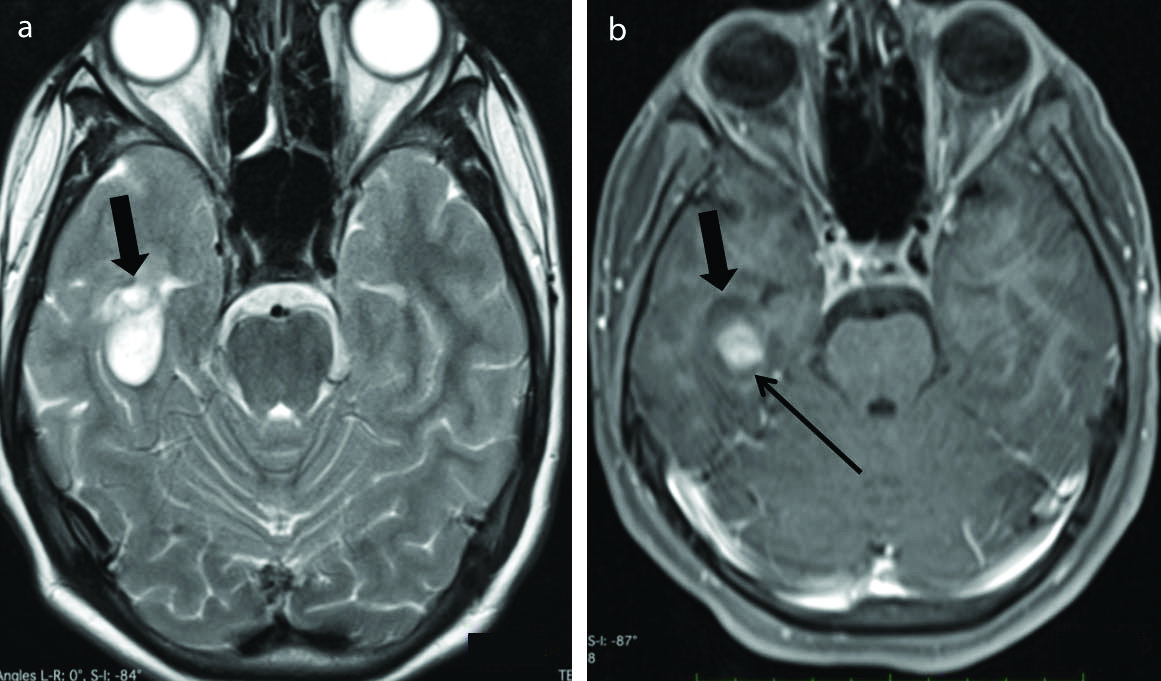
1) Ganglioglioma [Table/Fig-14] is usually well-define T1 hypointense and T2 hyperintense lesions. They show a variable pattern of post-gadolinium enhancement, ranging from absent to intense, and may even show an annular pattern of enhancement [34].
Ganglioglioma. Axial T2 weighted (a) image shows predominantly cystic appearing mass (thick arrow) in the right temporal region. Axial T1 weighted post-contrast (b) image shows the lesion in the right temporal lobe (thick arrow) with nodular enhancement along the medial aspect of the lesion (long thin arrow). No peri-lesional oedema was noted. Later histopathology confirmed it to be ganglioglioma.
2) Oligodendrogliomas usually appear hypointense on T1 weighted and hyperintense on T2 weighted MR images. Occasionally, T1 hyperintense foci may be seen within representing intratumoural haemorrhage or calcification. Enhancement is variable [34].
3) Dysembryoplastic Neuroepithelial Tumours (DNETs) on MRI appear often limited to the cortex, hypointense on T1, and hyperintense on T2/FLAIR sequences. These lesions usually produce a bubbly appearance within the thickened cortex. There is no peritumoural oedema or mass effect and there may be variable contrast enhancement noted [34].
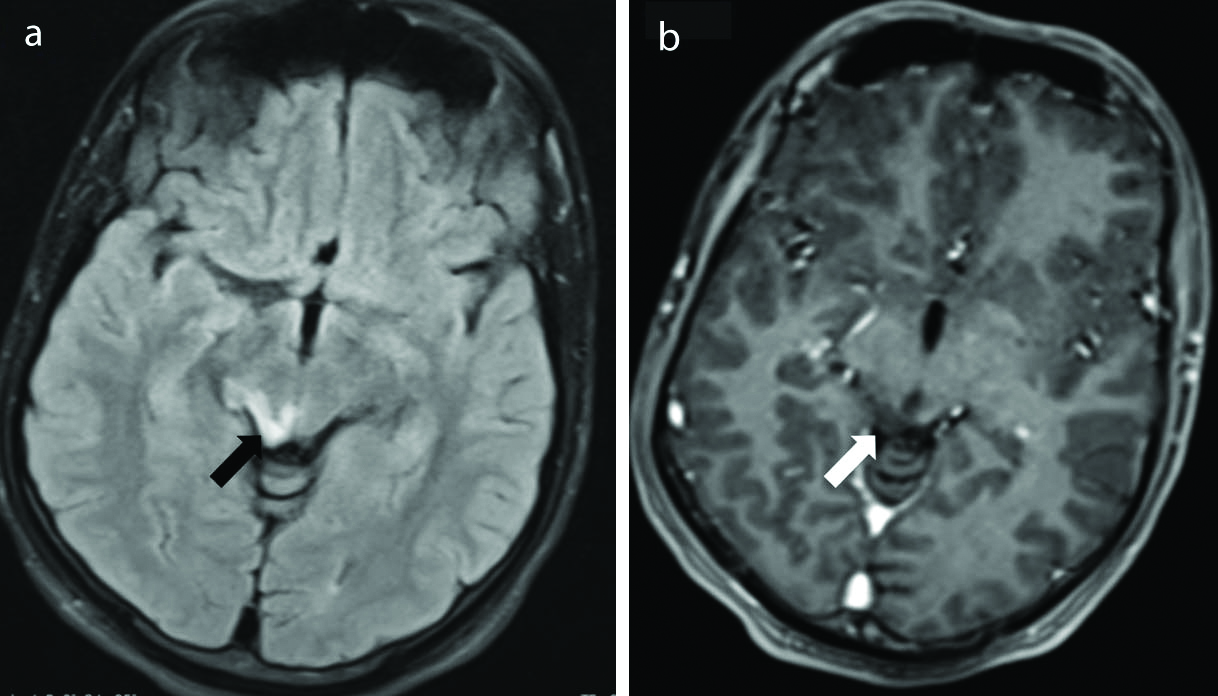
4) Tectal glioma [Table/Fig-15] appears as a solid nodule causing expansion of the tectal plate appearing hyperintense on T2 weighted and iso-hypointense on T1 weighted images, not showing significant enhancement on the post-contrast scan [35].
Tectal glioma. Axial FLAIR (a) and Axial postcontrast T1 weighted (b) images show presence of a small ill defined FLAIR hyperintense lesion in the tectal plate on the right side (black arrow), not showing significant enhancement on postcontrast T1 weighted sequence (white arrows). (FLAIR-Fluid attenuated inversion recovery sequence).
5) Medulloblastoma is usually seen as a midline mass in the posterior fossa arising out of the cerebellar vermis. It showed mixed signal intensity on T2 weighted images, hypointense on T1 weighted images, and show heterogenous enhancement on the post-contrast scan. Medulloblastomas show diffusion restriction, the feature that helps them to be differentiated from other midline posterior fossa tumours especially ependymomas. It can cause mass effect and effacement of the fourth ventricle resulting in obstructive hydrocephalus [36].
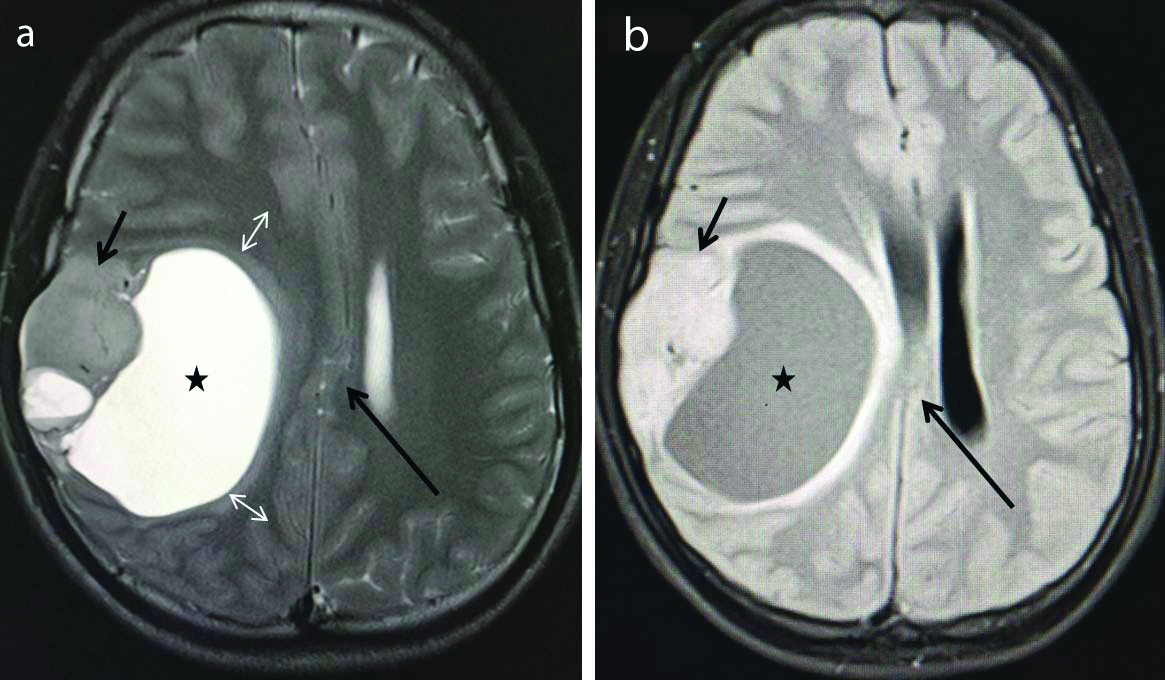
6) An atypical (cystic) meningioma is characterised by a well-defined rounded dural based lesion with a large cystic component along its medial wall causing mass effect on the right lateral ventricle [Table/Fig-16].
Atypical cystic meningioma. Axial T2 weighted (a) and Axial FLAIR (b) images show presence of a well defined extra-axial lesion in the right fronto-parietal region demonstrating solid (short arrows) and cystic (stars) component. The lesion is extra-axial because the cerebral cortex (double head arrows) is pushed medially by the lesion. There is associated subfalcine herniation (Long arrows). Later confirmed histopathologically to be a meningioma. (FLAIR-Fluid attenuated inversion recovery sequence).
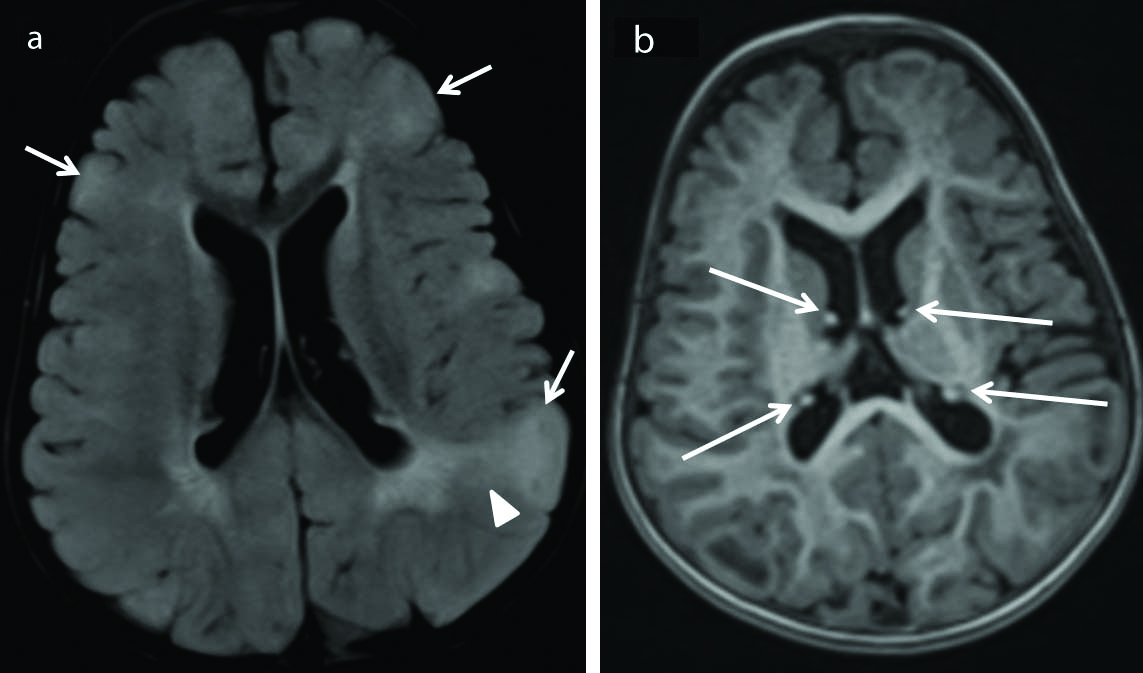
Two cases of tuberous sclerosis [Table/Fig-17] were identified. Both presented with generalised tonic-clonic seizures. It is characterised by a constellation of imaging features such as cortical tubers (triangular-shaped lesions in the Juxta cortical region usually appearing T2 hyperintense and T1 hypointense and showing enhancement on post-contrast scan; However, appearance varies with the age of the child), subependymal nodules (multiple small irregular calcified/non-calcified lesions along the ependymal surface of the ventricles), Subependymal Giant Cell Astrocytoma (SEGA) and irregular white matter radial bands [37].
Tuberous sclerosis. Axial FLAIR (a) image shows presence of cortical tubers (short arrows) along with abnormal white matter (arrow head) appearing hyperintense on FLAIR sequence. These cortical tubers are cortical based lesions producing bumpy appearance of the involved areas of the cortex as shown in (a) by short arrows. Axial MPRAGE sequence (b) shows subependymal nodules (long arrows) jutting into the lateral ventricles. These features are consistent with tuberous sclerosis. (FLAIR-Fluid attenuated inversion recovery sequence).
In the present study, no cases with corpus callosal dysgenesis/vascular malformation or metabolic disorders were noted. In a study conducted by Bronen RA, the incidence of vascular malformations was reported as high as 6% [11]. However, the possible reason for the discrepancy in the present study could be the difference in the incidence of vascular malformations in this study populations as compared to the western population and differences in the sample size and sample constitution.
A study done by Sharma S et al., revealed a significant association between the type of seizure and positive MRI findings [38]. The present study also showed a statistically significant association obtained between the type of seizure and their respective findings on MRI. Patients with partial seizures are likely to have positive MRI findings compared to the other patterns of epilepsy presentations. All patients with absence seizures and myoclonic seizures had normal MRI investigation.
A statistically significant association was documented between MRI and EEG findings in the current study. Almost all patients with normal EEG had normal MRI investigation, hence, authors recommend MRI to be used as further investigation only if EEG is positive to reduce the unnecessary burden on the MRI system especially in developing countries and in the rural areas. This finding is seen in concordance with the study done by Amirsalari S et al., [39], however shows discordance with the study done by Ponnatapura J et al., and Hakami T et al., [30,40].
A statistically significant association was documented between MRI and findings of clinical/neurological examination in the epilepsy patients in the current study. This is seen in concordance with the study done by Amirsalari S et al., [39].
This study revealed that is MRI is a good and safe neuroimaging tool for demonstrating epileptogenic focus and has a good diagnostic yield while evaluating seizure patients. This study also showed a significant association between the EEG findings and the MRI findings, proving EEG a good tool for evaluating seizure patients, however this data needs to be validated in the future using larger sample size.
Limitation(s)
It is a small sample size based study. There is selection bias as only those patients referred to the institutions Radiology Department were enrolled in the study. Follow-up was not considered in present study setting.
Conclusion(s)
In the evaluation of paediatric epilepsy, it is extremely important to arrive at an accurate diagnosis to decide appropriate treatment options. In patients with refractory epilepsy, neuroimaging is crucial for precisely identifying epileptogenic foci that are potentially amenable to surgical resection for a possible cure. The authors conclude that MRI is undoubtedly the best neuroimaging modality for evaluation of paediatric epilepsy and it is the imaging modality of choice to establish the correct diagnosis, plan the management according to diagnosis as well as helps in prognosis.
p-value <0.05 considered statistically significant
MRI: Magnetic resonance imaging
p-value <0.001 considered statistically highly significant