Respiratory infections of bacterial or viral aetiology cannot be differentiated clinically, though the epidemiological features and patient history may give clues to suspect viral infection like influenza by a physician. A viral diagnosis like influenza precludes the use of antibacterial agents, which are empirically started in patients with respiratory illnesses. Most of the serious acute respiratory illnesses of viral aetiology have been attributed to influenza virus [1].
There is a need for aetiological diagnosis of influenza, so as to aid clinical management, selection of vaccine strain, cohorting of cases with similar symptoms, hospital infection control, epidemiological studies and for research purposes. Prompt treatment with antiviral agents can increase the chances of survival in critical patients thus making a timely and accurate diagnosis of influenza crucial.
Though RT-PCR is recommended for diagnosis of influenza infection in patients with ILI, it is expensive, labor intensive, technically demanding and available in reference laboratories only [3]. On the other hand, a rapid diagnosis is cost-effective, fast, does not need any technical expertise, and can help in reducing the use of antibiotics by providing timely diagnosis. Rapid diagnosis during an outbreak may justify the use of antivirals in special high risk people [4].
Few studies were undertaken to test the usefulness of RIDT in comparison to RT-PCR in several countries, but not many in India [5]. Therefore, this study was planned to evaluate the usefulness of rapid antigen detection testing in comparison to RT-PCR for diagnosis of influenza virus infection in clinically suspected patients with ILI in a tertiary care hospital in acute care settings.
Materials and Methods
A prospective, observational, and independent study was done to evaluate a rapid test for influenza diagnosis, considering RT-PCR as the gold standard. Samples from patients suspected with ILI were received from hospitals in and around the area of study, which was a tertiary care teaching hospital in Andhra Pradesh, India from 20th July, 2019 to 20th October, 2019. The study was approved by the Institutional Ethics Committee (IEC No.732) and written informed consents were taken from all the study participants.
Sample size calculation: The sample size was calculated by the formula below, based on prevalence of influenza, from a previous study from the same centre [6].
n=Zα2p (1-p)/d2
Where, ‘n’ is the sample size, ‘Zα’ is the Z statistic for a 95% confidence level (1.96), ‘p’ is the prevalence of influenza (0.43), and ‘d’ is the precision (0.05). Sample size obtained was 380 after substitution of all the variables. Due to financial constraints, the sample size was reduced to only 100. All the samples were processed by both RT-PCR and RIDT.
In this study, authors have evaluated a new diagnostic study in which the proportions like sensitivity and specificity of a new test were compared with the gold standard. This was not a hypothesis driven study to calculate power, but more based on estimating proportions along with confidence intervals. In the sample size calculation formula, precision was used (To specify the precision with which authors wanted to report the proportions with confidence intervals of the new test). By reducing the sample size, the precision of the study was reduced by half (0.05 became 0.10).
Categorisation of ILI
The MoHFW guidelines for case management of influenza A/H1N1 require classification of influenza patients into three categories [7]:
Category A- includes mild cases where no laboratory testing or antiviral treatment is needed.
Category B- includes high-risk patients such as children, pregnant women, persons aged ≥65 years and people with chronic disease. Patients under this category need not be laboratory confirmed. They are given Oseltamivir medication and advised home isolation.
Category C- includes severe cases who need hospitalisation, laboratory testing and oseltamivir medication. The numbers of cases of severe illness and deaths are the most commonly used indicators of severity of influenza outbreak.
Inclusion criteria: Sample from patients of all age groups and genders meeting Category C definition of ILI by MoHFW were included. Properly labelled samples received in Viral Transport Medium (VTM) along with filled form with patient details were included.
Exclusion criteria: Any sample that was positive for different type of influenza by either PCR or RIDT. Samples with incomplete or mismatched patient data were excluded. Samples with inadequate quantity and those grossly contaminated (colour change in VTM) were excluded.
Data Collection
This being a Viral Research and Diagnostics Laboratory (VRDL), the demographic data and clinical presentations of all the patients were filled and submitted in pre-designed forms prescribed by National Institute of Epidemiology (NIE) [8].
Specimen collection: A total of 100 samples were collected from hospital Intensive Care Unit (ICUs) by clinicians. Both throat and nasal swabs (one each) were collected from each case. Both the swabs were placed in the same VTM (HiMedia Labs, Mumbai, India) and transported to the laboratory immediately.
Methodology: All the 100 samples were processed by both the methods. Considering Ct values as semi-quantitative measurement of viral load [9], an attempt was made in this study to correlate RIDT positivity at different viral loads. For this purpose, the Ct values of the positive PCR samples were also collected.
Sample Processing by RT-PCR
RNA extraction: QIAmp® viral RNA Mini Kit from Qiagen, USA, was used for RNA extraction.
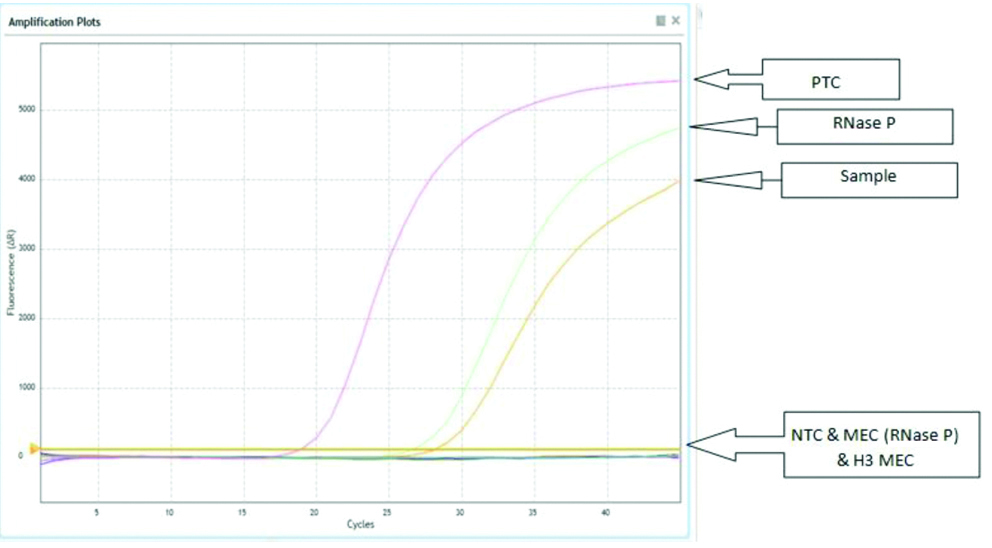
RT-PCR testing of samples: Samples were tested by RT-PCR for influenza type A and B using AriaMx Real-time PCR machine, Agilent Technologies, Germany. Processing for RT-PCR was done using primer, probes recommended by NIV as per their protocol [10] as described by Mudhigeti N et al., in a study published from this center [6]. The primers and probes used for the study is shown in [Table/Fig-1]. A graph showing RT-PCR curve is shown in [Table/Fig-2].
Showing primers and probes of the Real time RT-PCR, as recommended by National Institute of Virology (NIV) [10].
| Primers and probes | Sequence (5’>3’) | Working Conc. |
|---|
| Inf A Forward | GAC CRA TCC TGT CAC CTC TGA C | 40 μM |
| Inf A Reverse | AGG GCA TTY TGG ACA AAK CGT CTA | 40 μM |
| Inf A Probe | FAM- TGC AGT CCT CGC TCA CTG GGC ACG MGBNFQ | 10 μM |
| Pdm H1 Forward | GTG CTA TAA ACA CCA GCC TCC CATT | 40 μM |
| Pdm H1 Reverse | AGA YGG GAC ATT CCT CAA TCC TG | 40 μM |
| Pdm H1 Probe | FAM- ATA CAT CCR ATC ACA ATT GGR AAA TGT CCA AA MGBNFQ | 10 μM |
| AH3 Forward | AAG CAT TCC YAA TGA CAA ACC | 40 μM |
| AH3 Reverse | ATT GCR CCR AAT ATG CCT CTA GT | 40 μM |
| AH3 Probe | VIC- CAG GAT CAC ATA TGG GSC CTG TCC CAG MGBNFQ | 10 μM |
| Inf B Forward | TCC TCA AYT CAC TCT TCG AGC G | 40 μM |
| Inf B Reverse | CGG TGC TCT TGA CCA AAT TGG | 40 μM |
| Inf B Probe | NED/VIC- CCA ATT CGA GCA GCT GAA ACT GCG GTG MGBNFQ | 10 μM |
| RNase P Forward | AGA TTT GGA CCT GCG AGC G | 40 μM |
| RNase P Reverse | GAG CGG CTG TCT CCA CAA GT | 40 μM |
| RNase P Probe1 | FAM- TTC TGA CCT GAA GGC TCT GCG CG | 10 μM |
| B HA BHA-188F | AGA CCA GAG GGA AAC TAT GCC C | 10 μM |
| B HA BHA-270R | TCC GGA TGT AAC AGG TCT GAC TT | 10 μM |
| Type B Victoria | VIC- CAGACCAAAATGCACGGGGAAHATACC MGBNFQ | 5 μM |
| Type B Yamagata | FAM- CAGRCCAATGTGTGTGGGGAYCACACC MGBNFQ | 5 μM |
FAM: 6-Carboxy fluorescein; VIC: Victoria; NED: Neutral evolutionary distance
Showing Influenza A (H1N1) pandemic 09 detected at 28.51 cycles of amplification. RNase-P detected at 26.96 cycle and PTC detected at 19.17 cycles.
PTC: Positive template control; NTC: Negative template control; MEC: Mock extraction control
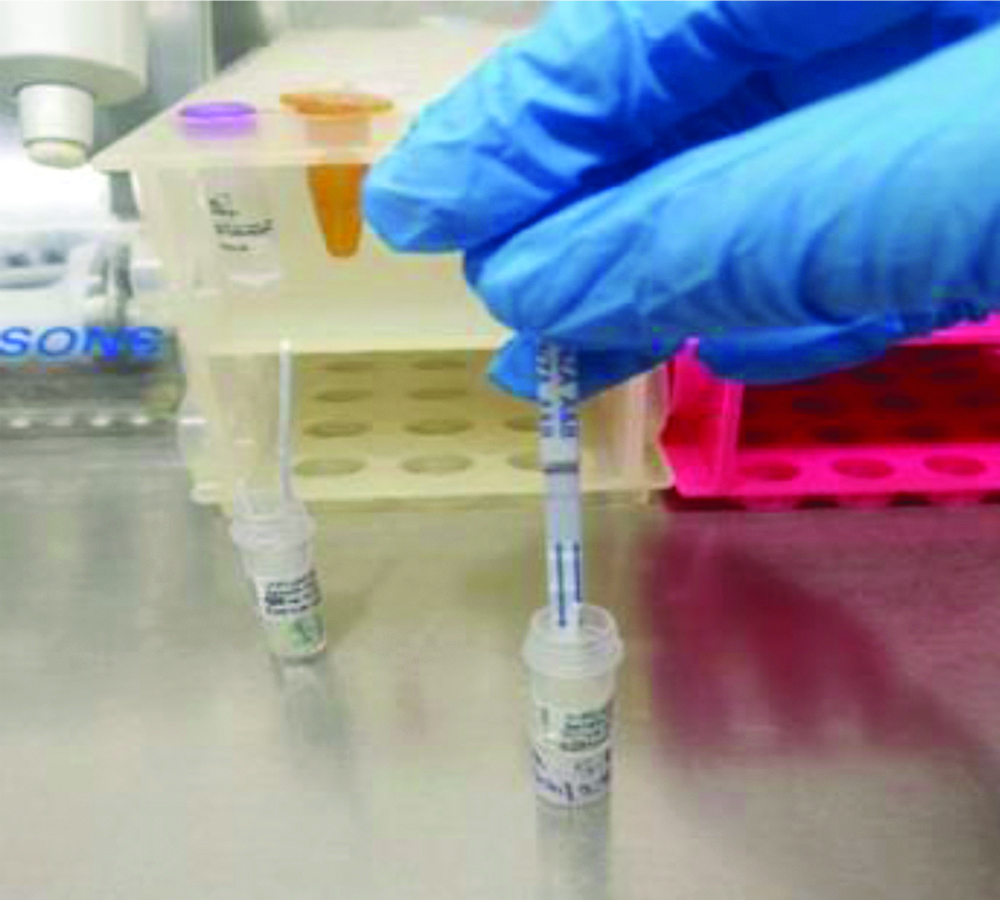
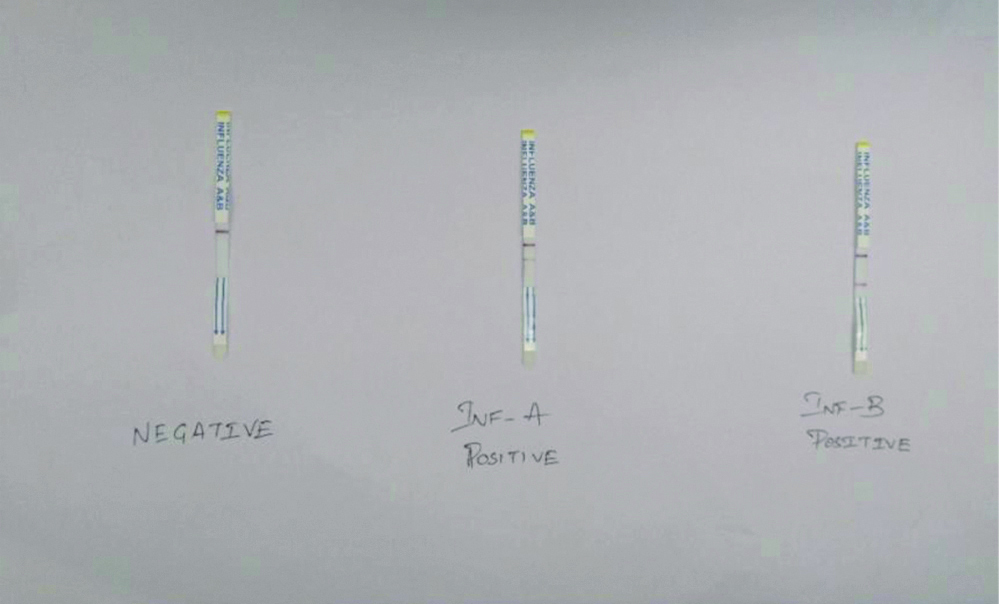
Sample processing by RIDT: Onsite Rapid test (Biogenix, China) was used as per manufactures instructions for rapid detection of influenza. It is a lateral flow chromatographic immunoassay [11]. The test strip consisits of a burgundy coloured conjugate pad containing anti-influenza A and B antibody conjugated with colloidal gold, a nitrocellulose membrane strip containing two test lines (T1 and T2) and a control C line. The T1 line is pre-coated with anti-influenza A antibody, the T2 line is pre-coated with anti-influenza B antibody, and the C-line is pre-coated with a control line antibody. The presence of T1 line along with C line indicates the presence of influenza A virus. The presence of T2 line along with C line indicated the presence of influenza B virus. [Table/Fig-3] shows processing of sample with the onsite rapid test kit. [Table/Fig-4] shows result of RIDT.
Performance of RIDT. The dipstick is inserted into the VTM, in which the nasal/throat swabs were sent to the laboratory.
Results of RIDT: Negative, influenza A positive and influenza B positive (left to right).
A relative sensitivity and specificity of 86.8% and 94.0% for influenza A and of 91.7% and 97.5% for influenza B was quoted by the kit manufacturers under their testing conditions. The kit was manufactured in USA and approved for sale in Europe (CE marked, ISO 13485:2016).
Statistical Analysis
Specimens positive for influenza A or B virus in the RT-PCR were regarded as true positives. The sensitivity, specificity, PPV and NPV of the Biogenix Rapid test for influenza A and B test results compared with those of the RT-PCR assay were calculated using two-by-two contingency figures. Data was recorded on a predesigned proforma and managed using Microsoft Excel 2018 (Microsoft Corp, Redmond, WA). All categorical variables were summarised as percentages. The categorical variables were compared by Pearson’s chi-square test. The Statistical software MedCalc version 9.1 for Windows was used for data analysis. A p-value <0.05 was considered statistically significant.
Results
During the study period, 100 samples were processed by RT-PCR and rapid test for detection of influenza infection. Patients ranging from age group between 18 days to 88 years (mean age 24.9 year). There was equal distribution of samples among the genders. Of the 100 samples, there were 51 females and 49 males. Of the 49 samples from males, 10 (20.4%) samples were positive for influenza virus by RT-PCR of which 6 (60%) were positive by rapid test. Whereas from 51 samples from females, 19 (37.3%) samples were positive by RT-PCR and from these, 5 (26.3%) samples were positive by rapid method. This suggests a slightly higher female positivity for influenza infection [Table/Fig-5].
Shows RT-PCR and RIDT positive samples based on gender.
| Gender | Result | RT-PCR | RIDT |
|---|
| Male (49) | Positive | 10 (20.4%)* | 6 (12.2%)# |
| Negative | 39 | 43 |
| Female (51) | Positive | 19 (37.3%)* | 5 (9.8%)# |
| Negative | 32 | 46 |
*Percentages calculated with total positives as denominator in RT-PCR; #Percentages calculated with RT-PCR as denominator
The clinical presentation of all the 100 patients is shown in [Table/Fig-6]. Among the positive samples, the most common clinical feature was fever (100%) while those least associated with the diagnosis of influenza were abdominal pain (3.5%) and ear ache/discharge (3.4%).
Showing the clinical manifestations of all the samples received in the study period.
| Symptoms | Influenza Negative (71) | Influenza Positive |
|---|
| All (29) | Influenza B Victoria (n=15) | Influenza A H3N2 (n=12) | Influenza A H1N1 (n=2) |
|---|
| Fever | 57 (80.3%) | 29 (100%) | 15 (100%) | 12 (100%) | 2 (100%) |
| Rigors | 12 (16.9%) | 8 (27.6%) | 5 (33.3%) | 1 (8.3%) | 2 (100%) |
| Sputum | 28 (39.4%) | 11 (38%) | 5 (33.3%) | 4 (33.3%) | 2 (100%) |
| Sore throat | 30 (42.3%) | 18 (62.1%) | 9 (60%) | 7 (58.3%) | 2 (100%) |
| Ear ache/discharge | 3 (4.3%) | 1 (3.4%) | - | - | 1 (50%) |
| Body ache | 24 (33.8%) | 13 (44.8%) | 7 (46.6) | 4 (33.3%) | 2 (100%) |
| Chest pain | 5 (7%) | 6 (20.7%) | - | 5 (41.7%) | 1 (50%) |
| Vomiting/nausea | 14 (19.7%) | 6 (20.7%) | 3 (20%) | 1 (8.3%) | 2 (100%) |
| Breathlessness | 55 (77.5%) | 16 (55.2%) | 7 (46.6) | 7 (58.3%) | 2 (100%) |
| Chills | 19 (26.8%) | 10 (34.5%) | 4 (26.6%) | 4 (33.3%) | 2 (100%) |
| Cough | 54 (76.1%) | 23 (79.3%) | 12 (80%) | 9 (75%) | 2 (100%) |
| Haemoptysis | 3 (4.3%) | - | - | - | - |
| Nasal discharge | 28 (39.4%) | 18 (62.1%) | 7 (46.6) | 10 (83.3%) | 1 (50%) |
| Headache | 14 (19.7%) | 8 (27.6%) | 4 (26.6%) | 3 (25%) | 1 (50%) |
| Malaise | 14 (19.7%) | 10 (34.5%) | 5 (33.3%) | 4 (33.3%) | 1 (50%) |
| Abdominal pain | 8 (11.3%) | 1 (3.5%) | - | 1 (8.3%) | - |
| Diarrhoea | 4 (5.6%) | - | - | - | - |
| Seizures | - | 2 (6.9 %) | 1 (6.6%) | - | 1 (50%) |
To assess the effect of Duration of Illness (DOI) on the results of RIDT, patients were categorised into those in whom samples were collected within 5 days of development of symptoms (58) and those in whom samples were collected after 5 days of onset of symptoms (42).
Of the 58 samples collected within 5 days of onset of symptoms, 20 (34.5%) were positive by Real time RT-PCR and of these 6 (30%) were positive by rapid test. From the 42 samples collected after 5 days of onset of symptoms, 9 (21.4%) were positive by RT-PCR and of these 5 (55.6%) were positive by rapid test [Table/Fig-7]. There was more RT-PCR positivity in the early days of illness (34.5%) when the virus is high in the sample than later phase (21.4%). But the RIDT appears to be better in later part of the illness with 55.6% detection rate compared to early phase of illness (30%).
Showing results of RT-PCR and RIDT samples based on duration of illness.
| DOI* | Number | RT-PCR* | RIDT* |
|---|
| <5 days | 58 | 20 (34.5%) | 6 (30%) |
| >5 days | 42 | 9 (21.4%) | 5 (55.6%) |
| Total | 100 | 29 | 11 |
*DOI: Duration of Illness, RT-PCR: Real time reverse transcriptase polymerase chain reaction, RIDT: Rapid influenza antigen diagnostic testing
Of the samples collected in less than 5 days of illness, there were 4 false positives for influenza A by rapid test of which 3 were positive for Respiratory Syncytial Virus (RSV) by RT-PCR indicating cross reaction with RSV. RIDT and RT-PCR positive samples show the results of both the tests for the influenza types. RIDT detected 5 out of 14 (35.7%) influenza A samples and 6 out of 15 (40%) influenza B samples (p value 0.004)* [Table/Fig-8].
Comparison of Influenza type positivity results by RIDT and RT-PCR.
| Types | RT-PCR | RIDT |
|---|
| Influenza A | 14 | 5 (35.7%) |
| Influenza B | 15 | 6 (40%) |
| Total | 29 | 11 (37.9%) |
[Table/Fig-9] shows rapid test results in comparison to RT-PCR. The sensitivity, specificity, PPV and NPV for RIDT were calculated as per standard formulae which were confirmed by MedCalc ver 9.1. Out of 100 samples tested, RT-PCR detected 29 samples (10 were males and 19 were females, p-value 0.065) as positive while RIDT could detect only 11 samples (6 from males 5 from females, p-value 0.69) of the 29 (true positive, considering RT-PCR as a gold standard). Four samples were positive by RIDT and negative by RT-PCR (false positive). The RIDT could not detect 18 RT-PCR positive samples (false negative). By both the methods, 67 samples were negative (true negative).
Showing results of RT-PCR and RIDT in a 2×2 figure.
| RT-PCR (+) | RT-PCR (-) | Total |
|---|
| RIDT (+) | 11 | 4 | 15 |
| RIDT (-) | 18 | 67 | 85 |
| Total | 29 | 71 | 100 |
*RT-PCR: Real time reverse transcriptase polymerase chain reaction; RIDT: Rapid influenza antigen diagnostic testing
The overall sensitivity of this RIDT was 37.9% (95% CI 23.4% to 52.4%) and specificity was 94.4% (95% CI 91.4% to 97.2%). PPV was 73.3% (95% CI 48.8% to 88.9%) and NPV was 78.8% (95% CI 73.6% to 83.3%). The accuracy of this kit was calculated as 78% (true positives and true negatives/total number of samples tested) [Table/Fig-10] shows the sensitivity, specificity, PPV, NPV of RIDT in comparison with RT-PCR based on age, types, and DOI.
Shows Sensitivity, Specificity, NPV and PPV of RIDT and RT-PCR based on age, type and duration of illness.
| Influenza A | Influenza B | Children (≤14 y) | Adults (>14 y) | DOI <5 days | DOI >5 days |
|---|
| Samples tested | 100 | 100 | 48 | 52 | 58 | 42 |
| RT-PCR (+) | 14 | 15 | 10 | 19 | 20 | 9 |
| Biogenix (+) | 5 | 6 | 5 | 6 | 6 | 5 |
| Sensitivity (95% CI) | 35.71% (12.76% to 64.86%) | 40% (16.34% to 67.71%) | 50% (18.71% to 81.29%) | 31.58% (12.58% to 56.55%) | 30% (11.9% to 54.3%) | 55.6% (21.2% to 86.3%) |
| Specificity (95% CI) | 98.91% (94.09% to 99.97%) | 100% (95.75% to 100%) | 92.11% (78.62% to 98.34%) | 96.97% (84.24% to 99.92%) | 89.5% (75.2% to 97.1%) | 100% (89.4% to 100%) |
| PPV (95% CI) | 83.33% (38.63% to 97.54%) | 100% | 62.50% (32.31% to 85.34%) | 85.71% (43.82% to 97.88%) | 60% (32.3% to 82.5%) | 100% |
| NPV (95% CI) | 91% (87.24% to 93.73%) | 90.43% (86.20% to 93.45%) | 87.50% (78.90% to 92.91%) | 71.11% (64.32% to 77.07%) | 70.8% (64.1% to 76.8%) | 89.2% (79.9% to 94.5%) |
*PPV: Positive predictive value; NPV: negative predictive value; RT-PCR: Real time reverse transcriptase polymerase chain reaction; RIDT: Rapid influenza antigen diagnostic testing
The Ct values of PCR influenza positive samples have been divided into 3 groups of ≤25, 26 to 30 and 30-35. There was 50% detection for Ct values <25, but with more false positives. There was 12.5% detection at Ct value of 30 to 35, but with more false negatives. This infers that with decreasing viral load, the sensitivity and specificity of RIDT decreases. The results have been shown in [Table/Fig-11]. The Pearson’s correlation coefficient value r for these two variables (Ct value vs RIDT positivity) came to be about -0.32, a weak negative correlation. A r value nearer to 0 is a weak correlation. The p-value was ≃0.09 for this observation and fails to be significant marginally (for a significance level of 0.05)].
Shows RIDT positivity at different CT values of RT-PCR positive samples.
| Ct value | RIDT | RT-PCR | % Detection |
|---|
| ≤25 | 3 | 6 | 50% |
| 26-30 | 7 | 15 | 46.6% |
| 30-35 | 1 | 8 | 12.5% |
| Total | 11 | 29 | 37.9% |
Discussion
Early and timely diagnosis can affect the outcome of the patient and avoid unnecessary use of antibiotics and can also reduce the financial burden on patient. Rapid diagnosis during an outbreak may justify the use of antivirals in high risk people and can help in its containment.
Several tests are available for diagnosis of influenza infection with their own advantages and disadvantages. The gold standard RT-PCR is available in limited reference centers only, being costly and technically demanding. Therefore, there is a need for an alternative modality for influenza diagnosis which is technically easy, feasible, rapid, and cost effective. This study was undertaken to evaluate a RIDT test along these lines of requirement in acute care settings.
In a study by Ganzenmueller T et al., it was reported that RIDT had less sensitivity when RT-PCR was used as gold standard [12]. In a study by Akaishi Y et al., it was reported that if viral culture was taken as gold standard, the sensitivity of RIDT was higher [13]. But as the World Health Organisation (WHO) recommends PCR as the current gold standard for the diagnosis of influenza [11], it was considered as the standard for comparison in this study. RT-PCR detected 29 samples of which 10 (20.4%) were males and 19 (37.3%) were females. The p-value of 0.065 for this difference in positivity in both genders was statistically insignificant, which is similar to the study published previously by Mudhigeti N et al., from this center. Similar to the previous study from the centre there was no significant difference between the clinical presentations of laboratory confirmed and negative cases [6].
Dee S and Jayathissa S have reported a higher prevalence of influenza among females similar to the present study [14], which was conflicting against the findings of study by Revdiwala S et al., [15]. The positivity of RIDT was higher in males (6, 12.2%) in comparison to females (5, 9.8%) with no significant difference between the two groups (p-value 0.69).
In this study, sensitivity, specificity, PPV and NPV of RIDT were calculated based on age, gender, subtype, and DOI. These results were compared with that of RT-PCR. Though the kit claims to be free from cross reactions with many respiratory viruses and bacteria, it was observed there were four false positives, and all in males, thus bringing the specificity down, in comparison to females. Of the 4 false positives in males, three samples had laboratory confirmed diagnosis for RSV A and one was positive for Pneumonia due to E. coli. All four samples had clinical diagnosis of pneumonia with X-ray findings consistent with pneumonia.
In the current study, RIDT was found to be more sensitive in children as compared to adults. Sensitivity was 50.0% (95% CI 18.7% to 81.29%) and 31.58% (95% CI 12.58% to 56.55%) in children and adults, respectively whereas the specificity was 92.11% (95% CI 78.6% to 98.3%) and 96.9% (95% CI 84.2% to 99.9%) in children and adults, respectively. The findings of this study were in corroboration with a study by Peci A et al., from Canada [16]. They have reported a higher sensitivity for children aged less than 4 year age. Also, the sensitivity was more for the patients aged <19 year and >65 compared to 20 to 64 year age groups. The studies by Petric M et al., Rashid H et al., and Stein J et al., also had similar findings [17-19]. A meta-analysis conducted by Chartrand C et al., had also suggested a pooled sensitivity of 66.6% and 53.9% for children and adults, respectively [20].
The sensitivity and specificity of RIDT for influenza A was 35.7% and 98.9% and the same for influenza B was 40% and 100%, respectively. The p-value for this observation was 0.004 which is statistically significant indicating better performance of RIDT for diagnosis of influenza B in comparison to influenza A. Contrary observations were made in a study by Peci A et al., [16]. In a meta-analysis conducted by Merckx J et al., the traditional RIDTs had a pooled sensitivity of 54.4 % (48.9 to 59.8) and 53.2% (41.7 to 64.4) for influenza A and B respectively; a pooled specificity for influenza A and influenza B were 99.4% (99.1 to 99.7) and 99.8% (99.7 to 99.9), respectively [21].
In this study, RIDT positivity was classified based on DOI, which inversely correlated with the viral load. The limit of maximum infectivity period was taken as 5 days. The sensitivity and specificity of the rapid test for samples collected less than 5 days of illness was 30% and 89.5% respectively and for samples collected after 5 days sensitivity and specificity was 55.5% and 100%, respectively. This indicates better performance of the rapid test with increase in DOI. This observation was contrary to the study by Rouleau I et al., who stated that sensitivity of RIDT decreased after 48hr after symptom onset [22]. Poehling KA et al., have also reported decreased sensitivity of RIDT with >4 days of illness [23]. However, a study by Gordon A et al., from Central America reported increased sensitivity of RIDT after 48 hours of clinical presentation [24].
Viral load is affected by type and quality of specimen, and DOI. An attempt was also made in this study to find the effect of Ct values (semi-quantitative assessment of viral load) of RT-PCR on the results of RIDT. Sensitivity increased with less Ct value. In this study, even though sensitivity was more in Ct value <25 i.e., 50%, false positives were also more. Ct value of 26-30 had good sensitivity of 46.6% with fewer false positives. Correlation co-efficient r=-0.32, which suggests a weak negative correlation between Ct value and RIDT positivity. This was similar to a study by Koul PA et al., conducted in Northern India [5]. Ming C et al., had also reported viral load as an important factor affecting sensitivity [25].
A study by Yu ST et al., had contradictory findings to this study with the sensitivity of RIDT as 46.2% and 61.9% at Ct values <25 and 25 to 36, respectively [26]. There was increased sensitivity at Ct value >25 and they suggested increased performance of RIDT after this range. But similar to this study, Balish A et al., reported decreased sensitivity with Ct value between 25 to 36 [27]. They had compared three rapid influenza diagnostic kits i.e., Binax Now, Directigen and Quick Vue, in which all have shown similar results [Table/Fig-12].
Different studies with sensitivity of RIDT at different Ct values by different studies [26,27].
| Ct value | SD Bioline [26] | Binax now influenza A&B [27] | Directigen Flu A+B [27] | Quick-Vue A+B [27] | Onsite (Present study) |
|---|
| Ct< 25 | 46.15% (6/13) | 57.7% (27/39) | 80% (28/35) | 84.6% (34/39) | 50 (3/6) |
| 25≤ Ct ≤ 36 | 61.90% (13/21) | 23.1% (6/26) | 25% (6/24) | 50% (13/26) | 34.8 (8/23) |
| Overall | 55.88% (19/34) | 50.8% (33/65) | 57.6% (34/59) | 67.9% (47/65) | 37.9 (11/29) |
The overall sensitivity of the RIDT was 37.9% (95% CI 23.4% to 52.4%) and specificity was 94.4%, PPV was 73.3% and NPV was 78.8%. Kappa was calculated to be 0.37 (95% CI 0.18 to 0.58) suggesting a fair agreement between the two tests. The Onsite RIDT has suggested a relative sensitivity of 86.8% and 91.7% for influenza A and B, respectively. The relative specificity for the influenza A and B were 94% and 97.5%, respectively. The results of this study were compared with similar studies evaluating various RIDT kits, from India and other countries in [Table/Fig-13] [5,24,25,28]. The kits used in other studies were also mentioned in the same. Similar to this study Koul PA et al., and Ming C et al., reported a low sensitivity (16.6%-35%) and high specificity (100%) [5,25]. Contrary to this study Olsen SJ et al., and Gordon A et al., have reported high sensitivity (55.9%-100%) and variable specificity (61.2%-99.4%) [28,24].
Comparing Sensitivity, Specificity, PPV and NPV of similar studies [5,24,25,28].
| S. No. | Study | Kit used | Sensitivity | Specificity | PPV | NPV |
|---|
| 1 | Present study | Onsite (CTK Biotech) | 37.9% | 94.4% | 73.3% | 78.8% |
| 2 | Koul PA et al., [5] | Quick-Vue | 23.1% | 100% | 100% | 74.3% |
| 3 | Ming C et al., [25] | Bio-Tracer Influenza A&B Test | 16.5% | 100% | 100% | 34% |
| 4 | Ming C et al., [25] | Binax Now Influenza A&B | 22% | 100% | 100% | 36% |
| 5 | Ming C et al., [25] | Fujirebio Espline Influenza A&B-N | 26% | 100% | 100% | 36% |
| 6 | Ming C et al., [25] | BD Directigen EZ Flu A+B | 35% | 100% | 100% | 40% |
| 7 | Gordon A et al., [24] | Quick-Vue | 64.1% | 98.3% | 95.2% | 83.7% |
| 8. | Olsen SJ et al., [28] | Sofia A+B | 100% | 61.2% | - | - |
| 9. | Olsen SJ et al., [28] | Quick-Vue | 55.9% | 99.4% | - | - |
*PPV: Positive predictive value; NPV: Negative predictive value
Positive result of RIDT should be considered as significant. The negative result should be interpreted with caution as false negatives are quite high. It is advised to follow-up the negative RIDT results with RT-PCR. There are more chances of positivity if samples are collected after 48 hours of illness. Use of two swabs for collection can increase the viral load, resulting in increased sensitivity. Variable accuracy of this modality of investigation is a major set back in its use routinely during influenza outbreaks.
Limitation(s)
Due to difficulty and delay in procuring the rapid testing kit the study could not be done throughout the year.
Due to financial constraints, limited number of samples were tested. However, it is small sample size study therefore larger sample size studies are recommended for more robust and reliable results.
Though Rapid Test is also called as Point of Care (POC) testing due to its ease of performance at patient’s bedside, in this study the samples were processed in a laboratory setting due to many factors. This might have resulted in a reduced sensitivity of this test.
Conclusion(s)
Due to the low sensitivity, the RIDT is not useful in screening during an outbreak. This study was started with an intention to justify the use of RIDT in settings with minimal or no access to molecular virology laboratories or in case of ICU. With a strong clinical suspicion, it is better to start antivirals than wait for laboratory report in severely ill patients with ILI.
If there is a choice of establishing molecular lab vs evaluation of reliable and cheap RIDTs, most feasible would be the latter. Hence, authors hope for a better alternative in near future for rapid diagnosis of influenza.
*Percentages calculated with total positives as denominator in RT-PCR; #Percentages calculated with RT-PCR as denominator
*DOI: Duration of Illness, RT-PCR: Real time reverse transcriptase polymerase chain reaction, RIDT: Rapid influenza antigen diagnostic testing
*RT-PCR: Real time reverse transcriptase polymerase chain reaction; RIDT: Rapid influenza antigen diagnostic testing
*PPV: Positive predictive value; NPV: negative predictive value; RT-PCR: Real time reverse transcriptase polymerase chain reaction; RIDT: Rapid influenza antigen diagnostic testing
*PPV: Positive predictive value; NPV: Negative predictive value