Primary Open Angle Glaucoma (POAG) is a chronic progressive optic neuropathy characterized by retinal ganglion cell death and visual field loss, frequently associated with elevated IOP, recognised as one of the strongest known risk factors [1,2]. However, progression of glaucoma is seen to occur despite adequate reduction of IOP. Vascular risk factors such as hypertension, atherosclerosis, vasospasm etc., have been implicated as likely contributing risk factors in such cases [3,4]. OPP considered as the difference in BP between the arterial and venous parts of the vascular beds all through the eye, it is an important determinant of ocular blood flow [5]. It is expressed as the difference between BP and IOP (since venous pressure is analogous to IOP in the eye) [6]. The study of the relationships between IOP, BP and OPP enables us to hypothetically explain why individuals with high IOP have low OPP while others with low IOP still have low OPP (due to low BP) and hence is relevant to understand the various patterns of IOP and optic nerve damage in glaucoma [7].
Population based studies have shown lower DOPP as an independent risk factor for POAG [8,9], while others have shown wider circadian fluctuations in MOPP to be associated with POAG [10,11]. The exact relationship however between OPP and glaucoma still remains unclear. Moreover as both BP and IOP vary considerably with geographical and racial differences, it is pertinent that variations could occur in the distribution and determinants of OPP and its relationship with glaucoma in the South Indian population too. This study hence was undertaken with the aim of understanding the circadian pattern of OPP among patients from South India.
Materials and Methods
The present study was a cross-sectional observational study which included newly diagnosed, untreated cases of POAG above 40 years of age, attending glaucoma clinic of a tertiary eye hospital in South India. The study duration was 18 months beginning from June 2016 to December 2017. It was commenced after approval from the Institutional Ethics Committee. (LetterNo:51/HEC/RIOTVPM dated 10/02/2016). Subjects fulfilling the inclusion criteria were recruited after obtaining a written informed consent.
Inclusion criteria: 1) Age above 40 years; and 2) newly diagnosed, untreated cases of POAG.
Exclusion criteria: Patients with significant anterior segment or corneal pathology affecting proper measurement of IOP by GAT, cases with features of angle closure glaucoma or secondary glaucoma, presence of any other retinal pathology, optic neuropathy due to other causes, cases with systemic hypertension on treatment and those who were not willing to give consent.
All study participants underwent a comprehensive ophthalmic examination that included a detailed medical history recording, measurement of Best Corrected Visual Acuity (BCVA) using Snellen chart, slit lamp biomicroscopy. Measurement of IOP was done using Goldman Applanation Tonometry (GAT), Gonioscopy, visual field assessment using Humphrey Field Analyser (HFA), 24-2, Swedish Interactive Thresholding Algorithm (SITA) standard strategy and dilated fundus and optic disc evaluation using 78/90 Diopter (D) lens.
Primary Open Angle Glaucoma (POAG) was diagnosed in cases with IOP recorded >21 mmHg at any point at the time of diagnosis, associated with characteristic signs of glaucomatous optic nerve damage (enlarged disc cupping, focal/diffuse neuro retinal thinning/pallor, retinal nerve fibre layer defects, splinter haemorrhages etc.,) which was consistent with reproducible (atleast two) corresponding typical glaucomatous visual field defects and open angle on gonioscopy [12].
Sample size calculation: The minimum sample size calculated was 44, based on the reference study by de Oliveira AP and Kasahara N, [13] using the formula n=(Z1-α/2)2×σ2 (ε2×μ2). (Z1-α/2) represents the ‘z’ quantile association with 1-α level of confidence. The ‘z’ quantile for 95% confidence interval is 1.96. The mean OPP fluctuation was taken from the reference study, where Mean (μ)-4.0, SD (σ)-2.7, Relative precision (ε)-5%, Confidence Interval (CI)-95%.
Subjects were further categorised based on the severity of glaucoma into early, moderate and severe based on the Hodapp Parish Anderson criteria [14]. The BP and IOP of subjects were recorded during a 24 hour period of hospital stay, with all measurements taken every 4th hourly (4.00 AM, 8.00 AM, 12.00 PM, 4.00 PM, 8.00 PM and 12.00 AM) by the same examiner. Simultaneous measurement of Systolic BP (SBP) and Diastolic BP (DBP) were taken in the right upper arm in sitting position using the mercury sphygmomanometer. In the awake state, measurement of BP was taken after the patient had been seated for atleast 5 minutes, according to the protocol used in the Multi-ethnic Study of Atherosclerosis [15]. IOP was then measured by GAT after the subject had been seated at the slit lamp for atleast 5 minutes. During the sleep period, patients were awakened and seated for at least 5 minutes and measurements were taken as elaborated above. All patients were asked to refrain from any physical activity that could affect BP during the hospital stay. The IOP of the affected eye was chosen in unilateral cases, while in bilateral cases, the worse eye was chosen.
The MAP was calculated as DBP +1/3 (SBP–DBP) while MOPP was calculated using the standardised formula MOPP=2/3×MAP-IOP. SOPP was calculated as SOPP=SBP-IOP, and DOPP was expressed as DOPP=DBP-IOP [16]. Nocturnal MAP was calculated as the average of MAP values taken from 8.00 PM to 4.00 AM the following day, and diurnal MAP was calculated as the average of MAP measurements from 8.00 AM to 4.00 PM. Nocturnal MAP and diurnal MAP fluctuation were calculated as the highest minus the lowest MAP value within each period. Nocturnal and diurnal SOPP, DOPP and MOPP fluctuations were calculated in the same manner. Twenty four-hour MOPP fluctuation was calculated as peak MOPP minus trough MOPP.
Statistical Analysis
Categorical variables were expressed as numbers and percentages while continuous variables are expressed as mean±Standard Deviation (SD). Correlation of OPP with age and severity of the disease was assessed using Pearson correlation coefficient and multivariate Analysis of Variance (ANOVA) test. All statistical analysis was done using the SPSS version 16.0. The normality of data was checked in SPSS using the Shapiro Wilk test.
Results
A total of 44 subjects were recruited for the study of which females constituted 43.2%. The mean age was 56.84±9.2 years. The cohort included 15 cases in early stage, 12 cases in moderate stage and 17 cases in severe stage with mean age of 49.4±8.9 years, 55.8±9.4 years and 64.3±4.3 years, respectively [Table/Fig-1].
Distribution of age and sex.
| Sex | Age in years | Total |
|---|
| <60 | >60 |
|---|
| N | % | N | % | N | % |
|---|
| Male | 13 | 54.2 | 12 | 60 | 25 | 56.8 |
| Female | 11 | 45.8 | 8 | 40 | 19 | 43.2 |
| Total | 24 | 100 | 20 | 100 | 44 | 100 |
The mean SBP, DBP and MAP recorded were 123.22±10.02 mmHg, 77.46±6.42 mmHg and 92.67±6.91 mmHg [Table/Fig-2] and the mean diurnal and the mean nocturnal MAP fluctuations were 3.12±3.33 mmHg and 5.88±3.82 mmHg, respectively [Table/Fig-3]. The mean IOP in 36 out of 44 cases ranged between 20 to 25 mmHg, the mean IOP fluctuation being 2.55±2.1 mmHg.
| Parameters | Mean (mmHg) | SD |
|---|
| SBP | 123.22 | 10.02 |
| DBP | 77.46 | 6.42 |
| MAP | 92.67 | 6.91 |
| IOP | Peak | 24.14 | 2.23 |
| Trough | 21.59 | 2.34 |
| SOPP | 100.32 | 9.63 |
| DOPP | 54.57 | 5.89 |
| MOPP | 46.52 | 4.37 |
SBP: Systolic blood pressure; DBP: Diastolic blood pressure; MAP: Mean arterial pressure; IOP: Intraocular pressure; SOPP: Systolic ocular perfusion pressure; DOPP: Diastolic ocular perfusion pressure; MOPP: Mean ocular perfusion pressure
Correlation of parameters with glaucoma severity using Pearson correlation.
| Parametres | Glaucoma severity | | r | p-value |
|---|
| Early (N=15) | Moderate (N=12) | Severe (N=17) | Total |
|---|
| Mean | SD | Mean | SD | Mean | SD | Mean |
|---|
| IOP fluctuation | 1.80 | 0.84 | 1.92 | 1.10 | 3.65 | 2.88 | 2.55±2.1 | 0.415 | 0.520 |
| Mean IOP | 22.99 | 1.70 | 22.43 | 1.68 | 23.11 | 2.29 | 22.8±1.9 | 0.032 | 0.883 |
| Mean SBP | 120.70 | 8.46 | 125.53 | 11.79 | 123.81 | 10.08 | 123.2±10.02 | 0.128 | 0.405 |
| Mean DBP | 76.95 | 4.71 | 77.89 | 7.90 | 77.62 | 6.93 | 77.46±6.42 | 0.043 | 0.781 |
| Mean MAP | 91.20 | 5.41 | 93.60 | 7.79 | 93.32 | 7.61 | 92.67±6.9 | 0.129 | 0.720 |
| MAP diurnal fluctuation | 1.40 | 1.34 | 3.47 | 4.03 | 4.39 | 3.56 | 3.12±3.33 | 0.253 | 0.330 |
| MAP nocturnal fluctuation | 2.33 | 1.73 | 6.41 | 3.52 | 8.64 | 2.81 | 5.88±3.82 | 0.533 | <0.001 |
| SOPP diurnal fluctuation | 2.12 | 2.45 | 2.74 | 2.33 | 3.83 | 2.55 | 2.26±2.55 | 0.042 | 0.788 |
| SOPP nocturnal fluctuation | 2.72 | 1.46 | 4.82 | 2.53 | 11.2 | 2.57 | 4.24±3.6 | 0.835 | <0.001 |
| DOPP diurnal fluctuation | 1.65 | 1.2 | 2.43 | 2.45 | 4.26 | 2.37 | 2.95±2.51 | 0.358 | 0.17 |
| DOPP nocturnal fluctuation | 2.2 | 1.41 | 5.26 | 2.25 | 10.71 | 2.5 | 3.9±2.8 | 0.768 | <0.001 |
| MOPP diurnal fluctuation | 1.33 | 0.75 | 2.51 | 2.51 | 3.06 | 1.99 | 2.32±1.96 | 0.232 | 0.130 |
| MOPP nocturnal fluctuation | 2.27 | 1.34 | 5.61 | 2.34 | 9.24 | 2.01 | 5.87±3.53 | 0.685 | <0.001 |
| MOPP 24 hr fluctuation | 2.87 | 1.23 | 6.50 | 2.62 | 10.29 | 2.23 | 6.72±3.78 | 0.636 | <0.001 |
Fluctuations in IOP showed no significant correlation with age (p-value=0.12) or severity of glaucoma (p-value=0.52). Nocturnal MAP fluctuation, however, showed positive correlation with age (p<0.001, r=0.447) and severity of glaucoma (p<0.001, r=0.533) [Table/Fig-3,4].
Correlation of parameters with age using Pearson correlation.
| Parameters | Mean | r | p-value |
|---|
| IOP fluctuation | 2.55±2.1 | 0.377 | 0.12 |
| MAP diurnal fluctuation | 3.12±3.33 | 0.284 | 0.071 |
| MAP nocturnal fluctuation | 5.88±3.82 | 0.447 | <0.001 |
| SOPP diurnal fluctuation | 2.26±2.55 | 0.118 | 0.446 |
| SOPP nocturnal fluctuation | 4.24±3.6 | 0.577 | <0.001 |
| DOPP diurnal fluctuation | 2.95±2.51 | 0.201 | 0.190 |
| DOPP nocturnal fluctuation | 3.9±2.8 | 0.481 | <0.001 |
| MOPP diurnal fluctuation | 2.32±1.96 | 0.057 | 0.712 |
| MOPP nocturnal fluctuation | 5.87±3.53 | 0.557 | <0.001 |
| MOPP 24 Hour fluctuation | 6.72±3.78 | 0.510 | <0.001 |
The 24 hour SOPP profile showed a dip in its values at 4.00 AM in 19 cases and 8.00 AM in 10 cases as shown in [Table/Fig-5]. The 24 hour DOPP profile showed a nocturnal dip in its values at 12.00 AM in 21 cases and 4.00 AM in 16 cases as shown in [Table/Fig-5]. The diurnal fluctuations of both SOPP and DOPP did not show any correlation with age or severity of glaucoma. The nocturnal SOPP fluctuations however showed significant positive correlation with age (p<0.001, r=0.577) and severity of glaucoma (p<0.001, r=0.835). The nocturnal DOPP fluctuations too showed significant positive correlation, with age (p<0.001, r=0.481) and more so with severity of glaucoma (p<0.001, r=0.768). [Table/Fig-3,4].
Distribution of time of trough of SOPP, DOPP and MOPP.
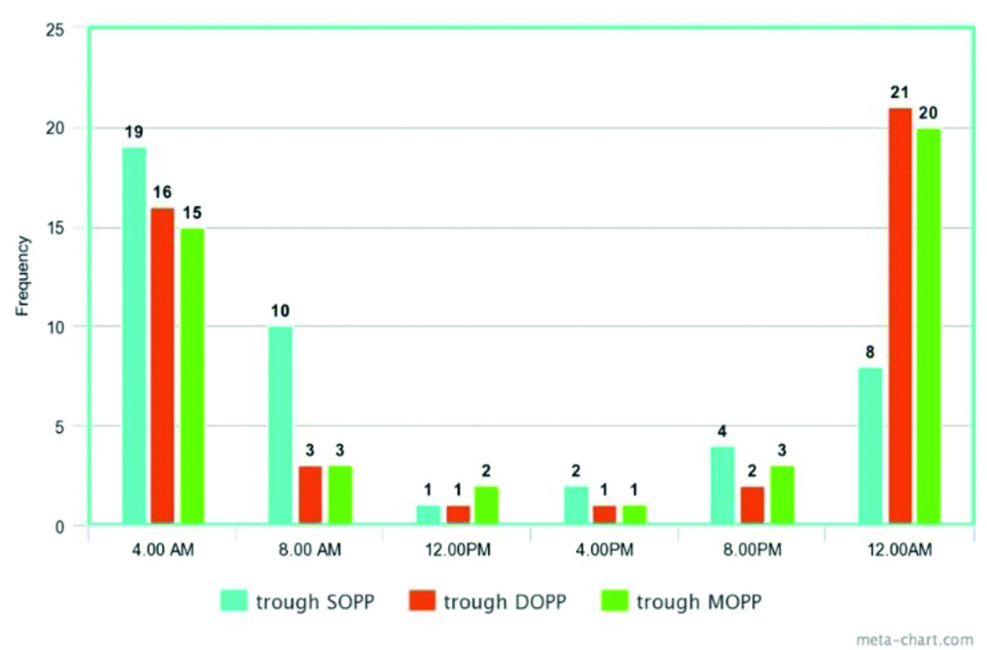
The 24 hour MOPP profile also showed a nocturnal dip at 12.00 AM in 20 cases and 4.00 AM in 15 cases as shown in [Table/Fig-5].
Diurnal MOPP fluctuation did not show any significant correlation while nocturnal MOPP fluctuation showed significant correlation with age (p<0.001, r=0.557) and severity of disease (p<0.001, r=0.685) [Table/Fig-6].
Correlation of MOPP with age and Glaucoma severity using Pearson Correlation.
| MOPP | Age | Glaucoma severity |
|---|
| ≥60 y | <60 y | Total | r | p | Early | Moderate | Severe | Total | r | p |
|---|
| Diurnal fluctuation | 2.7±2.2 | 1.9±1.6 | 2.3±1.9 | 0.057 | 0.712 | 1.3±0.7 | 2.5±2.5 | 3.0±1.9 | 2.3±1.9 | 0.232 | 0.130 |
| Nocturnal fluctuation | 7.9±3.1 | 4.1±2.8 | 5.8±3.5 | 0.557 | <0.001 | 2.27±1.3 | 5.61±2.3 | 9.2±20 | 5.8±3.5 | 0.685 | <0.001 |
| 24 hr fluctuation | 9.0±3.4 | 4.7±2.9 | 6.7±3.7 | 0.510 | <0.001 | 2.8±1.2 | 6.5±2.6 | 10.2±2.2 | 6.7±3.7 | 0.636 | <0.001 |
On multivariate analysis [Table/Fig-7], the correlation of the nocturnal parameters (fluctuation in MAP, SOPP, DOPP and MOPP) and 24 hour MOPP fluctuation with age were not found to be statistically significant. On the other hand, their correlation with severity of glaucoma remained statistically significant (p<0.001). The diurnal parameters did not show any significant correlation with age or severity of glaucoma.
Multivariate analysis using ANOVA test.
| Source | Dependent variable | Type III sum of squares | df | Mean square | F | p |
|---|
| Age | Nocturnal MAP fluctuation | 39.219 | 1 | 39.219 | 6.115 | 0.018 |
| Nocturnal SOPP fluctuation | 2.436 | 1 | 2.436 | 0.480 | 0.493 |
| Nocturnal DOPP fluctuation | 0.602 | 1 | 0.602 | 0.125 | 0.726 |
| Nocturnal MOPP | 9.249 | 1 | 9.249 | 2.631 | 0.113 |
| 24 hour MOPP fluctuation | 12.802 | 1 | 12.802 | 3.305 | 0.077 |
| Severity of glaucoma | Nocturnal MAP fluctuation | 142.068 | 2 | 71.034 | 11.075 | <0.001 |
| Nocturnal SOPP fluctuation | 439.726 | 2 | 219.863 | 43.274 | <0.001 |
| Nocturnal DOPP fluctuation | 370.806 | 2 | 185.403 | 38.496 | <0.001 |
| Nocturnal MOPP | 210.130 | 2 | 105.065 | 29.888 | <0.001 |
| 24 hour MOPP fluctuation | 249.885 | 2 | 124.943 | 32.254 | <0.001 |
Discussion
In present study, the mean IOP in 36 out of 44 cases ranged between 20 to 25 mmHg with the mean IOP fluctuation being 2.55±2.1 mmHg. Similar results were also noted by de Oliveira AP and Kasahara N., [13]. The role of IOP fluctuations in glaucoma progression remains controversial. A study by Asrani S et al., using self-tonometry had found strong association between diurnal and short term IOP fluctuations in glaucoma progression [17], while studies in ocular hypertensives and normal tension glaucoma have shown contradicting results [18,19]. No significant association of IOP fluctuations and severity of glaucoma were found in present study. Factors such as variations in the study population, criteria used to define progression, the time and type of tonometry and data analysis might have contributed to these differences.
The mean values of SBP, DBP and MAP in present study were similar to the study by Sung KR et al., although the mean diurnal and nocturnal MAP fluctuation were less pronounced [16]. Significant association of nocturnal MAP fluctuations with severity of glaucoma was noted in present study. Sung KR et al., too, reported similar results with greater nocturnal MAP fluctuations in their study group with visual field progression [16].
The SOPP in POAG showed conflicting observations. In present study, majority (>50% cases) had SOPP more than 100 mmHg. In the Singapore Malay Eye Study [20] however, higher values (mean 134.5±24.6 mmHg) were observed in glaucoma while the Barbados Eye study [21], reported patients with lower mean SOPP (<101.3 mmHg) to have increased relative risk of developing POAG. Low SOPP was also reported to be a predictor for glaucoma progression in the Early Manifest Glaucoma Trial (EMGT) [9,22].
The DOPP values in 25 out of 44 cases were in the range 50-60 mmHg. Low DOPP has been implicated as a risk factor for glaucoma in numerous population based studies [9,21,23-24]. These studies, in line with the Egna-Neumarkt Study [25] have proposed a strong association with DOPP values <55 mmHg. However in many of these studies the results were not adjusted for glaucoma medications or anti-hypertensive treatment.
The mean of MOPP observed in present study were found to be lower than the Singapore Malay Eye Study [19], (51.6±10.2), which also reported high risk of glaucoma with DBP, MOPP or DOPP values in the lowest quartile. Another study [26] on the other hand, have shown no significant association of the amplitude of MOPP with glaucoma severity.
The circadian patterns of OPP also have shown a great deal of variation. For example, in a study by Costa VP et al., [27] the 24 hr OPP profile revealed higher mean SOPPs during the morning hours (08:00 AM and 10:00 AM) while in present study the lowest SOPP were noted in the early morning hours. In present study significant association was found between nocturnal SOPP fluctuation and severity of glaucoma. Sung KR et al., too had reported greater SOPP fluctuation in their study group, but diurnal and nocturnal fluctuations were not assessed separately [16].
The circadian pattern of DOPP in present study, with trough occurring during midnight to early morning hours has been reported consistently with many studies [28-30]. In general, DOPP curves have shown to correlate well with the BP curves. In present study, nocturnal DOPP fluctuation was found to show significantly correlation with severity of glaucoma while diurnal DOPP fluctuations did not show any significant. Sung KR et al., again had observed greater DOPP fluctuations in their group, but had not assessed diurnal and nocturnal fluctuations separately [16].
The 24 hour MOPP fluctuation was found to be the most consistent prognostic factor in glaucoma progression reported by many studies [10,11,26]. The present study showed significant correlation not only of 24 hour MOPP fluctuation, but also of the nocturnal MOPP fluctuation, with the severity of glaucoma. The MOPP rhythm has been observed to be closely related to the 24 hour BP curve, rather than the IOP curve. This implied that IOP changes hardly affect OPP changes [26].
The above results imply nocturnal dip in OPP, especially in advanced POAG raising a role of haemodynamic factors in the progression of POAG. These observations can further be extrapolated to prevent nocturnal hypotension especially in hypertensive patients by appropriate drug scheduling and tailoring of pharmacotherapy.
Limitation(s)
The limitations of present study included the relatively small sample size and the absence of a normal age matched control group to compare the different variables. As 24 hour hospitalisation of normal subjects (as controls) with 4th hourly measurements of IOP and BP, disrupting their sleep rhythm, had its own ethical and feasibility concerns, authors could not get ready volunteers. Both BP and IOP recordings were measured in the sitting position after waking the patients from sleep, disrupting the prevailing physiological state. Use of automated 24 hour ambulatory monitoring devices would be ideal for recording the measurements without such fallacies.
Conclusion(s)
The 24 hour circadian variation of OPP in POAG showed a nocturnal dip in all OPP parameters (systolic, diastolic as well as Mean OPP), which showed a significant correlation with the severity of the disease in most of the patients. The findings hence support the incorporation of OPP evaluation in the clinical evaluation and management of glaucoma.
SBP: Systolic blood pressure; DBP: Diastolic blood pressure; MAP: Mean arterial pressure; IOP: Intraocular pressure; SOPP: Systolic ocular perfusion pressure; DOPP: Diastolic ocular perfusion pressure; MOPP: Mean ocular perfusion pressure