Overweight and obesity are emerging health problems in India. According to Indian Council of Medical Research- India Diabetes (ICMR-INDIAB) study 2015, prevalence rate of obesity and central obesity varies from 11.8% to 31.3% and 16.9% to 36.3%, respectively [1]. The Obesity Society defines obesity as a disease [2], and not only an underpinning of major chronic diseases, but a serious debilitating condition in its own right [3].
Obesity is a complex and multifactorial disorder, and interaction of genotype and environmental causes such as lifestyle, unhealthy diet patterns, and physical inactivity, are risk factors for excess weight and obesity which is associated with several non-communicable diseases including diabetes, arthritis, hypertension, hyperlipidemia, and CVD [4-6].
The obese population is classified into two phenotypes: Metabolically Healthy Obese (MHO) and Metabolically Unhealthy Obese (MUHO). Varied metabolic disorders are often seen associated with obesity, however, all obese are necessarily not affected. MHO is an emerging phenotype within the obese population with moderate risks between healthy obese and unhealthy obesity phenotypes [7]. An increase in prevalence of overweight, obesity, and also, metabolic syndrome has indicated that the enzymes of liver have an important role as determinants of cardiovascular disease, hyperlipidemia and atherothrombotic risk profile [8].
It has been reported in a longitudinal study that approximately 30% to 50% of people with MHO convert to MUO phenotype after 4 to 20 years of follow-up. MHO with an increased BMI, old age; presence number of abnormal metabolic criteria, hepatic steatosis, values closer to upper limit of normal range has a greater risk of changing from MHO phenotype to MUO phenotype [9].
Liver function has complex enzyme and disease specific effects on major non-communicable diseases. Studies on importance of liver enzymes in obesity phenotypes in possible prediction of cardiovascular risks are scarce. The study aimed to investigate the correlation between liver enzymes with anthropometric indices of obesity and lipid profile in different obese phenotypes at a tertiary care centre.
Materials and Methods
An observational study was conducted in the Department of Biochemistry, RUHS College of Medical Sciences and associated hospital, Jaipur, Rajasthan, India for a period of 6 months (from December 2018 to May 2019).
A total number of 180 obese participants were included in the study. The study was approved by the Institutional Ethics Committee vide letter no. RUHS-CMS/Ethics Comm./2018/160 dated 31/12/2018. Prior to the study, all eligible individuals were briefed about the study and informed consent was taken of all enrolled participants.
Sample size calculation: Sample size was calculated According to Annual Health Survey Report, 2014, India. Here p is the prevalence of obesity (BMI≥25) in Rajasthan and L is 5% (α error) .
Inclusion criteria: Participants of age 18 to 59 years with BMI cut-off (>25 kg/m2) [10] and meeting the National Cholesterol Education Program (NCEP) Adult Treatment Panel III (ATP) criteria, for metabolic health status [11] were included in the study.
The obese participants who had ≥3 metabolic abnormalities were defined as MUHO and who had <3 components were defined as MHO [11].
Exclusion criteria: Any clinical evidence of liver cirrhosis, biliary obstructive diseases, other secondary chronic liver diseases acute or chronic viral hepatitis, auto-immune hepatitis, use of hepatotoxic drugs, fatty liver, heavy alcoholics, heavy smokers, abnormal liver enzymes (5-10 times the upper reference limit) and pregnant and lactating women were excluded from the study.
The participants of the study were divided into two phenotypic groups according to NCEP ATP III criteria [11].
Group 1: Metabolically Healthy Obese (MHO) (n=90)
Group 2: Metabolically Unhealthy Obese (MUHO) (n=90)
Demographic information questionnaire (including physical activity, medical history, food and alcohol consumption and smoking status) were noted in proforma. Traditional cardiovascular risk factors were also evaluated in the study participants.
Anthropometric parameters: Anthropometric parameters were obtained from all participants. Height was measured with stadiometer and body weight using a weighing scale that measured to precisions of the nearest 1 cm and 0.1 kg, respectively. The participants were weighed without shoes. BMI was calculated as weight in kilograms divided by height in meters squared. Waist Circumference (WC) and Hip Circumferences (HC) were measured in cm using an inelastic tape. Blood pressure was measured using mercury sphygmomanometer. Pulse pressure which was calculated (Pulse Pressure=Systolic Blood Pressure−Diastolic Blood Pressure).
Electrocardiogram (ECG) was performed in supine position for all study participants.
Biochemical parameters: Fasting blood samples were collected by using aseptic technique and analysed for biochemical parameters viz., fasting serum glucose, lipid profile {Total Cholesterol (TC), Triglycerides (TG), High Density Lipoprotein-Cholesterol (HDL-C), Low Density Lipoprotein-Cholesterol (LDL-C) and Very Low Density Lipoprotein-Cholesterol (VLDL-C)}, liver enzymes {Aspartate aminotransferase (AST), Alanine aminotransferase (ALT) and GGT} levels. All these parameters were analysed on fully auto analyser (Beckman Coulter AU 680).
Statistical Analysis
All continuous variables were expressed as mean±Standard Deviation (SD) and appropriate statistical methodology like percentages, z-test and spearman’s correlation coefficient used for analysis of data. Data was analysed by using Microsoft excel software. Minimum level of significance was taken as p <0.05.
Results
Among 180 obese participants 76 were males and 104 females. The mean age was 40.42±10.84. The percentage of male participants in the study was found to be 41 (23%) and 34 (19%) and in female participants 49 (27%) and 56 (31%) in MHO and MUHO groups, respectively.
A significant increase in weight was observed in MUHO participants when compared to MHO participants. Age, BMI, WC, HC, WHR and diastolic blood pressure showed highly significant (p<0.001) difference between MHO and MUHO participants [Table/Fig-1].
Comparison of anthropometric parameters in metabolically healthy.
| Parameters | Groups | z-test | p-value |
|---|
| MHO (N=90) Mean±SD | MUHO (N=90) Mean±SD |
|---|
| Age (years) | 37.57±10.67 | 43.27±10.29 | 3.65 | <0.001** |
| Weight (kg) | 76.27±8.55 | 78.86±8.76 | 1.98 | <0.05* |
| Height (cm) | 162.94±9.07 | 154±9.41 | 1.782 | NS |
| Body mass index (kg/m2) | 28.45±2.22 | 29.99±2.09 | 3.8271 | <0.001** |
| Waist circumference (cm) | 89.69±5.04 | 90.01±4.973 | 3.184 | <0.001** |
| Hip circumference (cm) | 95.52±5.32 | 99.88±5.13 | 5.596 | <0.001** |
| Waist-hip ratio | 0.902±0.0173 | 0.939±0.029 | 10.67 | <0.001** |
| Systolic blood pressure (mmHg) | 117.19±14.37 | 124.51±17.65 | 1.463 | NS |
| Diastolic blood pressure (mmHg) | 77.15±5.91 | 82±4.032 | 6.082 | <0.001** |
| Pulse Pressure (mmHg) | 40.04±15.97 | 42.506±15.016 | 1.029 | NS |
(MHO) and metabolically unhealthy obese (MUHO) phenotypes; NS (nonsignificant); *Significant (p<0.05); **Highly Significant (p<0.001)
On comparison of biochemical parameters between MUHO and MHO participants, liver enzymes ALT showed significant difference (p<0.05) and GGT showed highly significant difference (p<0.001). However, no significant change was found in the levels of AST in both study groups. A highly significant difference was observed in MUHO participants as compared to MHO in fasting serum glucose (p<0.001) and in lipid profile parameters viz., HDL-C, LDL-C, VLDL-C, TC and TG (p<0.001) [Table/Fig-2].
Comparison of biochemical parameters in Metabolically Healthy (MHO) and Metabolically Unhealthy Obese (MUHO) phenotypes.
| Parameters | Groups | z-test | p-value |
|---|
| MHO (N=90) Mean±SD | MUHO (N=90) Mean±SD |
|---|
| Fasting serum glucose (mg/dL) | 89.28±20.15 | 121.18±64.44 | 4.483 | <0.001** |
| AST (U/L) | 26.099±18.04 | 28.11±11.36 | 0.8703 | NS |
| ALT (U/L) | 20.03±21.29 | 25.322±10.71 | 2.321 | <0.05* |
| GGT (U/L) | 25.96±26.40 | 34.93±9.45 | 3.958 | <0.001** |
| HDL-C (mg/dL) | 46.567±8.51 | 40.74±6.63 | 4.58 | <0.001** |
| VLDL-C (mg/dL) | 19.22±7.04 | 40.02±14.04 | 12.571 | <0.001** |
| LDL-C (mg/dL) | 93.32±24.63 | 134.44±37.64 | 7.1382 | <0.001** |
| TC (mg/dL) | 160.41±29.35 | 203.69±40.35 | 8.0194 | <0.001** |
| TG (mg/dL) | 115.87±34.18 | 218.44±80.72 | 10.48 | <0.001** |
AST: Aspartate aminotransferase; ALT: Alanine aminotransferase; GGT: Gamma glutamyltransferase; HDL-C: High density lipoprotein cholesterol; VLDL-C: Very low density lipoprotein cholesterol; TC: Total cholesterol; LDL-C: Low density lipoprotein cholesterol; TG: Triglycerides; NS: Nonsignificant; *Significant (p<0.05); **Highly Significant (p<0.001)
In MHO, group ECG of 78 participants was found to be normal and 12 participants found to be abnormal. In MUHO group, ECG of 72 participants found to be normal and 18 participants found to be abnormal.
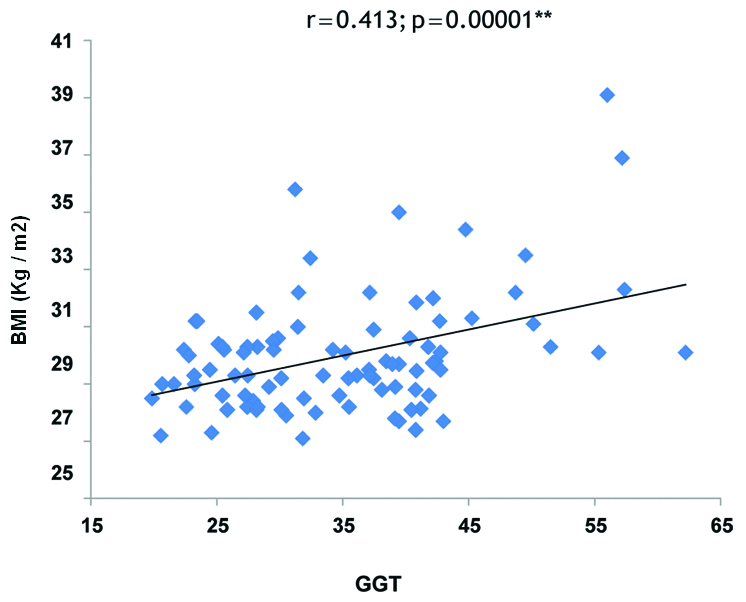
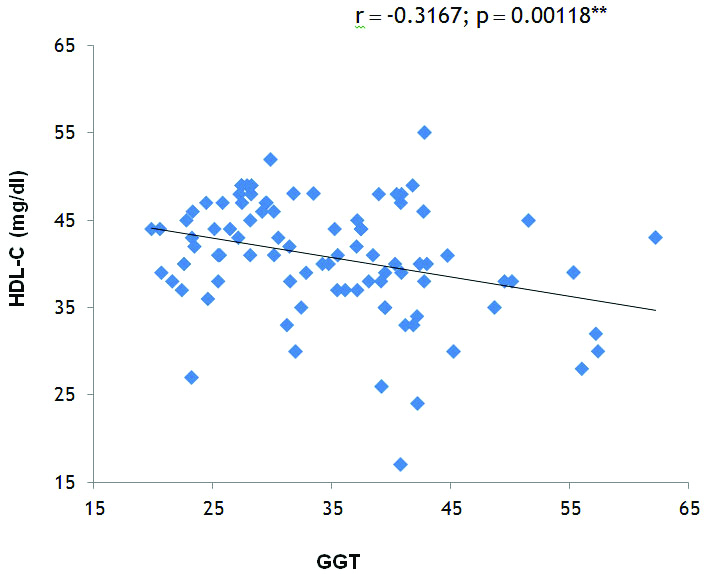
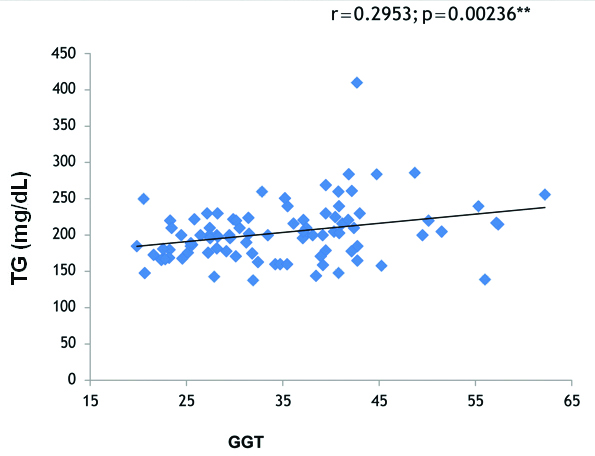
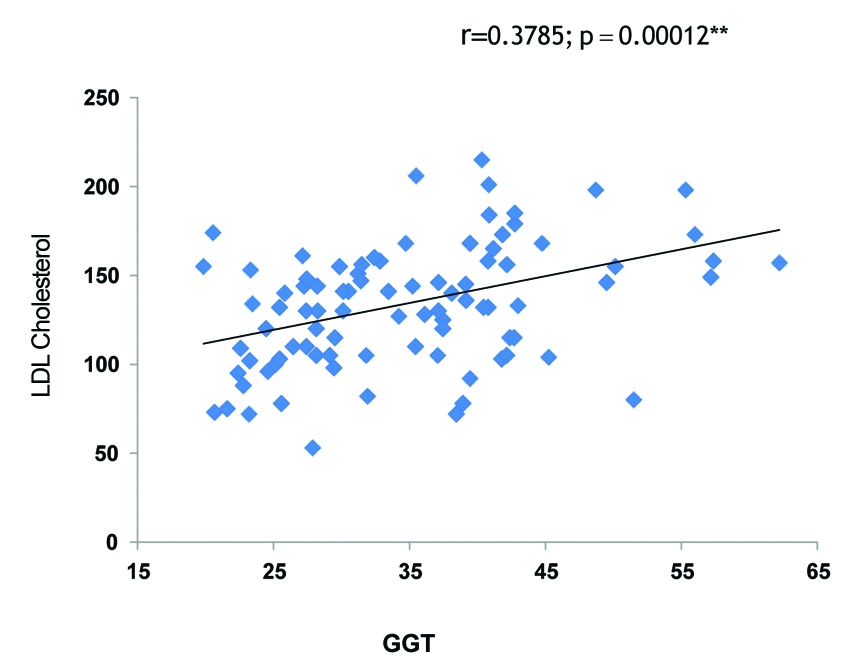
Correlation analysis in MUHO phenotype in our study showed that GGT levels were significantly positively correlated with BMI (r=0.413, p<0.001) [Table/Fig-3], significantly negatively correlated with HDL Cholesterol (r=-0.3167, p<0.001) [Table/Fig-4], TG (r=0.2623, p=0.006) [Table/Fig-5], TC (r=0.2953, p=0.0023) [Table/Fig-6] and LDL Cholesterol (r=0.3785, p<0.001) [Table/Fig-7]. There was a significant positive association found between serum ALT and LDL Cholesterol (r=0.2522, p=0.0082) as well as between serum ALT and BMI (r=0.2391, p=0.0116), and serum ALT was significantly negatively correlated with HDL Cholesterol (r=-0.2604, p=0.0065). No significant correlation was found in MHO phenotype between liver enzymes, BMI and lipid profile parameters.
Correlation of Gamma Glutamyltransferase (GGT) and Body Mass Index (BMI) in Metabolically Unhealthy Obese (MUHO) group.
Correlation of Gamma Glutamyl Transferase (GGT) and high density lipoprotein cholesterol in Metabolically Unhealthy Obese (MUHO) group.
Correlation of Gamma Glutamyl Transferase (GGT) and Triglycerides (TG) in Metabolically Unhealthy Obese (MUHO) group.
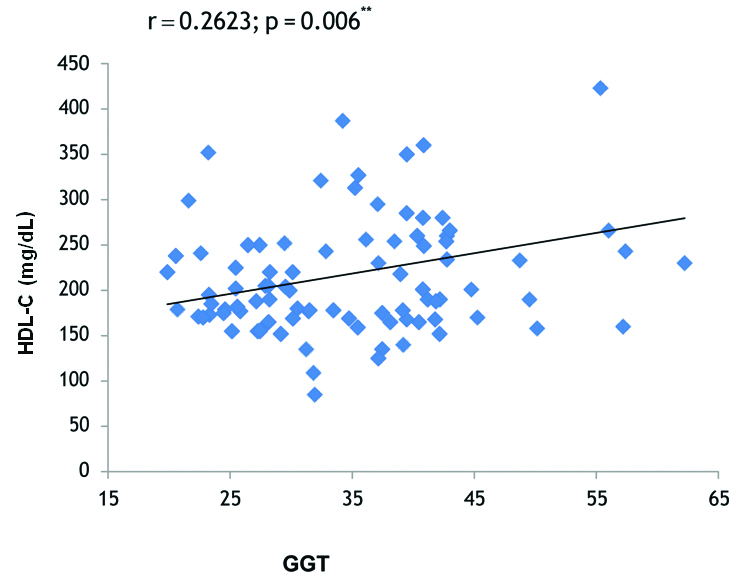
Correlation of Gamma Glutamyl Transferase (GGT) and Total Cholesterol (TC) in Metabolically Unhealthy Obese (MUHO) group.
Correlation of Gamma Glutamyl Transferase (GGT) and low density lipoprotein cholesterol (LDL-C) in Metabolically Unhealthy Obese (MUHO) group.
Discussion
Obesity has numerous adverse effects and is widespread in population across different regions. This study reports significantly higher BMI (p<0.001) and mean WC in MUHO participants when compared with MHO participants. Results of our study show highly significant increase in diastolic blood pressure (p<0.001) in MUHO participants when compared to MHO participants. These results were in accordance to previous studies [12,13].
A significantly higher mean HC and waist-hip ratio (p<0.001) in MUHO participants when compared with MHO participants was observed in the present study. The findings of the present study were in accordance with other study that demonstrated a statistically significant higher increase in WHR (p<0.001) and HC (p<0.001) in MUHO participants when compared with MHO participants [14]. Schroder H et al., reported that a surge in BMI and abdominal obesity are the factors predicting the shift from MHO to MUHO [15].
On the comparison of biochemical parameters in both the study groups, it was found that mean fasting serum glucose levels were higher and statistically highly significant (p<0.001) in MUHO when compared to MHO participants. Similar findings have been reported by Jung CH et al., in their study [16]. A cohort study in Chinese adults reported that metabolically healthy overweight may be associated with raised future risks of glucose derangements [17].
In the present study, levels of AST (U/L) and ALT (U/L) was found to be raised in MUHO participants but increase in AST was statistically nonsignificant whereas, ALT was significantly higher (p<0.05) in MUHO participants when compared with MHO participants. Similar findings were reported by Xie J et al., [13]. Decreased amounts of liver enzyme, ALT represents decreased hepatic insulin resistance and reduction in liver fat content. This might be partially responsible for the better metabolic profile of MHO individuals [18].
The present study reported raised levels of mean GGT in MUHO participants which was highly significant (p<0.001) when compared with MHO participants. GGT initiates the hydrolysis of extracellular Glutathione (GSH). These are known to promote LDL oxidation by reducing Fe (III) to redox-active Fe (II). GGT-mediated reactions catalyse the oxidation of LDL lipoproteins. Oxidation of LDL lipoproteins contributes to oxidative events which influences evolution and rupture of plaque [19]. A mendelian randomisation study on liver enzymes and risk of ischemic heart disease and type 2 diabetes mellitus has reported that GGT increases the risk of coronary artery disease/Myocardial Infarction (MI) [20].
This study reported a highly significant (p<0.001) lower levels of mean HDL-C and increased levels of mean TC, TG, LDL-C and VLDL-C in MUHO participants when compared to MHO participants. It was in agreement with the study of Zhang H et al., [12]. It has been reported that individuals with low TG and high HDL-C are likely to develop the MHO phenotype with weight gain, whereas those with high TG are likely to develops MUHO [21].
The findings of the present study shows a correlation that GGT is positively associated with BMI (r=0.413, p<0.001), TC (r=0.2953, p=0.0023) TG (r=0.2623, p=0.006), LDL Cholesterol (r=0.3785, p<0.001) and significantly negatively correlated with HDL Cholesterol (-r=0.3167, p<0.001) in MUHO participants [Table/Fig-3,4,5,6 and 7]. On other hand, no significant correlation was found in MHO group between GGT and these parameters. Xie J et al., reported in their study GGT was positively associated with TG, Homeostatic Model Assessment of Insulin Resistance (HOMA-IR), Fasting Plasma Glucose (FPG) and, WC and not associated with BP and HDL-C [13]. Furthermore, a significant positive correlation of ALT with TG and WC was observed, on contrast; it was inversely associated with HDL-C and had no significant relationship with BP and FPG.
Previous studies evaluating the association between metabolically healthy obesity and CVD risk have shown inconsistent results. Thomsen M and Nordestgaard BG, reported that MHO individuals are at higher risk of developing MI and ischaemic heart disease [22]. Numerous studies have reported that MHO participants were at low risk of obesity-related cardiometabolic disturbances [21,23]. There is evidence that suggests that MHO individuals are rather protected from CVD as compared to Metabolically Abnormal Obese (MAO) individuals [23].
An Association between obesity categories with CVD and its related risk factors in the MASHAD cohort study population has been reported. Obesity categories were significantly correlated with a greater prevalence of higher serum levels of TC, higher TG, lower HDL, and higher FBG. After 6 years follow-up, incrementally increased obesity categories depicted a significant association with up to approximately two-fold higher risks of cardiovascular events in the female gender [24]. The present study also observed high levels of TC, TG, LDL-C, VLDL-C and low levels of HDL-C in MUHO participants in this study.
The phenotype of “medically healthy obesity” seems to be a transient state and data have found that atleast half of participants with MHO at baseline convert to metabolically unhealthy obesity with increased risk of CVD [25].
Limitation(s)
The study has few limitations. Firstly, it was conducted in a single center, secondly, sample size is relatively small. Thirdly, follow-up on long term metabolic fate of MUHO participants was not done and lastly liver biopsy for confirmation of obesity related hepatic pathology was not performed. The findings of the study provide scope for further prospective studies with large sample population with collection of data regarding potential confounders to confirm association and prognostic value of GGT with CVD in obesity phenotypes. Since, this was a short term study patients were not followed up to evaluate whether liver enzymes were implicated in CVD events.
Conclusion(s)
In Metabolically Unhealthy Obese (MUHO) phenotype, GGT showed a strong positive correlation with BMI, lipid parameters viz., LDL-C, TC, TG and negative correlation with HDL-C. The results of study indicate that MUHO participants have a substantially increased risk of CVD. A strong correlation with BMI suggests that timely intervention of lifestyle modifications should be practiced in MHO participants to prevent the risk of developing metabolic abnormalities in future.
(MHO) and metabolically unhealthy obese (MUHO) phenotypes; NS (nonsignificant); *Significant (p<0.05); **Highly Significant (p<0.001)
AST: Aspartate aminotransferase; ALT: Alanine aminotransferase; GGT: Gamma glutamyltransferase; HDL-C: High density lipoprotein cholesterol; VLDL-C: Very low density lipoprotein cholesterol; TC: Total cholesterol; LDL-C: Low density lipoprotein cholesterol; TG: Triglycerides; NS: Nonsignificant; *Significant (p<0.05); **Highly Significant (p<0.001)