The relationship between periodontal infection and systemic diseases is well documented. The systemic inflammatory burden generated by a systemic condition may increase an individuals’ susceptibility to local periodontal inflammation [3]. The neutrophils or Polymorphonuclear leukocyte (PMN) are the sentinels of inflammation and highly specialised for their primary function of phagocytosis and destruction of microorganisms [4]. MPO is considered as a marker of neutrophil activation and degranulation [5]. Hence, the MPO levels in the local periodontal tissues can be suggestive of the link to the systemic health in diabetic patients [6].
Acute inflammation is a protective response whereas chronic inflammation is destructive in nature and one such chronic disease is periodontitis. Oxidative stress plays a central role in wide range of chronic inflammatory diseases and is thought to be a key driver of chronic inflammation [7].
Oxidative stress is a term used to describe the imbalance between the production as well as the manifestation of ROS in body [8]. When free radical production exceeds the body’s ability to neutralise them, oxidative stress occurs. Either decrease in the production of antioxidants; or excessive production of free radicals may lead to the imbalance [9].
Oxidative stress is also associated with diabetes. Damage of cellular organelles and enzymes can be caused by increased levels of free radicals and at the same time decline of antioxidant defence mechanisms leading to increased lipid peroxidation and development of insulin resistance in diabetic patients with chronic periodontitis which ultimately results in poor glycaemic control and worsening of periodontal tissues health [10].
Various treatment modalities have been implemented to decrease the oxidative stress in diabetes and in periodontitis respectively but so far [11,12], no studies have been reported which uses an exogenous antioxidant as an intervention in type 2 diabetic patients with periodontitis.
GSE, is one such protective, exogenous antioxidant which has anti-inflammatory, antithrombogenic and anticarcinogenic property [13,14]. Various published studies have stated the role of GSE as an anti-inflammatory agent [15,16].
Treatment with this propriety nutraceutical appeared to offer patients a noninvasive, systemic, adjunctive protocol to potentiate in office therapies [15,16].
Thus, the aim of the current study was to evaluate the antioxidant property of grape seed supplement as an adjunct to scaling and root planing on oxidative stress, inflammatory status and glycaemic control in type 2 diabetic patients with chronic periodontitis.
Materials and Methods
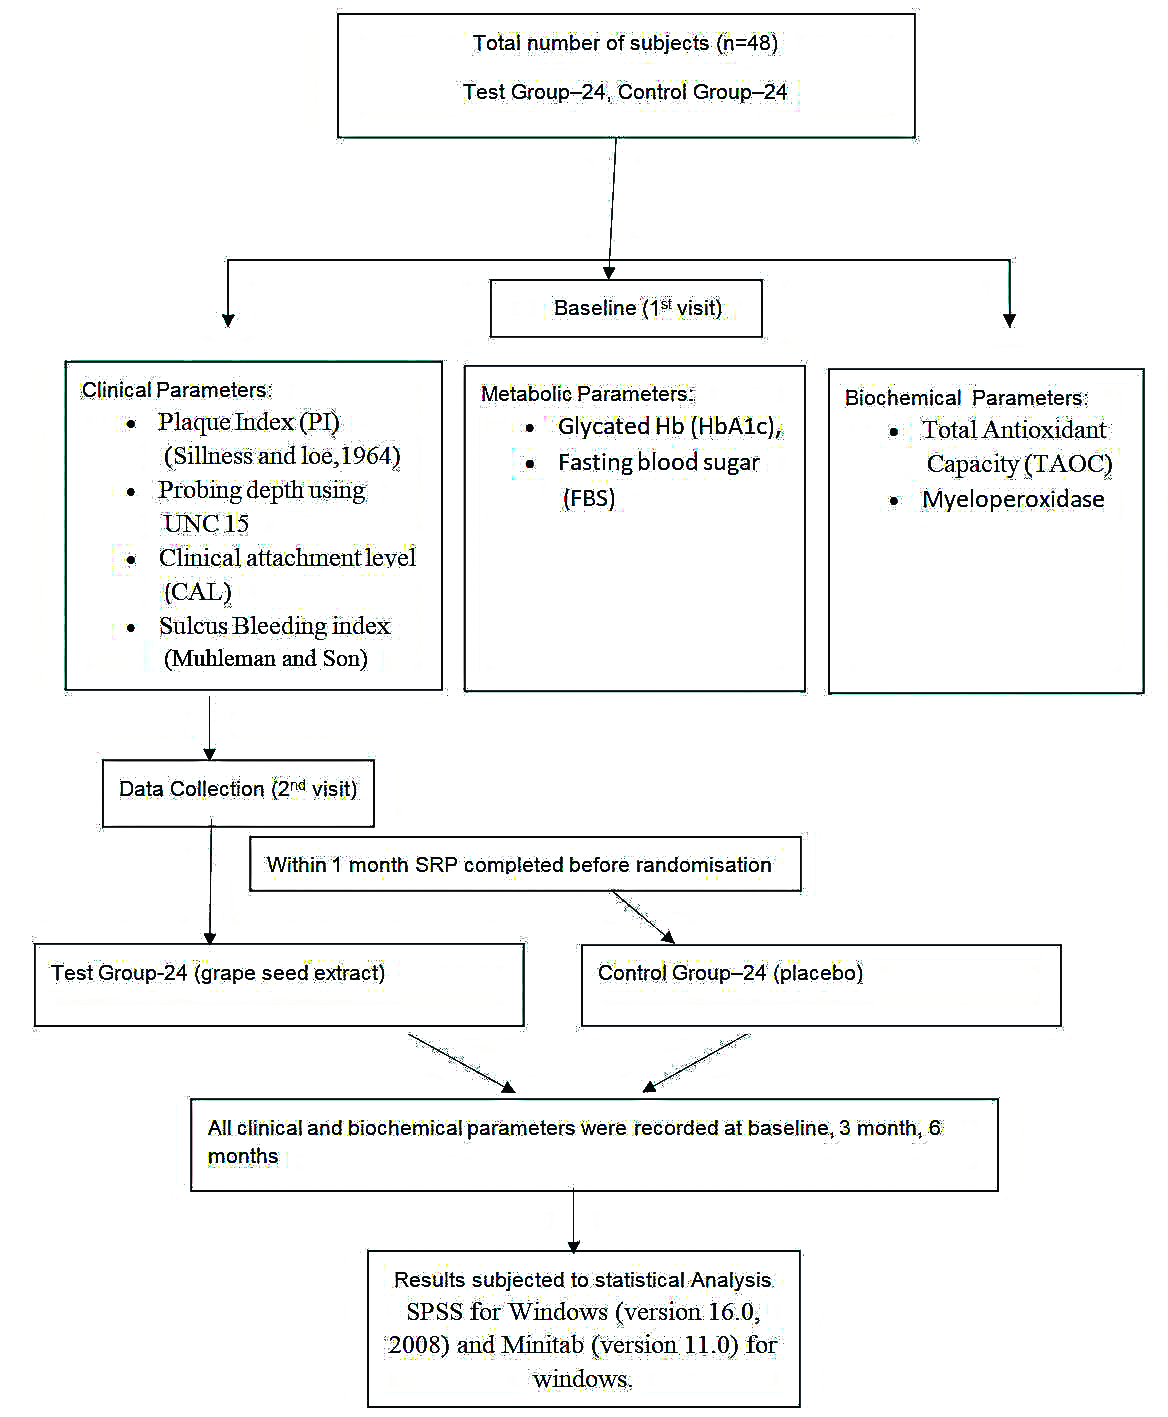
The study was a double blind randomised controlled parallel clinical trial to evaluate the oxidative, inflammatory and glycaemic status in type 2 diabetes mellitus patients with chronic periodontitis with or without GSE supplement. The patients were selected from the Outpatient Department of Periodontology, JSS Dental College and Hospital and Department of Medicine, JSS Medical Hospital, Mysore and the duration of the study was 10 months from January 2014 to October 2014. The study protocol was approved by the Institutional Review Board Ethical Committee governing the use of human subjects in clinical experimentation, JSS Dental College and Hospital, Mysore (JSS/DC/ETHICAL/2011-12). The investigation was performed in accordance to the requirements of the Declaration of Helinski, 18th World Assembly in 1964 and revised in Edinburgh (2000). Informed consent was obtained from all the participants.
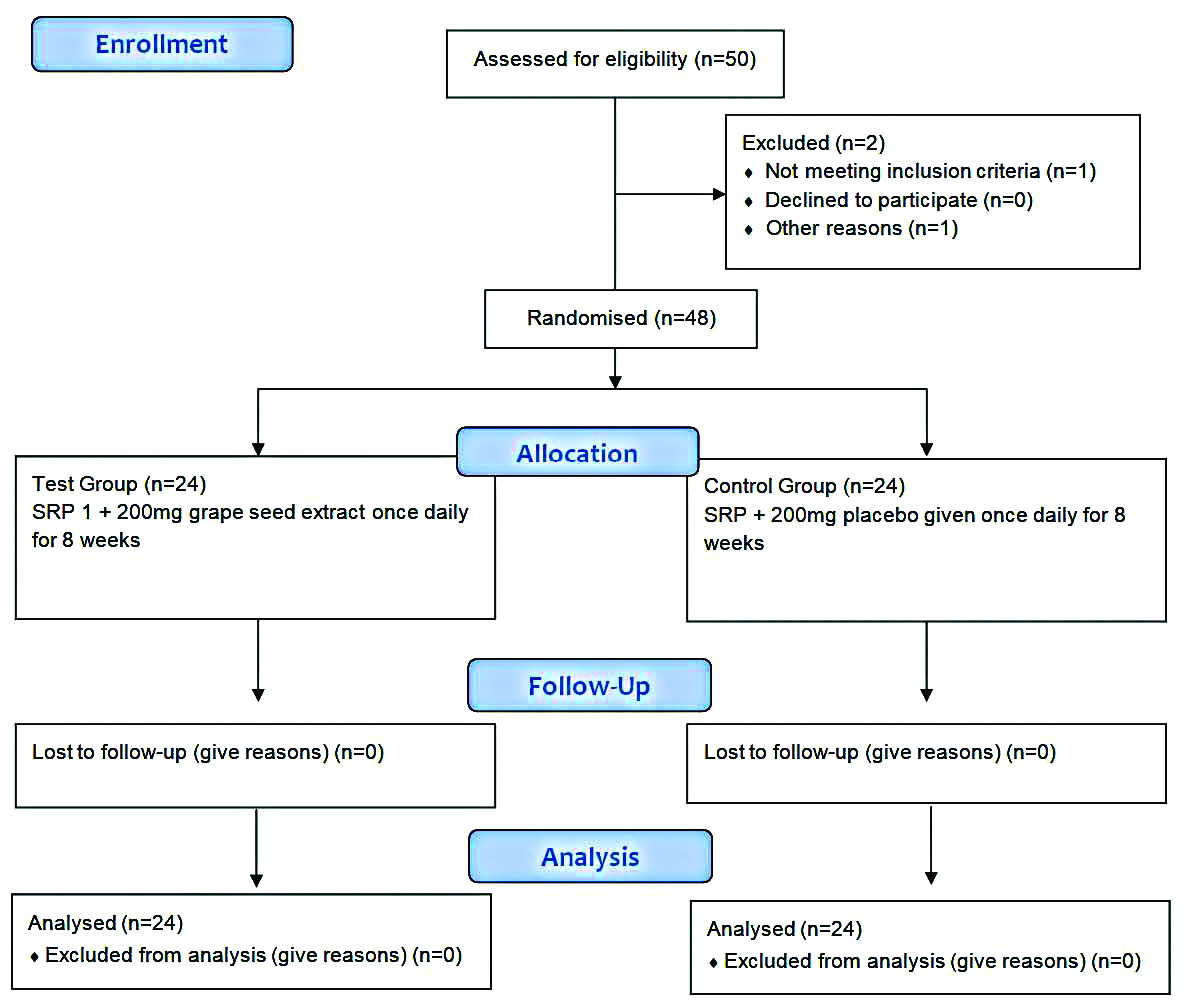
A total of 48 diabetic patients with chronic periodontitis by purposive sampling were selected for the study. From the power analysis, it was shown that to achieve 80% power with a confidence limit of 95% and detect mean differences of clinical parameters between groups, 24 samples in each group were required [Table/Fig-1].
Inclusion criteria: The patients were included between 30-60 years with a body mass index of 18.5-30 kg/m2 and a glycated haemoglobin in the range 6%-8% coinciding with mean plasma glucose in the range 135-205 mg/dL. Patients suffering from Type 2 diabetes receiving oral hypoglycaemic drugs only with duration of diabetes for more than 5 years but less than 10 years with Chronic generalised periodontitis having probing pocket depth ≥5 mm were included in the study [17,18].
Exclusion criteria: Patients were excluded if they gave history of allergy to grapes, diabetic patients with any other complications of diabetes such as cardiovascular diseases e.g., coronary heart disease, diabetic nephropathy, pregnant and lactating mothers, smokers, patients receiving any anticoagulant drugs, those receiving any antioxidant drugs in the past three months or receiving treatment for any other condition.
Prior to randomisation, baseline measurements were taken and the patients fulfilling the inclusion criteria underwent scaling and root planing and were randomised by computer generated randomisation using Random Allocation Software by the statistician into two groups of 24 patients each. Test group received 200 mg of capsule containing GSE (formulation: 95% GSE powder, 1.92% lost on drying, 1.65% ash) ([Table/Fig-2]: I Dreamz pharma, Bengaluru) which were consumed orally whereas the control group received a capsule without the active ingredient, also taken orally. These capsules were taken once daily for a period of eight weeks. Both the capsules were identical in formulation, shape, size, weight, texture and packing which were disclosed after the completion of the study. The participants and operator were not aware of the treatment provided hence, it was a double blinded study.
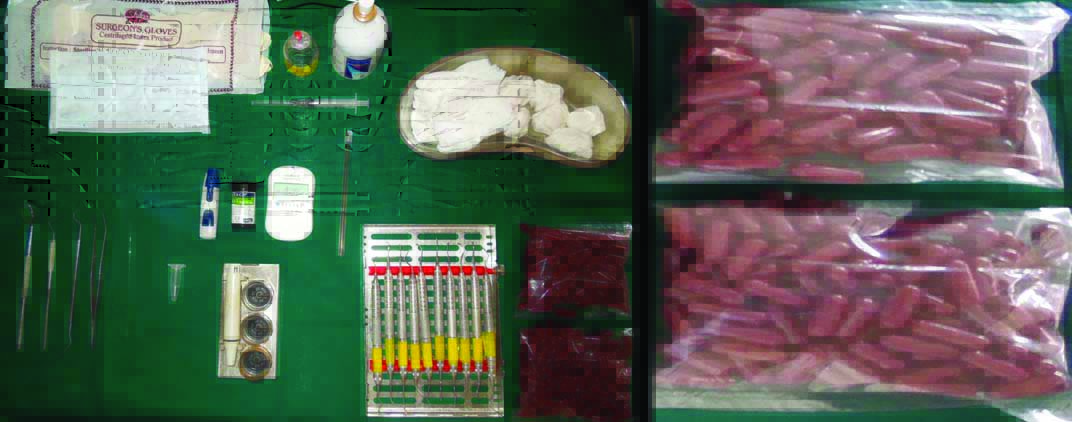
Armamentarium; Packets containing grape seed formulation and placebo capsules (I Dreamz pharma, Bengaluru).
One trained and calibrated examiner blinded to the study conducted all clinical measurements such as PI [19], PPD, CAL, SBI [20]; metabolic parameters such as HbA1c, FBS; also, inflammatory marker MPO was estimated from GCF and TAOC were recorded at baseline, 3 months and 6 months. Examiner provided the medications according to randomisation [Table/Fig-3]. Data analysis was performed to determine the intraexaminer reliability, using kappa statistics for the categorical clinical measurement variables such as PPD and CAL. The examiner’s measurements were considered calibrated, if the standard error was ≤0.8 and a k-value ranged between 0.8 and 0.95.
Flow chart showing study design.
Total Antioxidant Capacity Assessment (TAOC)
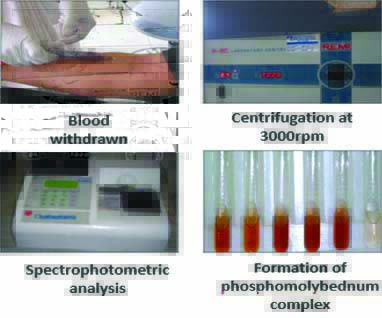
A 5 mL of venous blood sample was collected from ante-cubital vein by trained nurse and the sample was centrifuged at 3000 rpm for 15 minutes and the supernatant serum was collected. The serum was stored with tris carbonate buffer in freezer at -4°c. It was sent for spectrophotometric analysis to Maratha Mandal Dental College, Belgaum within a month of collection.
Principle: The total antioxidant assay is based on reduction of Phosphate-Molybdenum (VI) to Phosphate-Molybdenum (V). By using the formula: Final absorbance=Absorbance of sample -Absorbance of Blank-Absorbance of Extract, the reducing capacity of extract was calculated [21,22].
Procedure: An aliquot of 0.1 mL of stored serum containing a reducing species (in water, methanol, ethanol, dimethyl sulfoxide) was combined in an Eppendorf tube with 1 mL of reagent solution (sulfuric acid 0.6 M, sodium phosphate 28 mM, and ammonium molybdate 4 mM). The tubes were capped and incubated at 95°c for 90 minutes in a thermal block. The absorbance was measured at 695 nm of aqueous solution of each against a blank, after the samples were cooled to room temperature [Table/Fig-4].
Estimation of Total Antioxidant Capacity (TAOC).
Estimation of Myeloperoxidase (MPO)
Procedure: GCF Collection: Subjects selected were seated comfortably in an upright position in the dental chair with a proper lighting condition. The patients were asked to gargle vigorously with a glass of water to cleanse the teeth of loosely adherent debris. The selected site was then isolated with cotton and dried. Supragingival plaque and calculus obstructing access to the entrance of the crevice was carefully removed using a curette [23].
Micro capillary pipettes were placed at the opening of the gingival crevice and fluid of 2-3 μmL was collected [Table/Fig-5].
Estimation of myeloperoxidase.
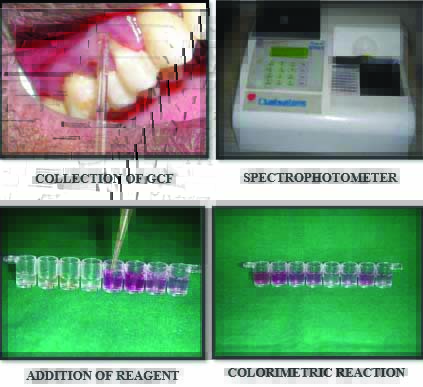
The collected GCF was immediately transferred into sterile vials with transport media (phosphate buffer saline) and transported in ice packs to a freezer and stored at -70°c until further analysis [24]. The biochemical analysis was done in Maratha Mandal Dental College, Belgaum.
Myeloperoxidase (MPO) test
Preparation of 0.1 M citric acid buffer: 50 mL of distilled water was taken and 16 mL of solution A that is citric acid buffer and 34 mL of solution B that is sodium citrate was added to it. A 125 mL of triton X 100 was mixed in citric acid buffer.
Preparation of 0.1 mM H2O2: 10 mL of citric acid buffer was taken in a test tube and 34 μL of H2O2 was added to it.
Preparation of 0.8 mM dianisidine substrate: 25 mg of dianisidine powder was mixed in 100 mL of distilled water [25].
MPO activity was measured using o-dianisidine and hydrogen peroxide (H2O2), spectrophotometrically. MPO catalyses the oxidation of o-dianisidine yielding a brown colored product, with maximum absorbance at 470 nm in the presence of H2O2, an oxidising agent [26].
Statistical Analysis
All the statistical methods were carried out through the SPSS for Windows (version 16.0, 2008) and Minitab (version 11.0) for windows. The descriptive statistics mean and standard deviation were calculated. Within the group comparison for PI, SBI, PPD, CAL, HbA1c, FBS, TAOC, MPO levels at baseline, 3 months, 6 months was carried out using paired t-test. Intergroup comparisons for PI, SBI, PPD, CAL, HbA1c, FBS, TAOC, MPO levels for both test and control group were analysed by student’s t-test. The p-value ≤0.05 was considered to be statistically significant.
Results
I. Analysis of Clinical Parameters
Plaque Index (PI), Sulcular bleeding index, Probing depth, Clinical Attachment Level (CAL): Intergroup comparison of clinical parameters is shown in [Table/Fig-6]. At baseline, there was no significant difference in PI, SBI, CAL, PD between the test and control group. A statistically significant difference was noted in between test and the control groups at 3 months in PI scores with p-value=0.014. A statistically significant difference was noted in between test and the control groups at 3 months in SBI scores with p-value=0.017.
Intergroup comparison of mean scores of PI, SBI, PD, CAL between test and control group at baseline, 3 months and 6 months using independent sample t-test.
| Parameter | Group | Baseline Mean±SD | p-value | 3 months | 6 months |
|---|
| Mean±SD | p-value | Mean±SD | p-value |
|---|
| PI | Test | 5.7125±0.71072 | 0.66 | 3.3542±0.67436 | 0.014* | 3.6542±0.74131 | 0.786 |
| Control | 5.8±0.68474 | 3.8208±0.58828 | 3.5958±0.73985 |
| SBI | Test | 5.7121±0.82 | 0.88 | 3.2542±0.44 | 0.017* | 3.5875±0.73 | 1 |
| Control | 5.7467±0.76 | 3.6679±0.69 | 3.5875±0.73 |
| PD | Test | 1.5267±0.73 | 1 | 1.0983±0.43 | 0.65 | 1.0461±0.42 | 0.89 |
| Control | 1.5267±0.73 | 1.1650±0.56 | 1.0433±0.46 |
| CAL | Test | 5.4025±0.68 | 1 | 4.9875±0.67 | 0.40 | 4.9958±0.52 | 0.48 |
| Control | 5.4025±0.68 | 4.8292±0.61 | 4.8958±0.46 |
(*Significance at p-value ≤0.05); PI: Plaque index; PD: Probing depth; CAL: Clinical attachment level; SBI: Sulcular bleeding index; SD: Standard deviation
At 6 months, there was no significant difference in PI, SBI, CAL, PD between the test and control group.
Intragroup comparison of clinical parameters is shown in [Table/Fig-7,8]. A statistically significant improvement was noted from baseline to 3 months and from baseline to 6 months in both groups (test and control) with a p-value ≤0.05 for all the clinical parameters. From 3 months to 6 months statistically significant difference was seen only in the PPD in control group (p=0.002) and in the PPD (p=0.015), SBI in test group (p=0.018).
Intragroup comparison of mean scores for control group of PI, SBI, PD, CAL at various timelines using paired t-test.
| Parameters and visits | Paired differences | p-value |
|---|
| Mean | SD |
|---|
| PI | Baseline to 3 months | 1.97917 | 0.98910 | <0.01* |
| Baseline to 6 months | 2.20417 | 0.79267 | <0.01* |
| 3 months to 6 months | 0.22500 | 1.02882 | 0.295 |
| PD | Baseline to 3 months | 0.36167 | 0.33141 | <0.01* |
| Baseline to 6 months | 0.48333 | 0.40567 | <0.01* |
| 3 months to 6 months | 0.12167 | 0.16820 | 0.002* |
| CAL | Baseline to 3 months | 0.57333 | 0.30364 | <0.01* |
| Baseline to 6 months | 0.50667 | 0.57968 | <0.01* |
| 3 months to 6 months | -0.06667 | 0.47883 | 0.502 |
| SBI | Baseline to 3 months | 2.07875 | 0.74403 | <0.01* |
| Baseline to 6 months | 2.15917 | 0.83307 | <0.01* |
| 3 months to 6 months | 0.08042 | 0.42497 | 0.364 |
(*Significance at p-value ≤0.05); PI: Plaque index; PD: Probing depth: CAL: Clinical attachment level; SBI: Sulcular bleeding index; SD: Standard deviation
Intragroup comparison of mean scores for test group of PI, SBI, PD, CAL at various timelines using paired t test.
| Parameters and visits | Paired differences | p-value |
|---|
| Mean | SD |
|---|
| PI | Baseline to 3 months | 2.35833 | 0.71864 | <0.01* |
| Baseline to 6 months | 2.05833 | 0.73461 | <0.01* |
| 3 months to 6 months | -0.30000 | 0.67373 | 0.040 |
| PD | Baseline to 3 months | 0.40348 | 0.41567 | <0.01* |
| Baseline to 6 months | 0.46583 | 0.41528 | <0.01* |
| 3 months to 6 months | 0.05217 | 0.09443 | 0.015* |
| CAL | Baseline to 3 months | 0.41500 | 0.25675 | <0.01* |
| Baseline to 6 months | 0.40667 | 0.39235 | <0.01* |
| 3 months to 6 months | -0.00833 | 0.34631 | 0.907 |
| SBI | Baseline to 3 months | 2.45792 | 0.69316 | <0.01* |
| Baseline to 6 months | 2.12458 | 0.85630 | <0.01* |
| 3 months to 6 months | -0.33333 | 0.63975 | 0.018* |
(*Significance at p-value ≤0.05); PI: Plaque Index; PD: Probing depth: CAL: Clinical attachment level; SBI: Sulcular bleeding index; SD: Standard deviation
II. Analysis of Metabolic Parameters
Glycated Haemoglobin (HbA1c), Fasting Blood sugar (FBS): Intergroup comparison of metabolic parameters is shown in [Table/Fig-9]. At baseline and 6 months, there was no significant difference in HbA1c, FBS scores between the test and control group. Whereas, a significant difference was seen in FBS score at 3 months (p-value=0.02) but not in the HbA1c scores at 3 months.
Intergroup comparison of mean scores of HbA1c and FBS between test and control group at baseline, 3 months and 6 months using independent sample t-test.
| Parameter | Group | Baseline Mean±SD | p-value | 3 months | 6 months |
|---|
| Mean±SD | p-value | Mean±SD | p-value |
|---|
| HbA1c | Test | 7.3333±0.73 | 0.85 | 6.3750±0.51 | 0.08 | 6.6833±0.59 | 0.63 |
| Control | 7.2958±0.71 | 6.8083±0.55 | 6.7625±0.54 |
| FBS | Test | 155.98±20.1 | 1 | 136.8±11.8 | 0.02* | 149.5±19.5 | 1 |
| Control | 155.98±20.1 | 145.8±14.1 | 149.5±19.5 |
(*Significance at p-value ≤0.05); HbA1c: Glycated Hb; FBS: Fasting blood sugar; SD: Standard deviation
Intragroup comparison of metabolic parameters is shown in [Table/Fig-10,11]. There was a statistically significant improvement in HbA1c scores from baseline to 3 months (0.48±0.31) and baseline to 6 months (0.533±0.36) in control; (0.95±0.53) from baseline to 3 months and (0.65±0.40) from baseline to 6 months in test (p<0.01) and also a significant improvement was noted in FBS scores at 3 months (10.1±11.52) (19.1±16.16) in control and test group, respectively compared to baseline.
Intragroup comparison of mean scores for control group of HbA1c, FBS, TAOC, MPO at various timelines using paired t-test.
| Parameters and visits | Paired differences | p-value |
|---|
| Mean | SD |
|---|
| HbA1c | Baseline to 3 months | 0.48750 | 0.31390 | <0.01* |
| Baseline to 6 months | 0.53333 | 0.36076 | <0.01* |
| 3 months to 6 months | 0.04583 | 0.12151 | 0.07 |
| FBS | Baseline to 3 months | 10.15000 | 11.52498 | <0.01* |
| Baseline to 6 months | 6.40000 | 19.63900 | 0.12 |
| 3 months to 6 months | -3.75000 | 19.22238 | 0.34 |
| TAOC | Baseline to 3 months | -15.85833 | 3.65655 | <0.01* |
| Baseline to 6 months | -16.50833 | 3.53072 | <0.01* |
| 3 months to 6 months | -0.65000 | 4.24653 | 0.46 |
| MPO | Baseline to 3 months | 1.85000 | 0.68525 | <0.01* |
| Baseline to 6 months | 2.07083 | 0.62726 | <0.01* |
| 3 months to 6 months | 0.22083 | 0.34764 | 0.005 |
(*Significance at p-value ≤0.05); HbA1c: Glycated Hb; FBS: Fasting blood sugar; SD: Standard deviation; TAOC: Total antioxidant capacity; MPO: Myeloperoxidase
Intragroup comparison of mean scores for test group of HbA1c, FBS, TAOC, MPO at various timelines using paired t-test.
| Parameters and visits | Paired differences | p-value |
|---|
| Mean | SD |
|---|
| HbA1c | Baseline to 3 months | 0.95833 | 0.53966 | <0.01* |
| Baseline to 6 months | 0.65000 | 0.40000 | <0.01* |
| 3 months to 6 months | -0.30833 | 0.50469 | 0.006 |
| FBS | Baseline to 3 months | 19.10833 | 16.16523 | <0.01* |
| Baseline to 6 months | 6.40000 | 19.63900 | 0.124 |
| 3 months to 6 months | -12.70833 | 19.76488 | 0.004 |
| TAOC | Baseline to 3 months | -33.64167 | 3.11852 | <0.01* |
| Baseline to 6 months | -18.95000 | 2.88127 | <0.01* |
| 3 months to 6 months | 14.69167 | 2.57765 | <0.01* |
| MPO | Baseline to 3 months | 2.38750 | 0.61596 | <0.01* |
| Baseline to 6 months | 2.42083 | 0.66983 | <0.01* |
| 3 months to 6 months | 0.03333 | 0.34347 | 0.63 |
(*Significance at p-value ≤0.05); HbA1c: Glycated Hb; FBS: Fasting blood sugar; SD: Standard deviation; TAOC: Total antioxidant capacity; MPO: Myeloperoxidase
III. Analysis of Biochemical Parameters
Total Antioxidant Capacity (TAOC), Myeloperoxidase (MPO): Intragroup comparison of biochemical parameters is shown in [Table/Fig-10,11]. There was a statistically significant improvement in TAOC and MPO scores at 3 months and 6 months in both groups (test and control) compared to baseline scores (p<0.05) and also a significant improvement was noted in TAOC level in the test group at 6 months compared to 3 months (p<0.01).
Intergroup comparison of biochemical parameters is shown in [Table/Fig-12]. There was a significant difference in TAOC, MPO scores between the test and control group at 3 months and 6 months with p-value <0.05. Whereas no statistically significant difference was noted in TAOC and MPO scores between both the groups at baseline.
Intergroup comparison of mean scores of TAOC and MPO between test and control group at baseline, 3 months and 6 months using independent sample t-test.
| Parameter | Group | Baseline Mean±SD | p-value | 3 months | 6 months |
|---|
| Mean±SD | p-value | Mean±SD | p-value |
|---|
| TAOC | Test | 23.4±2.64 | 0.89 | 57.1±2.022 | 0.001* | 42.41±2.12 | 0.002* |
| Control | 23.566±2.66 | 39.42±3.05 | 40.07±2.70 |
| MPO | Test | 4.412±0.64 | 0.65 | 2.025±0.24 | 0.003* | 1.991±0.212 | 0.012* |
| Control | 4.32±0.63 | 2.479±0.670 | 2.25±0.451 |
(*Significance at p-value ≤0.05); SD: Standard deviation; TAOC: Total antioxidant capacity; MPO: Myeloperoxidase
Discussion
This was a double blind randomised controlled trial to evaluate the oxidative, inflammatory and glycaemic status in Type 2 Diabetes mellitus patient with chronic periodontitis with or without GSE formulation. Oxidative stress plays a key role in modulating the damage in periodontal tissues and is the underpin mechanism in the hyperglycaemic status in diabetes and its complications [27]. Periodontitis is regarded as the sixth complication of diabetes and both the chronic disorders are related to each other by the mechanistic link of inflammation [28]. Thus, it was hypothesised that the use of grape seed formulation which is a powerful antioxidant will combat the oxidative stress, thereby increasing the TAOC in the body, which in turn will reduce the inflammation as measured by the MPO levels along with the glycaemic status of the diabetic patients which will improve periodontal health, when used as an adjunct to scaling and root planing than conventional therapy alone [29,30].
In present study, the grape seed formulation was given after four weeks of SRP which is to ensure that the pockets are adequately healed. This allows the patient sufficient practice with oral hygiene skills to achieve maximum improvement [31].
However, antidiabetic drugs like metformin can themselves act as antioxidants which can also influence the result to be uncertain. It has been seen by studies that administration of metformin ameliorates the antioxidant status [11].
Oxidative stress was measured by TAOC. This parameter provides information on the combined effect of the individual antioxidants and may account for the influence of antioxidant substances as yet undiscovered or those that are technically difficult to analyse [13]. Moreover, the decreased TAOC in the peripheral blood in the chronic periodontitis subjects with Type 2 Diabetes may be one of the pathogenic mechanisms underlying the links between periodontal disease and diabetes [12,32].
In this study, TAOC was highly significant in the test group than the control group at 3 and 6 months. The highly significant increase is based on the rationale upon the substantial literature base concerning the efficacy of antioxidant micronutrients in reducing extracellular oxidative stress [32]. However, there can be a number of reasons for the difference in the TAOC value. This can be explained by tendency for recalcitrant disease to develop at this stage [33,34]. Moreover, the water soluble nature of antioxidants decreases the bioavailability in the body.
The metabolic parameter was measured by the glycated haemoglobin. The American Diabetes Association guidelines advices that the glycated haemoglobin test should be performed twice a year in diabetic patients having stable glycaemic levels and quarterly in diabetic patients that are not meeting glycaemic goals [35]. Thus, in the present study the glycated haemoglobin was measured at an interval of 3 months each to see the effect of the intervention therapy.
Glycated haemoglobin showed significant improvement in both groups from baseline to 6 months. The overall improvement can be attributed to the nonsurgical therapy performed which has shown to improve the glycaemic control which is substantiated by ample meta-analysis [35].
In present study, the body mass index was standardised and patients whose BMI was 18.5-30 kg/m2. Overweight is commonly defined as a BMI 25-30 kg/m2 and obesity as a BMI >30 kg/m2. Obesity increases the risk of type 2 diabetes and its macrovascular complications, i.e., cardiovascular, cerebrovascular and peripheral vascular diseases. An increase in BMI also correlated significantly with deterioration of HbA1c. Thus, in the present study this range was included to ensure that the patients we have included are diabetics without any other systemic complications [36].
Inflammation is the underlying key to both diabetes and periodontitis. The persisting local inflammation in the periodontal tissues initiates a cascade of events which finally leads to insulin resistance in diabetes. Hence, the MPO levels in the local periodontal tissues can be suggestive of the link to the systemic health in diabetic patients [10].
In the present study, MPO levels showed statistically significant reduction in test group having mean value of 4.412±0.64 at baseline to 1.991±0.212 at 6 months as well as in the control group with a mean value of 4.32±0.63 at baseline to 2.25±0.451 at 6 months. The decrease in both groups is in consistent with the study in 2008 in type 2 diabetic patients wherein MPO levels decreased after nonsurgical therapy depicting the reduction of inflammation after scaling and root planing [10].
In this study, it was found that the grape seed formulation as an adjunct has not shown the effects as desired on the clinical parameters. On the other hand, a significant decrease in inflammation was noticed as evident from the MPO levels but it failed to show the equivalent effect on the clinical parameters. There are no studies at present to compare the intervention of GSE as an adjunct to SRP on MPO levels as well as clinical parameters. Hence, there is lack of literature to correlate the MPO levels with clinical parameters.
Limitation(s)
The drug was administered systemically hence it could have failed to reach the adequate concentration in the periodontal tissues to show its required effects. Also, the dosage of the antioxidants used might be one of the confounding factors in the present study which might not be sufficient to reach the target tissues to cause the desired effects. Thus, further research to know the exact dosage and duration is required to establish its role as an adjunct. Anti-diabetic drugs like metformin can act as antioxidants which can also influence the result to certain extent. It has been seen by studies that administration of metformin ameliorates the antioxidant status. The present study have measured the TAOC than the biomarkers of lipid peroxidation, DNA damage and protein damage which are more specific biomarkers of oxidative stress and implies if the damage is occurring intracellularly or extracellularly. Another limitation of the study is that the SRP was carried out after the baseline measurements which may have interfered with the accurate assessment of improvement in clinical parameters.
Conclusion(s)
This study shows a promising result in using grape seed formulation as an adjunct to scaling and root planing to reduce the oxidative stress, decreasing the inflammation and achieving the glycaemic control in diabetic patients with chronic periodontitis. Currently, few studies are available to extrapolate the therapeutic effects of antioxidants in dental practice. Although there have been promising results, overall benefit: risk ratio should be considered. Large scale and unbiased studies addressing the safety and standardisation issue are needed to prove its efficacy as an adjunct to conventional therapy.
(*Significance at p-value ≤0.05); PI: Plaque index; PD: Probing depth; CAL: Clinical attachment level; SBI: Sulcular bleeding index; SD: Standard deviation
(*Significance at p-value ≤0.05); PI: Plaque index; PD: Probing depth: CAL: Clinical attachment level; SBI: Sulcular bleeding index; SD: Standard deviation
(*Significance at p-value ≤0.05); PI: Plaque Index; PD: Probing depth: CAL: Clinical attachment level; SBI: Sulcular bleeding index; SD: Standard deviation
(*Significance at p-value ≤0.05); HbA1c: Glycated Hb; FBS: Fasting blood sugar; SD: Standard deviation
(*Significance at p-value ≤0.05); HbA1c: Glycated Hb; FBS: Fasting blood sugar; SD: Standard deviation; TAOC: Total antioxidant capacity; MPO: Myeloperoxidase
(*Significance at p-value ≤0.05); HbA1c: Glycated Hb; FBS: Fasting blood sugar; SD: Standard deviation; TAOC: Total antioxidant capacity; MPO: Myeloperoxidase
(*Significance at p-value ≤0.05); SD: Standard deviation; TAOC: Total antioxidant capacity; MPO: Myeloperoxidase