The NAFLD represents a continuum from simple steatosis to Non-Alcoholic Steatohepatitis (NASH) and cirrhosis [1]. NAFLD and T2DM are common conditions that often co-exist and can act synergistically to cause adverse effects. The presence of both NAFLD and T2DM increases the likelihood of developing diabetic complications [2]. Fatty liver was long considered the consequence of insulin resistance [3] but recent evidence has shown that steatosis precedes the diagnosis of metabolic syndrome and diabetes, concluding that there exists a bidirectional relationship between the two conditions [4].
Screening for NAFLD using fibroscan may, however identify patients with NAFLD-related cirrhosis and its progression to hepatocellular carcinoma. It will also help in the identification and management of its sequelae, such as varicose veins [5]. There are no NAFLD test recommendations for people with diabetes. Several non-invasive methods for identifying patients with NASH or fibrosis have been proposed but validated decisional algorithms adequate for clinical practice are still lacking. Current guidelines have contradictory NAFLD test criteria for patients with diabetes due to data shortages [6]. Ultrasonography, the most commonly used method of assessment of NAFLD in India, is associated with false positives and operator associated errors. Abdominal ultrasound has intra-operator variability, and cannot detect less than 33% of steatosis [7]. The other modalities used to screen for NAFLD like NAFLD fibrosis scores and Fib 4 scores by measuring AST, ALT and platelet counts, are associated with indeterminate range scores in at least 30% of cases, further liver enzymes, such as Alanine Transaminase (ALT), have a poor correlation with the histological severity [8]. Diagnostic performance may vary for proprietary fibrosis markers between diabetic and non-diabetic cohorts [9]. Liver biopsy is the gold-standard for direct diagnosis of NASH and evaluation of inflammation/fibrosis, however, its use is limited by invasiveness, cost and sampling error.
In recent years, transient elastography and LSM measurements have emerged as one of the best modalities to screen NAFLD in people with diabetes. Transient elastography has a high negative predictive value and modest positive predictive value, and is useful to exclude advanced fibrosis as a screening test. Fibroscan can be used to quickly measure liver fat and fibrosis [10].
In this study, Fibroscans were performed by an experienced operator performing more than 500 scans per month. Operator experience is of utmost importance in achieving successful and reliable LSM [11]. The high cost of acquisition, single manufacturer and limited use of screening for a single disease entity, are the deterrents to universal use of fibroscan.
There are very few studies from India with regards to the use of LSM by fibroscan for NAFLD screening that too with small sample sizes [12-15]. The awareness of NAFLD is low among general practitioners [16], and it is considered the prerogative of a hepatologist, though NAFLD is a metabolic physician’s domain. The current study was an attempt to put NAFLD in the right perspective. The goal of the study was to screen people with T2DM for NAFLD, to see the prevalence and to explore factors contributing to NAFLD and advanced fibrosis by LSM studies using fibroscan.
Materials and Methods
It was a prospective cross-sectional study, constituting the participants with known T2DM who visited the Jai Clinic and Diabetes Care Centre, a tertiary diabetes care center in Lucknow, Uttar Pradesh, India. The study was conducted between July 2019 and November 2019. A written informed consent was taken from all participants before enrollment. The study was duly approved by the ethics committee (IEC/04/10/19).
Sample size calculation: The prevalence of NAFLD in past studies ranged from 3% to 35%, for the present study, 25% prevalence of NAFLD was estimated on the basis of a pilot study. With an expected prevalence of NAFLD of 25% in people with T2DM, a 5% absolute error and α error of 5%, the sample size of 288 was calculated [17].
Inclusion criteria: Subjects more than 18 years of age, with known T2DM, diagnosed as per American Diabetes Association criteria i.e., fasting blood sugar of 126 mg% or more after 8 hours or more of fasting and post prandial blood glucose of 200mg% or more, two hours after ingestion of 75 gm anhydrous glucose dissolved in water, who visited the clinic during the study period were included in the study.
Exclusion criteria: Pregnant women, individuals with a history of acute or chronic liver disease (including acute hepatitis of any cause, viral hepatitis, autoimmune hepatitis, haemochromatosis, Wilson disease, alpha 1 antitrypsin deficiency or any previous disease presenting with jaundice), subjects with daily alcohol consumption of more than 20 gm/day (two 30 ml drinks) were excluded from the study. Patients with other chronic diseases, including rheumatoid arthritis, serious osteoarthritis, symptomatic heart failure, T1DM, myocardial infarction within the last 6 months, acromegaly, clinically obvious hypothyroidism, hypogonadism, chronic obstructive airway disease, nephrotic syndrome and chronic kidney disease (stage 3 or more) were also excluded. In addition, patients with malignancies and BMI over 40, those on steroid use for long periods of time were also excluded from the study.
The fibroscan test and LSM measurements were done using FibroScan502 (manufacturer Echosens, Paris, France), was done in 287 people with diabetes. Patients fasted for at least 8 hours prior to measurement. The LSM score was calculated by a median of 10 variables and was considered reliable, if there were at least 10 successful acquisitions and the (Interquartile Range) IQR-to-median ratio of the 10 acquisitions was less than or equal to 0.3. The LSM cut-offs used to define advanced fibrosis and cirrhosis (M probe F3=9.6-11.4, F4 ≥11.5 kPa) were derived from previous studies [18]. Age, duration of diabetes, gender, height, weight and BMI were recorded. HbA1c measurement was done using the Alere Affinion Point of Care device (manufacturer Abbot India).
Statistical Analysis
Statistical tests were performed using Windows based Statistical Package for Social Sciences (SPSS) (version 20.0; SPSS, Chicago, IL). Nonparametric correlation was done using Spearman’s rho, for the data that failed the normality test. These analyses were done at 99.99% as Confidence Interval (CI).
Results
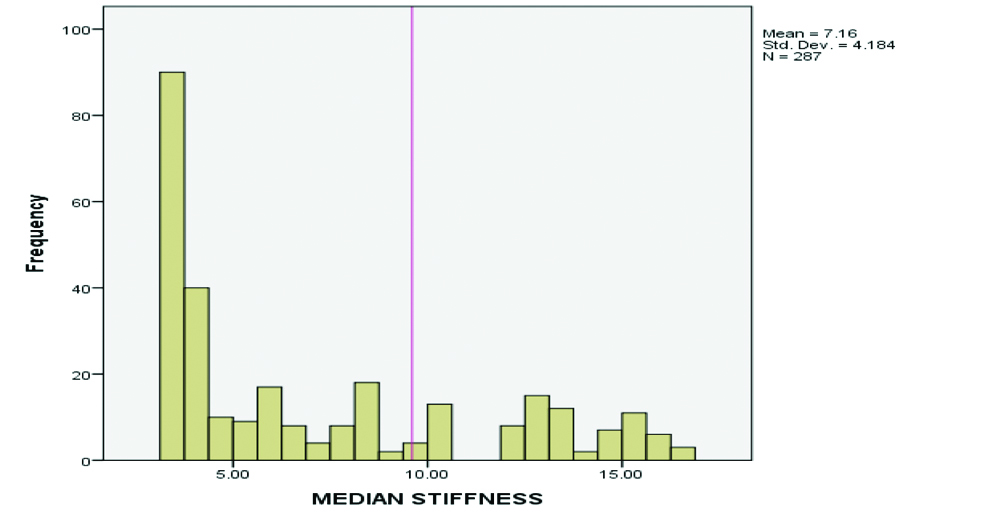
In the present study, out of 287 subjects 175 (61%) were males and 112 (39%) were females, with a mean age of 46.96±15.70 years. The median value of LSM by M probe was 7.16±4.19 kPa [Table/Fig-1].
| Variables | Minimum | Maximum | Mean |
|---|
| Age (Years) | 18 | 91 | 46.96±15.70 |
| Duration of diabetes (Years) | 1 | 17 | 10.98±3.45 |
| HbA1c (%) | 5.6 | 12.9 | 9.28±2.25 |
| BMI (Kg/m2) | 17.6 | 39.2 | 27.03±2.75 |
| LSM (kPa) | 3.2 | 16.6 | 7.16±4.19 |
HbA1c: Glycated haemoglobin; BMI: Body mass index; LSM: Liver stiffness measurement
Most of the participants were either overweight (63%) or obese (30%) [Table/Fig-2]. The LSM of 9.6 or above was taken as a cut-off for advanced fibrosis [Table/Fig-3]. The total subjects identified with advanced fibrosis were 78 (27.2%). Out of these, 14 subjects (4.9%) had LSM values between 9.6-11.4 kPa (F3), and 64 subjects (22.3%) had advanced fibrosis with LSM values of >11.5 kPa or more (F4) suggestive of cirrhosis [Table/Fig-4]. The LSM values >9.6 kPa signifying advanced fibrosis was seen in 31 (39.8%) over weight and 47 (60.2%) obese subjects [Table/Fig-5].
| BMI interval | Frequency | Percent |
|---|
| Underweight | 1 | 0.35 |
| Normal weight | 23 | 8.01 |
| Overweight | 178 | 62.02 |
| Obesity | 85 | 29.62 |
| Total | 287 | 100 |
Distribution of LSM in study subjects.
| Frequency | Percent | Valid percent |
|---|
| F3 (LSM 9.6-11.4 kPa) | 14 | 4.9 | 17.9 |
| F4 (LSM >11.5 kPa) | 64 | 22.3 | 82.1 |
| Total | 78 | 27.2 | 100.0 |
BMI interval in subjects with advanced fibrosis (LSM >9.6 kPa).
| BMI interval | LSM >9.6 kPa (n=78) | Percent |
|---|
| Overweight (23-27.4 Kg/m2) | 31 | 39.8 |
| Obesity (>27.5 Kg/m2) | 47 | 60.2 |
Advanced fibrosis correlated positively with an increase in age, an increase in HbA1c and the duration of diabetes. With a coefficient of correlation, 0.375 advanced fibrosis (LSM >9.6) showed moderate correlation with BMI [Table/Fig-6].
Correlation table of advanced fibrosis (LSM >9.6 kPa) with age, BMI, HbA1c and duration of diabetes.
| Parameters | Correlation coefficient Spearman’s rho | p-value |
|---|
| Age and advanced fibrosis | 0.562 | <0.001 |
| BMI and advanced fibrosis | 0.375 | 0.001 |
| HbA1c and advanced fibrosis | 0.820 | <0.001 |
| Duration of diabetes and advanced fibrosis | 0.596 | <0.001 |
Bold p-values are significant
Discussion
In the current study, the prevalence of advanced fibrosis was 27.2%, further increasing age, duration of diabetes, poorer glycaemic control reflected by higher HbA1c correlated positively with advanced fibrosis. The subjects in the study were patients with diabetes with varying durations of diabetes and a higher BMI, thus having a higher metabolic burden than in a community setting. In the study, 27.2% of the patients were found to have increased LSM. A retrospective study of 1131 diabetes patients using Fibroscans also reported a prevalence of between 2.8% and 5.6% for advanced fibrosis [19]. In studies from Europe and Australia 5%-35% of people with diabetes had increased LSM, but they used different cutoffs [20-22], i.e., different LSM values to label fibrosis.
According to past histological studies, diabetes is one of the most important risk factors of cirrhosis in patients with NAFLD [23], in the current study 62 (22.3%) subjects had a LSM value of 11.5 or more signifying cirrhosis. Diabetes also doubles the risk of hepatocellular carcinoma in men [5].
The cost of a fibroscan is prohibitive in India and is not available universally, thus identifying patients at high risk is pertinent. In the study, older age, high BMI, longer duration of diabetes, and high HbA1c values correlated with advanced fibrosis (LSM >9.6), further, all of them were either overweight or obese as per Asian BMI cut-offs [24].
The higher LSM scores in this study could be due to the high prevalence of obesity (63% overweight and 30% obese) longer duration of diabetes (mean duration of diabetes 10.98 years), and high HbA1c (mean HbA1c 9.28%) among the study subjects. In another study, using Magnetic Resonance Imaging (MRI) to estimate the hepatic Proton Density Fat Fraction (MRI-PDFF) and Magnetic Resonance Elastography (MRE), NAFLD and advanced fibrosis were screened in a primary care setting. The prevalence of NAFLD (defined as MRI-PDFF ≥5%) and advanced fibrosis (defined as MRE ≥3.6 kPa) was 65% and 7.1%, respectively. It was reported that the associated factors were younger age, higher BMI and higher hip waist ratio and metabolic syndrome [25].
In the index study, correlations were sought only with the risk factors like age, BMI and duration of diabetes, and the parameters that could be influenced by therapy were excluded, though, HbA1c was included in assessing the glycaemic index. In a previous study, age, duration of diabetes mellitus, degree of glycaemic control, BMI, waist circumference, family history of diabetes mellitus, could not predict the presence or severity of NAFLD or fibrosis [10]. Correlations of lipid parameters and liver enzymes were not sought for the subjects, for they were known cases of diabetes for a mean duration of 10.98 years and on multiple oral hypoglycaemic agents and other medications, which could potentially alter the values.
Limitation(s)
The limitations of the study were that only M probe was used. XL probe was not available thus negating its use in very obese patients. Liver stiffness can be measured in significantly more obese and non-obese patients using the XL probe. However, the XL probe is less accurate and adjusted cutoff values are required. Further, Controlled Attenuation Parameter (CAP) was also not performed because of non-availability and reasons for portability; thus, it can only qualify as limited screening. Thus, the prevalence of NAFLD reported in the study could be much less than the actual figures. It is unethical to perform liver biopsy in asymptomatic NAFLD patients, identifying high risk patients and subsequent referral could be the right course of action. Though the sample size was 288, the study could recruit only 287 subjects. However, post hoc calculations showed 94.88% CI to detect a significant outcome.
Conclusion(s)
The study, though performed in a tertiary care center, reveals the high prevalence of NAFLD and advanced liver fibrosis in people with diabetes. Older people with diabetes, with longer duration diabetes, high BMI and uncontrolled diabetes may be at greater risk of advanced fibrosis and are potential targets for liver assessment. Screening for NAFLD and advanced fibrosis is often neglected by diabetologists, and a proactive approach towards screening, identifying and referral of people with diabetes for advanced fibrosis is the need of the hour. Further, subjects with advanced fibrosis need to be referred to a higher center for confirmation of the diagnosis by Controlled Attenuation Parameter (CAP) score and liver biopsy. These subjects need to be followed to preempt morbidity and mortality associated with NAFLD associated cirrhosis and hepatocellular carcinoma.
HbA1c: Glycated haemoglobin; BMI: Body mass index; LSM: Liver stiffness measurement
Bold p-values are significant