Gliomas are the tumours of neuroepithelial tissues and are named according to their cell of origin. According to the cell type, gliomas are divided into Astrocytomas (astrocytic), Oligodendroglioma (oligodendroglial) and Ependymoma (ependymal) [1]. The neuropathological grading of gliomas is based upon the St Anne/Mayo system which includes assesment of cellular atypia, mitotic figures, endothelial proliferation and/or necrosis, all of which can be visualised on H&E staining [2]. IHC detects specific antigens in tissue sections employing monoclonal and polyclonal antibodies and is supplementary to conventional H&E which is still the gold standard for glioma diagnosis. Some specific tumour antigens are either expressed or upregulated in certain cancers which are detected using these antibodies [3]. The current strategy for diagnosis of brain tumour incorporates histological typing of the tumour (astrocytic/oligodendroglial/ependymal) with histological grading (WHO grade) followed by application of IHC.
The WHO classification of CNS tumours 2007 has some limitations in predicting survival, and there is a need for additional methods of determining the patient’s prognosis [4]. The most common alterations in high grade astrocytic gliomas are mutations in the p53 gene which controls the antiproliferative cellular responses, and Ki-67 reactivity, a nuclear non-histone protein which is a marker for cellular proliferation [5,6]. The number of mitoses form the backbone of grading the glial tumours, which are however, difficult to identify in H&E sections. Ki-67/MIB-1 immunostaining helps to determine the proliferative activity as well as the prognosis of the tumour more precisely [7]. The monoclonal antibody anti-Ki-67 being a good marker of cell proliferation can recognise an existing protein in proliferating cells that is absent in quiescent cells, thus can act as an adjunct in establishing patient’s survival. Ki-67 is considered an important biomarker for assessing the prognostic and predictive outcome in astrocytoma as pointed out by several studies which suggests a high proliferation rate with increase in malignancy grade [7-10]. Besides, mutational inactivation of the p53 gene and presence of aberrant p53 expression are reported in high grade tumour suggesting that p53 has a role in tumour progression [11].
This study reinforces the application of IHC markers in determining the grading of gliomas for management and patient’s prognosis. This study was conducted with an objective of diagnosing and grading of glial tumours on histopathology. Subsequently, p53 and Ki-67 were employed with an aim to determine the overexpression and/or mutations of these markers on IHC in these tumours. The IHC grading was finally correlated with the WHO critera of 2007 [4].
Materials and Methods
The present study was a prospective observational study conducted in the Departments of Neurosurgery and Pathology over a period of 18 months from December 2016 to May 2018 in a tertiary care teaching institute in Uttarakhand, Inida. It was approved by the Ethics and Scientific Committee of the Institute (IEC no. ECR/71/INST/UK/2015/RR-18). Forty consecutive clinically and radiologically diagnosed new patients of glial tumours that presented to Neurosurgery Department and were operated for the same at our centre during this period were enrolled in the study.
Inclusion criteria: Only those cases for which a diagnosis of glioma was made with definitive grade according to WHO classification 2007 [4] on histopathology were included in the study.
Exclusion criteria: Cases with inconclusive diagnosis and/or grading were excluded from the study.
All patients were evaluated by history, clinical examination, laboratory and radiological investigations. All the samples received as excised tumour tissue in 10% formalin, after adequate fixations were processed for histopathology. Grossing was done as per standards of histopathology laboratory. The processing of sections taken was done by automatic tissue processor. The blocks were made using embedding section (Leica EG 1150H). The sections were cut at 3-5 microns thickness using microtome (Shandon). They were then stained by H&E and examined under the microscope (Nikon eclipse E200). Diagnosis and findings were recorded on the predesigned proforma. Grading of tumour was done according to the WHO criteria 2007 [4]. It was reviewed and confirmed by consultant histopathologist.
For IHC, sections of 2-4 micron from the above paraffin embedded blocks were made and taken on poly L-lysine coated slides. They were subjected to IHC employing p53 and Ki-67 primary antibodies DO7 (1/50 Dako) and MIB-1(1/50 Novocastra). Sections were incubated with the secondary biotinylated antibody and avidin-biotin peroxide complexes for 30 minutes. Reaction products were revealed with Diaminobenzidine (DAB) as the chromogen and sections were counterstained with Harris’s haematoxylin to enhance nuclear detection. Sections of colon carcinoma tissue that was detected for p53 and chronic tonsillitis tissue that was detected for Ki-67 were used as positive controls. For negative controls, primary antibody was substituted with Phosphate Buffer Saline (PBS) in duplicate sections.
Estimation of p53 and Ki-67 labelling index: p53 scoring was calculated by studying a minimum of five fields in the highest labelled areas and the scoring was assessed as follows [12]:
0=no positive nuclei,
1=<5% positive,
2=5-30% positive,
3=>30% positive.
The Ki-67 labelling index was calculated as a percentage of positively stained nuclei per 1000 cells. One thousand tumour cells were counted in areas where there was an even distribution of positively stained nuclei. In areas where there was an uneven distribution of positive nuclei, the tumour cells were counted in areas of highest positive nuclei density by visual analysis [13].
Statistical Analysis
The statistical analysis was done using SPSS software version 17.0. p53 and Ki-67 indices were analysed in discrete and continuous fashions. Analysis of Variance (ANOVA) test was performed to compare categorical variables with status of p53 and Ki-67 expression. A p-value of <0.05 was accepted as statistically significant. Spearman’s rank correlation coefficient rs, was used to determine the relationship between histologic grade and proliferation markers. The ranges for Spearman’s rank correlation are 0.2-0.39 (weak correlation), 0.4-0.59 (moderate correlation) and 0.6-1.0 (strong correlation) [14].
Results
Of the 40 cases included in the study, 22 cases (55%) were males and 18 cases (45%) were females. The youngest patient in this study was eight-year-old whereas the oldest was 82-year-old. Maximum numbers of cases were seen in the age group of 21 to 30 years (9 cases, 22.5%). However, higher incidence was also noticed in the 5th and 7th decades.
On histopathology, 16 cases (40%) were diagnosed as astrocytoma followed by 12 cases (30%) of GBM and six cases (15%) each of ependymomas and oligodendrogliomas. Grade-wise distribution of all the histopathological types of glial tumours was done using WHO criteria [Table/Fig-1]. Of these, 15 cases (37.5%) were of grade II (Diffuse Astrocytoma; n=10, Ologodendroglioma; n=2, Ependymoma; n=3) followed by 11 cases (27.5%) of grade III (AA; n=6, Anaplatic Oligodendroglioma; n=4, Anaplastic Ependymoma; n=1) and 12 cases (30%) of grade IV (GBM). Grade I tumours were the least frequent accounting for only 2 cases (5%) of Ependymoma [Table/Fig-2].
Distribution of tumours (n=40) according to WHO grading.
| Histopathological diagnosis and WHO grades | Frequency | Percent (%) |
|---|
| Diffuse astrocytoma II | 10 | 25.0 |
| Anaplastic astrocytoma III | 6 | 15 |
| Glioblastoma multiforme IV | 12 | 30.0 |
| Oligodendroglioma II | 2 | 5.0 |
| Anaplastic oligodendroglioma III | 4 | 10.0 |
| Ependymoma I | 2 | 5 |
| Ependymoma II | 3 | 7.5 |
| Anaplastic ependymoma III | 1 | 2.5 |
| Total | 40 | 100.0 |
Immunochemistry scores in glial neoplasms of various types.
| WHO grade | No. | MIB-1 Mean | p53 Mean |
|---|
| Ependymoma I | 2 | 0.3 | 0.78 |
| Diffuse astrocytoma II | 10 | 3.0 | 2.0 |
| Oligodendroglioma II | 2 | 2.8 | 1.0 |
| Ependymoma II | 3 | 0.5 | 0.3 |
| Anaplastic astrocytoma III | 6 | 8.5 | 6.4 |
| Anaplastic oligodendroglioma III | 4 | 2.90 | 10 |
| Anaplastic ependymoma III | 1 | 3.2 | 2 |
| Glioblastoma multiforme IV | 12 | 7.95 | 7.8 |
Spearman’s rank correlation coefficient, was used to determine the relationship between histologic grade and proliferation markers. A stronger correlation was found between grade and Ki-67 score (0.79) while this correlation was moderate for p53 (0.58).
Astrocytomas
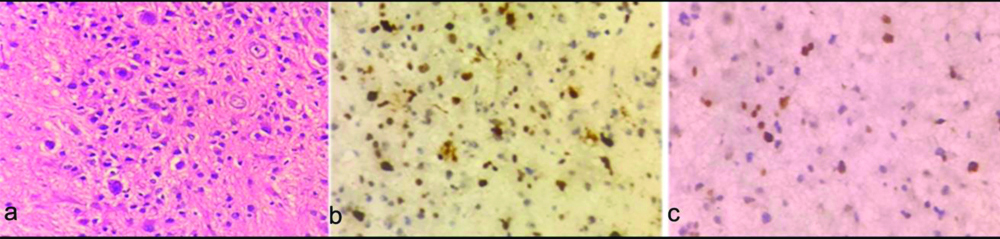
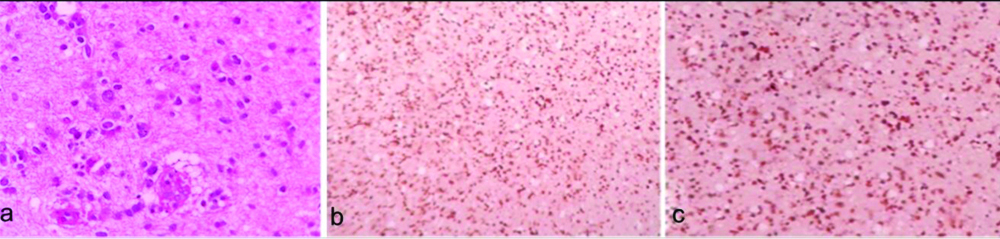
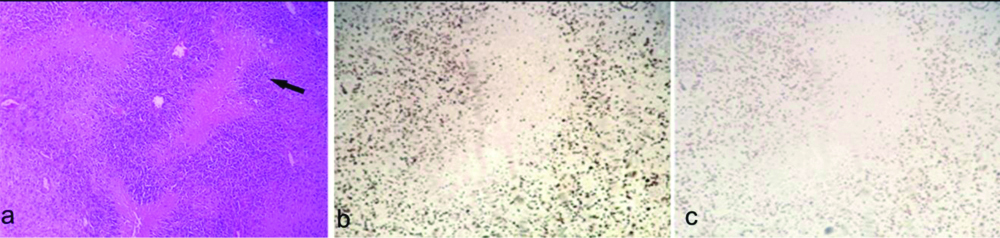
Diffuse Astrocytomas (WHO grade II) exhibited focal Ki-67 positive nuclei with labeling index of <30% and p53 labeling index <20% [Table/Fig-3a-c]. AA (WHO grade III) demonstrated a Ki-67 labelling index of 65% and p53 labeling index less than or equal to 60% [Table/Fig-4a-c]. GBM (WHO grade IV) which was the most frequently diagnosed glioma had a Ki-67 labelling index of 85% while p53 labelling index was less than or equal to 60% [Table/Fig-5a-c]. The mean p53 and Ki-67 positivity amongst different grades of astrocytoma is shown in [Table/Fig-6]. The p-value for p53 in astrocytomas was 0.07 which was not statistically significant while p-value for Ki-67 in astrocytomas was 0.001 which was statistically significant suggesting that the positivity of Ki-67 increases as the histopathological grade of astrocytomas increases.
a) Diffuse astrocytoma (WHO grade II): atypical hyperchromatic, sharply angulated nuclei infiltrating the brain tissue (H&E, X400); b) Focal Ki-67 positive nuclei. Labeling index 30% (X400); c) p53 labeling index 20% (X400).
a) Anaplastic Astrocytoma (AA) (WHO grade III): atypical nuclei exhibiting marked pleomorphism (H&E X400); b) Corresponding Ki-67 labeling index 65% (X100); c) p53 labeling index 60% (X400).
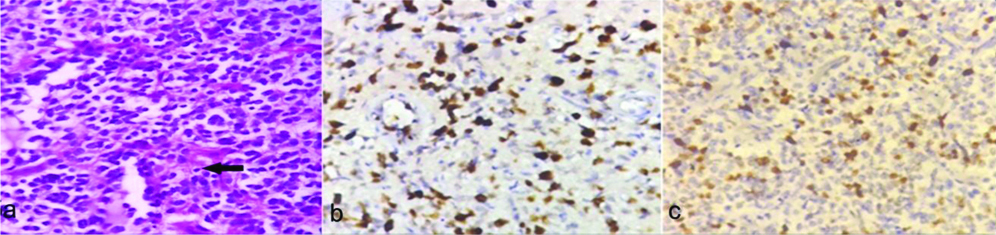
a) Glioblastoma Multiforme (GBM) (WHO grade IV), Arrow: showing Perinecrotic pseudopalisading (H&E, X100); b) Corresponding Ki-67 positivity in tumour nuclei surrounding the necrotic area. Ki-67 labeling index 85% (X100); c) p53 labeling index 60% (X100).
Comparison of mean p53 and Ki-67 positivity of diffuse and Anaplastic Astrocytomas (AA) with Glioblastoma Multiforme (GBM).
| Grade | N | p53 | Ki-67 |
|---|
| II | 10 | 29.5±10.12 | 32.50±13.38 |
| III | 06 | 50.83±8.01 | 48.33±9.30 |
| IV | 12 | 47.66±29.29 | 58.08±12.80 |
| p-value for grades II and III | | 0.001 | 0.02 |
| p-value | | 0.07 | 0.001 |
Oligodendroglioma
Oligodendroglioma (WHO grade II) exhibited focal Ki-67 positive nuclei with labeling index of <20% and p53 labeling index <10% [Table/Fig-7a-c]. Anaplastic Oligodendroglioma (WHO grade III) demonstrated a Ki-67 labelling index of 35% and p53 labeling index less than or equal to 20% [Table/Fig-8a-c]. The mean p53 and Ki-67 positivity amongst different grades of Oligodendroglioma is shown in [Table/Fig-9]. The p-value of p53 for grade II and III oligodendrogliomas was 0.55 which was not statistically significant and p-value of Ki-67 for grade II and III oligodendrogliomas was 0.35 which is also not statistically significant.
a) Oligodendroglioma (WHO Grade II) showing tumour cells with perinuclear halo (H&E, X400); b) Ki-67 labeling index 20% (X100); c) p53 labeling index 10% (X100).
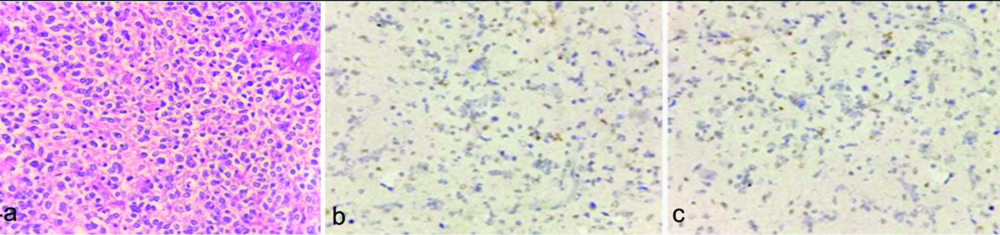
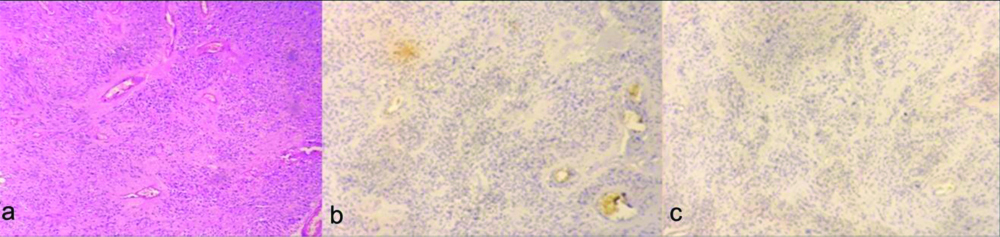
a) Anaplastic oligodendroglioma (WHO grade III) showing crowded tumour cells with perinuclear halo, Arrow:showing arcuate blood vessels. (H&E, X400); b) Ki-67 labeling index 35% (X400); c) p53 labeling index 20% (X400).
Comparison of grade of oligodendrogliomas with their p53 and Ki-67 positivity.
| Grade | N | P53 | Ki-67 |
|---|
| II | 2 | 6±5.65 | 12±11.31 |
| III | 4 | 8.25±3.31 | 30.50±22.15 |
| p-value | | 0.55 | 0.35 |
Ependymomas
Subependymoma (WHO grade I) exhibited Ki-67 positive labeling index of <2% and p53 labeling index <8% [Table/Fig-10a-c]. Ependymoma (WHO grade II) exhibited a Ki-67 labelling index of <2% and p53 labeling index less than or equal to 2% [Table/Fig-11a-c]. There was a single case of Anaplastic Ependymoma (WHO grade III) which showed a Ki-67 labelling index of 12% and p53 labelling index of 40% [Table/Fig-12a-c]. The mean p53 and Ki-67 positivity amongst different grades of ependymoma is shown in [Table/Fig-13]. The p-value could only be calculated for grades I and II and not for grade III as there was only one case of grade III ependymoma. The p-values for p53 and Ki-67 for grades I and II ependmomas was 0.46 and 0.50, respectively which were not statistically significant.
a) Subependymoma showing hyperchromatic tumour cells surrounded by fibrillary process (H&E, X400); b) Ki-67 labeling index 2% (X400); c) p53 labeling index 8% (X400).

a) Ependymoma (WHO grade II) showing prominent perivascular rosettes. (H&E, X100); b) Ki-67 labeling index <2% (X100); c) p53 labeling index <2% (X100).
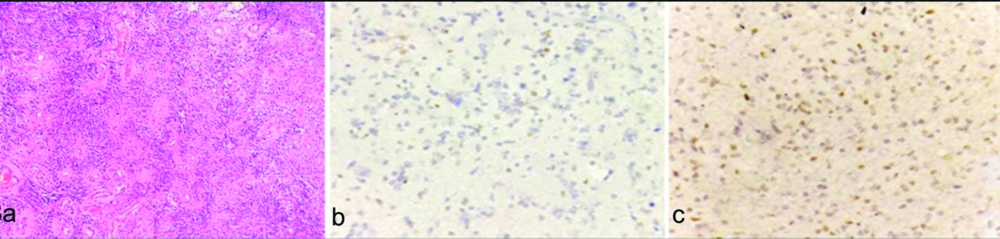
a) Anaplastic ependymoma (WHO Grade III) showing prominent ependymal rosettes and perivascular pseudorosettes (H&E X100); b) Ki-67 labeling index 12% (X100); c) p53 labeling index 40% (X100).
Ependymomas: Comparison of grades of ependymomas with their p53 and Ki-67 positivity.
| Grade | N | p53 | Ki-67 |
|---|
| I | 2 | 9.00±1.41 | 2.00 |
| II | 3 | 5.26±5.83 | 7.93±10.45 |
| III | 1 | 12.00 | 40 |
| p-value for grades I and II | | 0.46 | 0.50 |
Discussion
The St. Anne-Mayo grading system, also known as the Daumas-Duport grading system was introduced in 1988 for grading diffuse astrocytomas. This classification has now largely been replaced by the WHO grading system which however is derived from the St Anne-Mayo 4 tiered system that employs the presence of four morphologic criteria to assign a grade: nuclear atypia, mitosis, endothelial proliferation- ‘piled-up’ endothelial cells not hypervascularity and necrosis [15,16]. The grade then depends on the accumulation of these criteria as follows:
Grade 1: 0 criteria
Grade 2: 1 criterion (usually nuclear atypia)
Grade 3: 2 criteria (usually nuclear atypia and mitosis)
Grade 4: 3 or 4 criteria
As per WHO guidelines 2007, the CNS astrocytic tumours have been divided into four malignant groups as grade I-IV astrocytomas based on their histopathological hallmarks i.e., cytological atypia, mitotic activity, cellularity, microvascular proliferation and/or necrosis and thus shares many similarities [4,15,17,18].
Histopathologically, mitotic activity is employed in distinguishing between grade II and grade III gliomas, whereas microvascular proliferation and/or necrosis suggest high grade gliomas like anaplastic oligodendroglioma (grade III) or glioblastoma (grade IV). Prognostically, grade I Astrocytomas have the best patient prognosis and least aggressive course of progression; grade II astrocytoma, a more aggressive course and less favourable patient prognosis; grade III astrocytoma or AA, with an overall bad patient prognosis; and grade IV astrocytoma, referred to as GBM, with highly atypical cells, characterised by rapid progression and the worst patient prognosis of the IV classes [4]. Grades III and especially grade IV astrocytic tumours of the CNS, are considered the most malignant entities in oncology that are rarely diagnosed in their early stages and are difficult to treat.
With the current advancements, the improvement of patient’s prognosis and greater effectiveness in the treatment of astrocytomas will henceforth depend on the knowledge and manipulation of molecular and genetic pathways that regulate the growth of these aberrant tumours. The ongoing research in novelty of these biomarkers has thus brought additional information in this regard in recent years [19-22]. On the basis of disease progression, two classes of markers are recognised in oncology: prognostic marker that determines the behaviour of disease regardless of the treatment used and the predictive marker which provides information about the expected developments if certain intervention is made [23,24]. The p53 gene is a tumour suppressor gene and is referred to as the “guardian of genome” as it plays a pivotal role in eliminating genetically damaged cells either directly by mechanism of DNA repair or indirectly by inducing cell cycle arrest/or apoptosis in genetically damaged cells. The normal p53 gene encodes a 81 KDa p53 nuclear protein with a short half life, that is present in minute amounts to be detected by routine immunohistochemistry. Mutation in p53 gene results in accumulation of mutant p53 protien which has a longer half life and reaches the threshold for immunohistochemical detection [25-27].
Out of 40 cases of glial tumours included in the study, male to female ratio was 1.2:1 with the median age at presentation for astrocytomas to be 41.5 years of age. The Central Brain Tumour Registry of The United States reports the mean age for diffuse astrocytomas as 47 years and 54 years for AAs [28]. In a study by Jaiswal J et al., at NIMHANS Bangalore, the data between 2010-2014 reflects the mean age for astrocytomas to be a decade earlier than in western studies [29].
Amongst gliomas, the grade II diffuse astrocytomas and grade III AAs showed a mean p53 positivity of 29.5±10.12 and 50.83±8.01, respectively in this study. However, GBM grade IV astrocytomas showed a mean p53 positivity of 47.66±29.29. Studies by other authors have shown an increase in mean value for p53 with increasing grades of astrocytoma. They have detected p53 expression in 15-40% of diffuse astrocytomas, 35-60% of AAs and 35-70% of GBM [27,30,31]. However in contrast to other studies, the three grades of astrocytomas included in the study, showed a higher mean p53 positivity than cited in literature.
The p-value for p53 positivity in grade II diffuse and grade III AAs was found to be 0.001 indicating a significant correlation between the p53 positivity and grade for diffuse and AAs. However, with inclusion of GBM the p-value was found to be 0.07, which was not statistically significant. Development of GBM occurs either by p53 mutation and/or p53 protein accumulation resulting in secondary GBMs or Epidermal Growth Factor Receptor (EGFR) amplification resulting in primary GBM [23,24]. The non-significant p-value for p53 immunopositivity when the grade II and III astrocytomas were compared with GBM, could be attributed to the fact that primary and secondary glioblastomas were not categorised based on history.
Amongst ependymomas for grade I, II and III tumours, mean p53 positivity was 9.0±1.41%, 5.26±5.83 and 12%, respectively in this study. The p-value for correlating the various grades of ependymoma with their p53 positivity was 0.46, which was statistically insignificant. The observation in this study was thus contradictory to the studies done by Rushing EJ et al., and Suri SV et al., who had observed a positive correlation between the tumour grade and immunopositivity [32,33]. Amongst oligodendroglioma, the grade II tumours and grade III tumours showed a mean p53 positivity of 6±6.5 and 8.25±3.31, respectively. The p-value correlation between the grades of oligodendroglioma with their p53 positivity was 0.55 which was not significant statistically. The same findings were observed by Kros J et al., and Satio A and Nakazato Y who suggested that there was no statistically significance between low and high grade oligodendrogliomas in their mean p53 staining indices [34,35].
Although p53 protein overexpression was found both in low and high grade gliomas, it fails to correlate p53 expression with grade of the tumour in this study as well as other studies. Some of the studies may reflect discordance between p53 abnormlities in various grades of gliomas and this may be attributed to variations in immunostaining methodologies and criteria of p53 positivity. This may be attributed to the fact that different studies may have a different sample size and histological nature of the tumours Thus, p53 generally has a limited prognostic value [36,37].
Proliferation is a basic process in the gliomagenesis, thus assessing mitotic count is the cornerstone in grading these tumours. IHC determination of proliferative activity is a useful adjunct to the histopathological diagnois and can be determined by Ki-67 proliferative indices [38]. The anti-Ki-67 is a monoclonal IgG1 antibody. It recognises a protein existing in proliferating cells and absent in quiescent cells. Several studies point to a substantial increase in the rate of cell proliferation, measured by the anti-Ki-67, with the increase of the gliomas malignity, with statistically higher differences among astrocytomas of high grade when compared to those of low grade [7,17,20,39]. A value greater than 10% is a cut-off point reasonable to indicate a greater potential for malignancy and worse prognosis [20,39].
Mean Ki-67 positivity of 32.5±13.38 and 48.33±9.30, respectively was observed in grade II diffuse astrocytomas and grade III AAs and mean Ki-67 positivity of 58.08±12.80 was noted in GBM, grade IV astrocytomas. The p-value for Ki-67 immunostaining of the various grades of astrocytomas was 0.001 in this study, which was statistically significant. This correlates well with the study by Tihan T et al., who observed, the Ki-67 labeling index between low and high grade astrocytomas to be statistically significant (p<0.01) [30].
Amongst ependymomas for grade I, II and III tumours, mean Ki-67 positivity of 2, 7.93±10.45 and 40%, respectively was observed. Thus, it was concluded that a higher grade of ependymoma showed a higher mean Ki-67 positivity. However, for both grade II and grade III ependymomas, the percent positivity in present study was higher than cited in literature [40]. The p-value for correlating the various grades of ependymoma with their Ki-67 positivity was 0.50, which was statistically insignificant. In a study by Sundaram C et al., on the IHC of ependymomas found no such statistical significant correlation [41]. Amongst oligodendrogliomas, the grade II tumours and grade III tumours showed a mean Ki-67 positivity of 12±11.31 and 30.5±22.15, respectively. The p-value for correlation between the grades of oligodendrogliomas with their Ki-67 positivity was 0.35 which was not significant statistically.
Thus, Ki-67 is useful for differentiating between low grade and high grade gliomas, but differentiating between grade I and grade II or grade III and grade IV is more problematic due to overlap of values between different tumour grades. Besides, the procedure for Ki-67 immunostaining is not standardised and has many variables. Further counting of immunoreactivity is subjected to intraobserver variability [33].
Limitation(s)
The IHC markers Ki-67 and p53 are useful adjunct to histopathological diagnosis and tumour grading however, they are of limited value when used alone but may be used to improve diagnostic and grading accuracy of glioma especially in small biopsy specimens and thus must be used with other variables to define the classification, diagnosis and prognosis of the disease despite some reports in literature stating otherwise.
Conclusion(s)
Thus, it can be concluded from the study, that Ki-67 proliferation index correlated significantly with the tumour grade; however p53 showed no such statistically significant correlation. Ki-67 appears to be a better marker than p53 and can be used to assess the histological grade of tumours. Thus, IHC staining with Ki-67 and p53 may serve as an adjunct in determining the clinical course in combination to tumour grade. However, Ki-67/p53 immunostaining alone is not sufficient to adequately determine the malignancy grade but may be used to improve diagnostic and grading accuracy of glioma especially in small biopsy specimens.