Stroke is frequently followed by significant bone loss, which increases the risk of fracture in survivors. Bone loss begins within days of vascular brain injury, progresses till fourth month and then lowers until the end of first year after stroke. Following that a steady state is achieved, resulting in irreversible bone loss and an elevated fracture risk. Paresis, impaired mobility and decreased bone load, nutritional factors, endocrine factors and pharmacological factors are considered to be aetiological factors for osteoporosis in stroke patients [1]. They have more severe bone loss in upper extremities than in lower extremities, which is probably due to the higher degree of paresis and loss of function in the upper limbs. The duration of paresis appears to be a key factor in determining the extent of bone loss, playing a significant role in the upper limbs rather than in the lower limbs [1,2]. Due to various factors like age, mobility deficits, dysphagia, cognitive impairments and social isolation, stroke patients are at higher risk of inadequate nutrition. Malnutrition can lead to reduced vitamin D, K, B12 and folate in their blood which again can cause osteoporosis directly or indirectly in these patients [3,4]. Therefore, this study was planned to find out prevalence of osteoporosis using BMD in stroke survivors in Indian population so that action may be taken at the earliest to prevent loss of bone mass in these patients in future.
This study was aimed to assess the BMD in hip, spine and wrist and also to evaluate BMD difference between paretic and nonparetic side in ambulatory stroke survivors.
Materials and Methods
This hospital-based observational cross-sectional study was conducted in the Department of Physical Medicine and Rehabilitation, VMMC and Safdarjung Hospital, New Delhi from January 2015 to June 2016. Ethical clearance was taken from Institutional Ethics Committee (IEC-500/2015).
Inclusion criteria: The inclusion criteria were ambulatory patients of age 35 years and above with stroke of minimum one year duration.
Exclusion criteria: The exclusion criteria were bone malignancy, pregnancy, diagnosis of vascular insufficiency or neuropathy, any local trauma or chronic infection, patients who are on drugs which have negative effect on bone metabolism. They were assessed in detail using a pre-structured proforma which included detailed medical history, demographic characteristics and thorough clinical examination. All the investigations available with patient were also recorded. Following parameters were assessed in them:
Biochemical markers: Serum calcium, phosphorous and alkaline phosphatase
X-ray of LS spine and bilateral hip and wrist in antero-posterior and lateral view
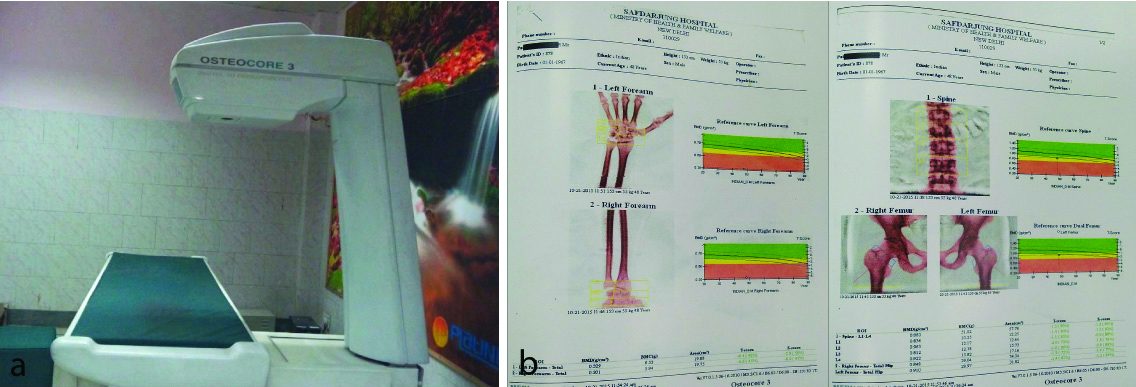
BMD using Dual Energy X-ray Absorptiometry by OSTEOSCORE-3 (Digital 2D Densitometer) at spine, forearm and hip [Table/Fig-1a,b].
a) DEXA machine used in present study. b) DEXA report sample. DEXA: Dual energy x-ray absorptiometry
Sample size calculation: The prevalence rate of osteoporosis in stroke survivors was 17.9% as observed by Uluduz D et al., [5]. Considering this value as reference, the minimum required sample size with 5% level of significance (alpha error) and 12% margin of error came out to be 40 patients.
Formula used is: N ≥ (p(1 -p))/(ME/z α)2
Where, Z α is value of Z at two sided alpha error of 5%, ME is margin of error and p is prevalence rate.
Statistical Analysis
Demographic and clinical observations were recorded in the study proforma and then entered in Microsoft Excel sheet. Prior to analysis all the entries were double checked for any data error. Quantitative data was presented as mean±SD and qualitative data as percentage. Kolmogorov-Smirnov analysis was used to check if data is following the normal distribution. Mann-Whitney U test was used to study significance of difference between T-Score of paretic side and nonparetic side. Chi-Square test was used to assess significance of difference of frequency of osteopororsis between paretic and nonparetic side. The p-value < 0.05 was considered to be statistically significant. SPSS®14 (IBM Corp. NY, USA) and MS Excel® (Microsoft Corp. New Mexico USA) were used for other statistical calculations.
Results
Out of 40 subjects, 82.5% males and 17.5% females were present. Maximum 27.5% subjects were in 61-70 years of age while 25% subjects were in 41-50 years and 51-60 years of age group each. Mean age of study group was found to be 53.9±10.9 years. Twenty five percent subjects included in study were educated up to primary education while 47.5% subjects were educated up to secondary grades. Five percent subjects were educated up to higher secondary and 7.5% were graduates. Fifteen percent subjects were found to be illiterate [Table/Fig-2].
Table showing demographic profile of patients enrolled in the study.
| Characteristics | No. of subjects | Percentage |
|---|
| Age group (years) | <40 | 7 | 17.5 |
| 41-50 | 10 | 25 |
| 51-60 | 10 | 25 |
| 61-70 | 11 | 27.5 |
| >70 | 2 | 5 |
| Gender | Female | 7 | 17.5 |
| Male | 33 | 82.5 |
| Education | Illiterate | 6 | 15 |
| Primary | 10 | 25 |
| Secondary | 19 | 47.5 |
| Higher secondary | 2 | 5 |
| Graduate | 3 | 7.5 |
| Associated risk factors | Smoking | 14 | 35 |
| Alcohol intake | 11 | 27.5 |
| Hypertension | 26 | 65 |
| Diabetes mellitus | 10 | 25 |
| Duration of paralysis (years) | 1-3 | 26 | 65 |
| 4-6 | 10 | 25 |
| 7-9 | 1 | 2.5 |
| ≥10 | 3 | 7.5 |
| Side of body involved | Right | 27 | 67.5 |
| Left | 13 | 32.5 |
History of smoking was present in 35% subjects and that of alcohol intake was present in 27.5% subjects. Around two third stroke survivors showed history of hypertension and prior history of Diabetes Mellitus (DM) was present in 25% subjects. Risk factor combinations in study group were also assessed. It was found that 5% subjects were having hypertension and DM and were alcoholic as well as smoker. Around 13% subjects were found to be hypertensive, smoker, alcoholic and diabetic. 22.5% subjects were smoker and alcoholic [Table/Fig-2].
The duration of paralysis was 1-3 years in 65%, 4-6 years in 25% subjects, 7-9 years in 2.5% subjects and >10 years in 7.5% subjects. Around 68% subjects were having paralysis on right side and rest on left side [Table/Fig-2].
Mean serum calcium, serum phosphorus and ALP levels were found to be 10.6 mg/dL (8.7-11.6 mg/dL), 4 mg/dL (2.3-5.4 mg/dL) and 106 IU/L (56-424 IU/L), respectively.
LS spine x-ray findings in 82.5% subjects were found to be abnormal. Among abnormal findings, degenerative changes (67.5%), diffuse osteopaenia (7.5%), scoliosis (2.5%) and anterolisthesis (Grade I) (2.5%) were present. About (27.5%) subjects showed osteopaenia on x-ray findings of right wrist, in X-ray findings of left wrist, 5% subjects showed osteopaenia and 2.5% showed non-union of old fracture. X-Ray findings of right hip, 22.5% were found to be abnormal in the form of diffuse osteopaenia in 2.5%, bone island at acetabulum in 2.5% and degenerative changes 12.5% subjects. In left hip, degenerative changes were detected in 20% and diffuse osteopaenia in 5% subjects.
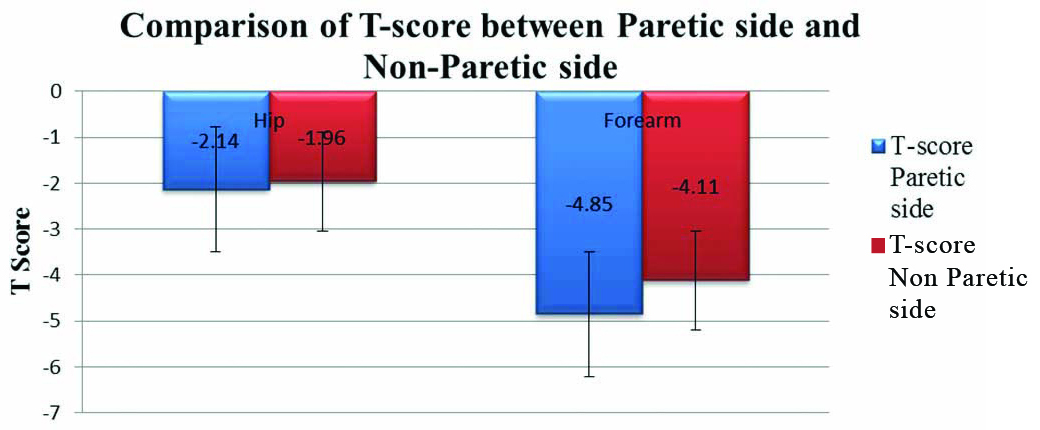
In BMD assessment, T-scores in forearm and hip were compared between paretic side and nonparetic side. The T-score for hip on nonparetic side was found to be higher (Mean-1.96±1.74) compared to that of paretic side (Mean-2.14±1.57) but the difference failed to reach statistical significances (p=0.4). Similarly, the T-score for forearm was also found to be higher in nonparetic side (Mean-4.11±2.46) compared to paretic side (Mean-4.85±2.01) but the difference failed to reach statistical significance (p=0.22) on comparison with Mann-Whitney U test [Table/Fig-3,4 and 5].
Comparison of T-score betwen paretic side and nonparetic side.
Mann-Whitney U test was used to calculate T-Score
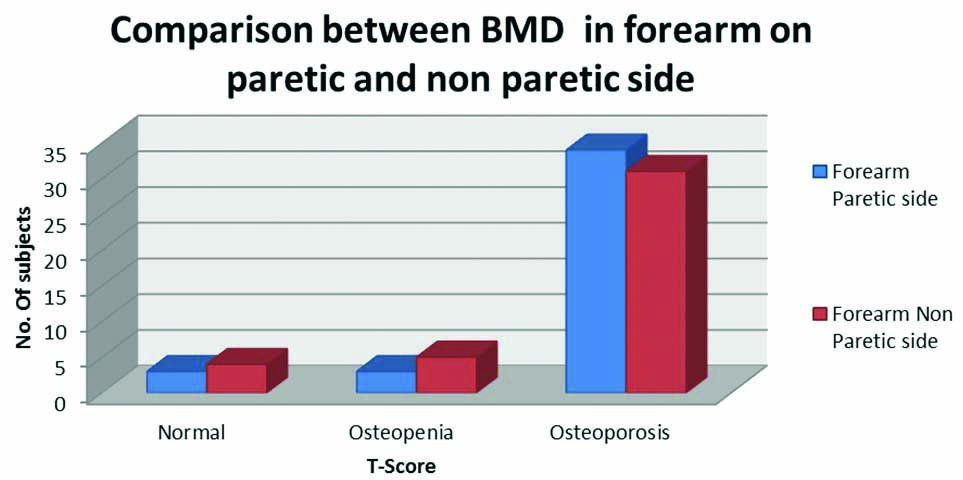
Comparison between T-score in forearm on paretic and nonparetic side.
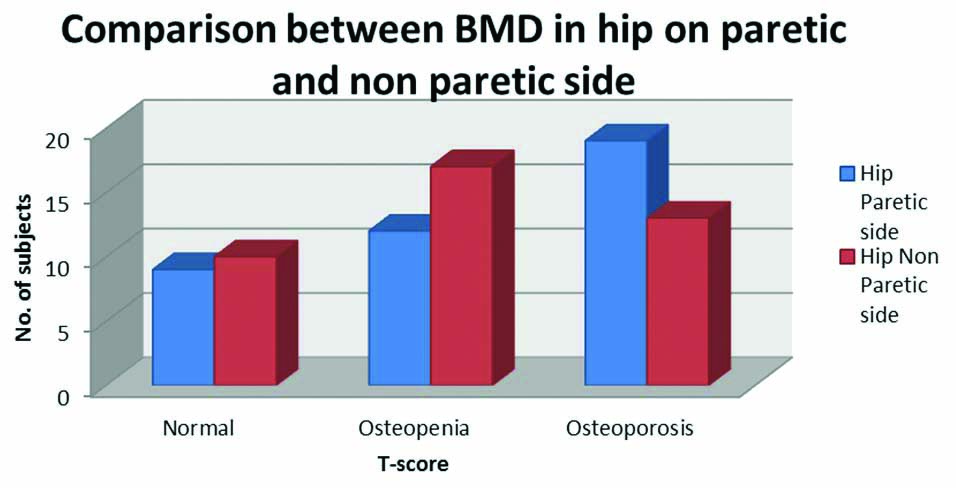
Comparison between T-score in hip on paretic and nonparetic side.
Mann-Whitney U test was used; BMD: Bone mineral density
Frequency of osteopaenia and osteoporosis (indicated by T-score) was found to be higher on forearm of paretic side while the normal T-score was more frequent on nonparetic side forearm but the frequency difference failed to reach the statistical significance (p=0.7) [Table/Fig-4].
Similarly, frequency of osteopaenia and osteoporosis (indicated by T-score) was found to be higher in hip of paretic side while the normal T-score was more frequent on nonparetic side hip but the frequency difference failed to reach the statistical significance (p=0.3) [Table/Fig-5].
DEXA scanning of spine showed 52.5% subjects were osteopenic and 37.5% were osteoporotic.
Discussion
The average age of stroke patients in developing countries is assumed to be 15 years lower than that of stroke patients in developed countries. In India, nearly 20 percent of patients admitted to hospitals with their first stroke, are reported to be under the age of 40 [6]. But the Mumbai [7] and Trivandrum [8] registries indicated that the average age of stroke patients was 66 and 67 years respectively. In the Bangalore study, however, the mean age was found to be 54.5 years [9].
There were 82.5 percent males and 17.5 percent females in the present study. Men had a higher stroke incidence rate than women in the Mumbai registry [7]. In the Trivandrum registry, women had a higher crude incidence rate than men, but men had a higher age-standardized incidence rate [8]. The Bangalore study also reported a male-to-female ratio of 2:1, with men having a greater preponderance (67%) than women [9].
About 67.5% subjects were having paralysis on right side and 32.5% were having paralysis on left side. Similarly, in a study by Naess H et al., 58.3% subjects were right hemiparetic while 41.7% were left hemiparetic [10]. Young adults have a higher frequency of Left Cerebral Hemispheric (LH) infarctions than Right Hemispheric (RH) infarctions [10]. Serum calcium, phosphorus and ALP levels were also assessed in study subjects. Mean serum calcium values were found to be 10.6 mg/dl, serum phosphorus was 4 mg/dl and ALP levels were found to be 106 IU/L. In a study by Chaudhuri JR et al., authors found that mean serum calcium was 8.8 mg/dl mean serum phosphorus was 3.6 mg/dl and ALP levels were mean 121.1 U/l in stroke patients [11].
All the subjects were analysed using radiological investigation. In roentgenogram findings, degenerative changes in lumbosacral spine were present in 67.5% subjects and osteopaenia was present in 7.5% subjects. Osteopaenia in x-ray was detected in 27.5% subjects in right wrist and 5% subjects in left wrist. Findings in right hip were diffuse osteopaenia in 27.5% subjects, 77.5% were found to be normal. In left hip, diffuse osteopaenia in 2.5% subjects. As more patients were right hemiparetic therefore osteopaenia on roentogram was more on right side as compared to left side.
Frequency of osteoporosis (indicated by T-score) was found to be higher in forearm and hip on paretic side which was statistically insignificant while the normal or osteopenic T-score was more frequent on nonparetic side. Another study found that in both acute and chronic stroke patients, BMD of the affected and unaffected sides of the femur did not vary significantly [12]. But, other studies have found pronounced decrease in BMD on the paretic side and greater bone loss was associated with factors like functional deficits, physical fitness, lean mass, mobility, weight bearing early after stroke and grip strength [13-16].
Bone resorption starts early in stroke and immobilisation plays a major role in the pathogenesis of osteoporosis after stroke [1]. Along with bone resorption, the increased bone metabolism as demonstrated by the increased serum concentrations of bone resorption marker; and a normal or low bone growth protein; a bone formation marker affects the bone after stroke [17]. Immobilisation basically works through two mechanisms: clinical which includes hypercalciuria causing suppression of parathyroid-1,25-dihydroxyvitamin D axis and radiological which involves activation of remodeling loci and a decrease of the osteoblastic stimulus ultimately causing reduction in bone mass [18]. Moreover, in long-standing hemiplegic stroke patients, hypovitaminosis D appeared to be the dominant cause of immobilisation-induced osteopaenia [12]. The supplementation of vitamin D could possibly reduce the risk of bone loss among stroke patients. Hip fracture after stroke is an increasingly recognised problem [17]. Few case-control studies found that the risk of hip fracture is twice as high among the subjects with the greater risk in people above 71 years, females and with recent stroke [18]. However, in a prospective study, there was no increase in the risk of fractures generally or hip fractures specifically compared with controls but among the stroke patients with hemiparesis or hemiplegia, the majority of fractures occurred on the impaired side [19]. Similarly, a study of stroke patients found a >7-fold increase in fracture risk, including hip fracture, during the first year after hospitalisation [20].
Limitation(s)
The limitations were lack of control subjects and follow-ups in assessment of biochemical markers due to limited resources.
Conclusion(s)
From this study it is concluded that, in stroke patients BMD is lower on paretic side at hip and forearm when compared to nonparetic side though statistically insignificant. Subjects with stroke should be treated as potential candidate at risk of osteopaenia and osteoporosis. Adequate awareness should be generated in stroke survivors and more importantly in their caregivers to avoid the consequences of osteopaenia as these subjects are more prone to fall and expected fracture. Larger prospective multicentric studies are recommended in future to extend prophylactic approach for stroke survivors, in perspective of better BMD to prevent fractures.