The Peak Expiratory Flow Rate (PEFR) is defined as the maximal flow achieved during expiration which is delivered with maximal force starting from the level of maximal lung inflation according to European Respiratory Society [1]. It is an important lung function index employed to monitor disease severity such as asthma. PEFR depends on certain factors such as age, height, weight, gender, race and environmental conditions [2,3].
The body mass in childhood and adolescence increases proportionately along with skeletal growth. On the other hand, in adults, body mass still goes on to increase, but at a slower rate. Those adults gaining weight accumulate fat in normal circumstances. In case of those individuals undergoing physical training, the increased body weight is due to increase in muscle quantity and bone mineralisation, with smaller quantities of fat. Lung capacity and function are influenced by these changes [4,5]. The body mass in the later stages stabilises and then declines. Body mass plays an important role in influencing pulmonary functions. In obese individuals, diaphragm is prevented from descending down as far as it could by the abdominal mass. Hence, Pulmonary Function Test (PFT) measures will be smaller than expected [4].
Blood pressure is a significant cardiovascular parameter documented in literature to have an abstract association with body mass; weight gain is considered as a risk factor for hypertension development. Literature evidence has shown an increase in body weight is associated with increased risk of metabolic disorders, cardiovascular disease and respiratory diseases [6-9].
Modern day living exposes individuals to various degrees of stress impacting physiological and cardiovascular parameters. Identification of cardiovascular risk factors in identification and prognosis of respiratory parameters helps physician to plan appropriate therapy and intervention. Literature exists on correlation regarding targeted population such as cardiovascular patients, asthmatic patients, obese etc [10,11]. This may be the first study to report on healthy subjects in northern India. There is a need to know if anthropometry and MAP management improves PEFR. Hence, this study was undertaken to evaluate the relationship of BMI, MAP on PEFR in healthy individuals.
Materials and Methods
A cross-sectional, observational study was done in the Department of Physiology, KGMU, Lucknow from 30th July 2019 to 30th July 2020, on a sample of 40 individuals. Informed consent of all individuals was obtained after explaining the purpose of the study. Institutional Ethical clearance was granted from the institution (96ECM II B-Thesis/P24).
Sample size calculation: Sample size was determined using the formula described below. Sambo N et al., reported a PEFR of 525.55±16.44, which was used for sample size estimation [12,13].
Study population: Individuals aged 18-35 years; of both genders who were age and sex matched were recruited. The above age group was chosen as they fall at lesser risk of any systemic diseases affecting respiratory functioning. Study subjects were healthy individuals and undergraduates from the university campus of King George’s Medical University.
Inclusion criteria: Subjects who had no history of cardiovascular or respiratory disease and without any habit of smoking formed the study sample. They were clinically examined and interviewed.
Exclusion criteria: Subjects having acute respiratory illness, stress incontinence, pregnancy, tobacco or alcoholic, not willing to participate were excluded.
Measurement of BMI
BMI of every individual was calculated using the formula: BMI=Weight (kg)/Height (m2). Weight was measured using a digital weighing machine and height with the help of a height scale (meter rule) which was rounded to the nearest 0.1 kg and 0.1 cm, respectively. BMI scores were categorised as underweight (<18.5 kg/m2), normal (18.5-24.9 kg/m2), overweight (25.0-29.9 kg/m2) and obese (>30.0 kg/m2).
Measurement of MAP: Mercurial sphygmomanometer was used to record Resting Blood Pressure (RBP). RBP was taken thrice with five minutes intervals as per the standards. The readings were taken in the right arm in triplicate, and the average of the three readings was used as the individual’s blood pressure. The MAP was derived from the formula: MAP=DBP+1/3 (SBP-DBP).
Measurement of PEFR: PEFR was measured using a spirometer (Spirobank G- MIR: Rome, Italy). Each individual was asked to inhale deeply first and subsequently exhale maximally into the device with the aid of the mouthpiece. The study subjects were asked to perform this thrice, and the highest was recorded. The instrument was wiped with cotton swab soaked in methylated spirit before every use.
Statistical Analysis
The data obtained were analysed using SPSS 20.0 version. Parameters are presented as mean+SD. Correlation analysis was run to determine the relationship between BMI and MAP as independent variables and PEFR as dependent variables. The p-value of <0.05 was considered to be statistically significant.
Results
The mean BMI of the study population was 29.56±5.20 [Table/Fig-1]. The MAP obtained was 86.51±5.03 while the PEFR was 7.82±1.17. A weak negative correlation was noted between BMI and PEFR, though not significant [Table/Fig-2]. A definite relationship between body mass and pulmonary function was noted. A strong positive correlation was found between MAP and PEFR (rpb=0.564, n=40, p<0.001) [Table/Fig-2,3].
Demographic data of study participants.
| Parameters | Males | Females |
|---|
| Age (years) | 33.21±6.32 | 32.09±7.18 |
| Gender | 27 (67.5%) | 13 (32.50%) |
| Parameters evaluated in the study |
| Parameters | Mean | Std. Deviation |
| Body mass index (kg/m2) | 29.56 | 5.20 |
| Mean arterial pressure (mmHg) | 86.51 | 5.03 |
| Peak expiratory flow rate (L/min) | 7.82 | 1.17 |
Correlation values between the parameters assessed.
| Parameters assessed | Correlation | p-value |
|---|
| BMI vs PEFR | -0.136 | 0.403 |
| MAP vs PEFR | 0.564 | <0.001** |
**Highly significant; Pearson correlation test
Relation between BMI and PEFR.
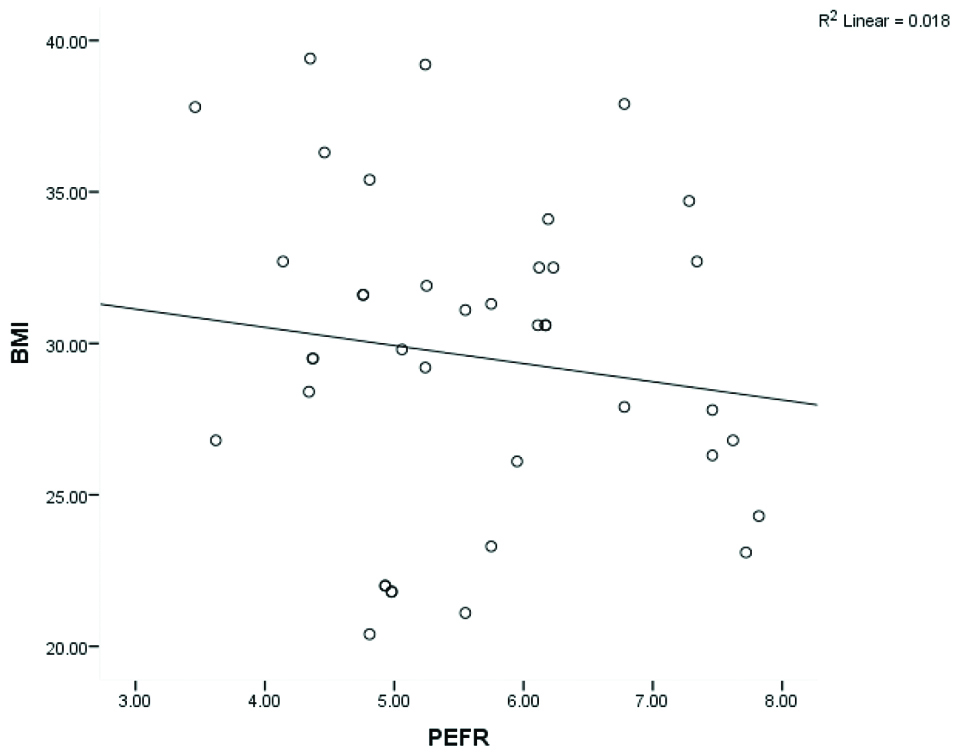
A negative correlation was observed in the categories of overweight and obese with PEFR [Table/Fig-4].
Correlation coefficients for each of BMI (Kg/m2) categories.
| BMI vs PEFR | Correlation | p-value |
|---|
| Underweight | 0.107 | 0.630 (NS) |
| Normal | 0.034 | 0.205 (NS) |
| Overweight | -0.122 | 0.322 (NS) |
| Obese | -0.149 | 0.515 (NS) |
P: Pearson correlation test
Discussion
Increasing body mass or being overweight poses a great health threat in developing countries. Though, it is just a condition in which extra fat or adipose tissue is accumulated, it co-exists with other conditions such as hypertension, diabetes mellitus etc., [14]. Impaired pulmonary function and airway hyper-responsiveness is also linked with increased adiposity. When adipose tissue gets deposited in the abdomen and chest cavity, it results in a compressive force on respiratory muscles and the lungs, as in obesity. The resultant effect is decreased chest wall compliance, reduced volumes and capacities [15,16].
The PEFR is a convenient tool to measure lung function in field studies. The present study aimed to assess the relation between BMI, MAP on PEFR in healthy individuals aged 18-35 years. A negative correlation was found between BMI and PEFR in the present study, with r=-0.136. This finding is in concordance with study conducted by Ajmani S et al., [17].
Study by Galphade S et al., also reported a negative relation of PEFR with BMI in 120 students aged 18-25 years, and belonged to overweight and normal categories of BMI [18]. The mean PEFR values in the present study were 7.82±1.17. Natarajan S and Radha K, conducted a study on 2060 healthy southern Indian men and women. They found that as age advanced beyond 35 years, a significant decline in PEFR values occur. Hence, age is yet another determining factor of PEFR in individuals [19].
Rubinstein I et al., reported air flow limitation in non-smoking, morbidly obese men in his study of obese men and women. They found a significant difference in PFT between obese and non-obese individuals [16].
The present study findings found that PEFR was directly related to MAP. A possible justification for this finding is that as blood pressure increased, lung compliance decreased which in turn limited venous return and cardiac output. Decreased venous return and cardiac output decreased systolic and diastolic blood pressure [20].
The MAP is a better indicator of tissue perfusion than blood pressure and was hence considered in this study. A 70 to 110 mmHg with a minimum of 65 mmHg is the widely accepted to provide sufficient perfusion to vital organs like the heart, kidneys and brain. MAP less than 65 mmHg for an extended period might compromise tissue perfusion and deprive the vital organs of oxygen. Infrared spectroscopy at the thenar eminence showed the importance of improving MAP in decreased MAP conditions such as sepsis [21].
Isaac N et al., reported a significant reduction of PEFR in their overweight group, thus depicting a clear association between BMI and respiratory function [22]. BMI offers a simple, affordable and non-invasive measure to assess obesity and/or overweight in a large group of people. Hence, this method was ascertained here and it’s correlation with respiratory and cardiovascular parameter was assessed [23,24].
This study used BMI as an anthropometric indicator, as it is considered to be a global indicator of body mass including fat and lean mass. But, it does not consider the distribution of fat in the human body. If lung volume reduction in obesity was a direct mechanical effect on lung volumes, then body fat distribution must have modified the relationship between lung volume and BMI. In that case, the theory of abdominal and thoracic fat bearing a downward diaphragm movement is supported, but the effect of fat on hips and thighs on lung volume will be refuted [25]. Despite this, BMI is still considered to be the gold standard to record obesity and overweight at the present times.
Limitation(s)
Owing to the cross-sectional study design, information regarding temporal association of cardiovascular changes on respiratory parameter or vice versa cannot be established.
Conclusion(s)
The present study confirms the association of increased body weight and MAP with PFTs. An increased MAP can serve as a screening index for cardiovascular and respiratory risk. Hence, health promotional activities such as weight reduction, lifestyle modification and physical exercises are to advise to decrease the chances of pulmonary and cardiovascular problems.
**Highly significant; Pearson correlation test
P: Pearson correlation test