Multiple Myeloma (MM) is a neoplastic plasma cell dyscrasia characterised by anaemia, monoclonal protein in serum, urine or both associated bone lesions, hypercalcaemia and renal insufficiency. It comprises of 1% of all types of malignancies and 10-15% of all haematological malignancies. It is common in men than women (1.4:1) [1,2].
The clinical manifestations are due to the tissue infiltration by plasma cells, secretion of the monoclonal proteins and impairment of immunity. Replacement of bone marrow by plasma cells and renal damage leads to anaemia which presents as pallor, fatigue etc. Bone pain is the presenting manifestation in 80% cases. There is an increase in osteoclastic bone resorption leading to marked impairment in bone formation [3]. Seventy five percent of the cases present punched out lytic lesions, osteoporosis or fractures on radiography. Vertebral collapse may lead to nerve root compression. As a result of bone destruction, 18-30% of cases are associated with hypercalcaemia [1,2,4].
Various investigations are required in order to diagnose and stratify the patients into good, intermediate and poor prognosis groups. The investigations traditionally used include peripheral blood smear, erythrocyte sedimentation rate, serum calcium, serum creatinine levels, serum albumin levels, bone marrow aspirate (myeloma cells are seen which vary from mature to immature, pleomorphic and plasmablastic forms). Along with this bone marrow biopsy is done, where plasma cells are seen in focal nodules, interstitial clusters and diffuse sheets. M-component on Serum Protein Electrophoresis and immunofixation electrophoresis are done to distinguish immunoglobulin classes, while skeletal survey for bone destruction, β2M levels [2,4].
But recently, cytogenetic abnormalities have emerged as powerful prognostic factors in myeloma. A combination of conventional cytogenetics and interphase Fluorescence In-Situ Hybridisation (FISH) is currently used to stratify tumours into high, intermediate and standard risk disease. Such stratification can help guide therapy. FISH is done for detection of t(11;14), t(6;14), t(4;14), t(14;16), t(14;20), del17p13, del13, 1q+, and trisomies of odd numbered chromosomes [2,4,5].
Very few studies have been done to evaluate morphology with cytogenetics. Thus, the present study was conducted to compare the morphological parameters with cytogenetic studies in patients with MM. Bone marrow morphology can predict the cytogenetic abnormality. Cytogenetics studies are must to prognosticate the MM.
Materials and Methods
This was a retrospective cross-sectional study which also included all cases during the study tenure prospectively, was conducted in the Department of Pathology, Dayanand Medical College and Hospital, Ludhiana for a period of 3.5 years (1st January 2014 to 30th June 2017). All cases diagnosed with MM during the study period, were analysed in regard to clinical features, laboratory parameters, biochemical profile, bone marrow morphology and cytogenetics. The study was approved by the ethical committee wide letter number BFUHS/2K16p-th/7712.
Inclusion criteria: All diagnosed cases of MM were included and clinical data with reference to signs and symptoms, relevant physical examinations and relevant investigations was recorded.
Exclusion criteria: All diagnosed cases of MM where cytogenetics was not available were excluded.
Geimsa stained peripheral blood smears, and bone marrow smears were analysed and morphologically categorised into mature plasma cells forms, immature forms and plasmablasts. Mature plasma cells were defined as cells with round to oval nucleus, spoke wheel chromatin and abundant basophilic cytoplasm with a perinuclear hof. Immature forms were defined as cells with more dispersed nuclear chromatin, a higher nuclear/cytoplasmic ratio and prominent nucleoli and cells with a diffuse chromatin pattern, nucleus greater than 10 microns or nucleolus greater than 2 microns, relatively less abundant cytoplasm, and a centrally placed nucleus with little or no hof were counted as plasmablasts. On the basis of number of plasmablasts, myeloma was classified as Plasmacytic (plasmablasts <15%), Plasmablastic (plasmablasts >50%) and Mixed (Plasmacytic/ Plasmablastic). Haematoxylin and Eosin stained bone marrow biopsy sections were analysed to see pattern of infiltration by plasma cells (nodular, interstitial or diffuse) [2,4].
Cytogenetic studies by FISH technique and GTG (Geimsa) banding were sent to outsource laboratories and reports were correlated. In FISH technique a panel was used for detecting deletion (del) 17p13, del13q14.3, t(4,14), t(11,14) and t(14,16).
Statistical Analysis
Detailed descriptive analysis was done using Chi-square test and ANOVA analysis. A probability value (p-value) less than 0.05 was considered statistically significant. All statistical calculations were done using (Statistical Package for the Social Science) SPSS version 21.0 (SPSS Inc., Chicago, IL, USA) statistical program for Microsoft Windows.
Results
During the study period a total of 3309 bone marrow aspirations were performed for various indications and further included as shown in [Table/Fig-1]. Further relevant clinical features, laboratory parameters, biochemical profile, bone marrow morphology and cytogenetic data were analysed.
Flowchart exhibiting flow of patients included.
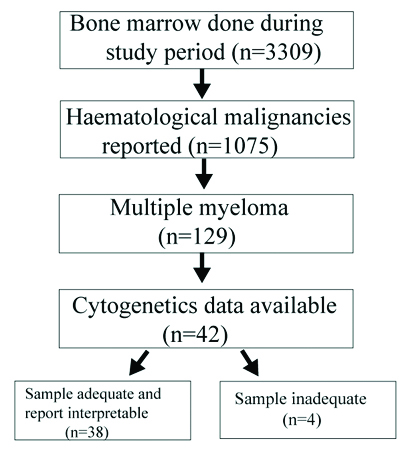
Cytogenetic studies: Cytogenetic studies were performed on 42 cases using FISH technique (n=31, 81.6%) and GTG (Giemsa) banding (n=4, 10.5%). Three (7.9%) patients got tested with both methods. Four patients (4/42) were unsatisfactory for opinion due to inadequate sample size. Fourteen (36.8%) cases were positive for del13q14.3 and only one (2.6%) case was found to be positive for t(11, 14). Nineteen (50%) cases had a normal genome by FISH as they were negative for all deletions and translocations. On GTG banding, 5 (13.2%) cases were detected with a normal karyotype. One case (2.6%) showed increase in heterochromatin in Y region and one case (2.6%) had a complex karyotype with both structural t(7,9) and numeric (hypodiploidy) abnormalities. Twenty two patients (22/38, 57.9%) had a normal genome of which two patients got tested by both FISH and GTG banding. Sixteen patients (16/22, 42.1%) showed an abnormal karyotype of which one patient positive for del13q by FISH had increase in heterochromatin in Y region with GTG banding [Table/Fig-2].
Distribution of cases on the basis of cytogenetic studies.
| Method | Cytogenetics | No. of patients (n=38)* | Percentage (%) |
|---|
| FISH(n=34)* | Normal genome | 19 | 50 |
| Positive for del13q14.3 | 14 | 36.8 |
| Positive for t(11, 14) | 1 | 2.6 |
| GTG Banding(n=7)* | Normal Karyotype | 5 | 13.2 |
| Increase in heterochromatin | 1 | 2.6 |
| Complex Karyotype | 1 | 2.6 |
*3 patients were tested by both FISH and GTG banding
Of the 14 cases positive for del13q14.3 by FISH technique, nine cases (64.3%) showed >50% plasma cells on Bone Marrow Aspiration (BMA), five cases (35.7%) had 20 to 50% plasma cells while none had <20% plasma cells. Also cases with complex karyotype (n=1, 100%) and increase in heterochromatin (n=1, 100%) had >50% plasma cells on BMA [Table/Fig-3].
Comparison of cytogenetics with percentage of plasma cells on bone marrow aspiration.
| Cytogenetics | Plasma cells | Chi-square value | p-value |
|---|
| <20% | 20-50% | >50% |
|---|
| No. | %age | No. | %age | No. | %age |
|---|
| FISH(n=34)* | Normal genome (n=19) | 1 | 5.3% | 6 | 31.6% | 12 | 63.2% | 0.703 | 0.702 |
| Positive for del13q14.3 (n=14) | 0 | 0.0% | 5 | 35.7% | 9 | 64.3% | 1.774 | 0.412 |
| Positive for t (11,14) (n=1) | 0 | 0.0% | 0 | 0.0% | 1 | 100.0% | 0.773 | 0.679 |
| GTG Banding(n=7)* | Normal Karyotype (n=5) | 1 | 20.0% | 1 | 20.0% | 3 | 60.0% | 0.796 | 0.672 |
| Increase in heterochromatin (n=1) | 0 | 0.0% | 0 | 0.0% | 1 | 100.0% | 0.773 | 0.679 |
| Complex Karyotype (n=1) | 0 | 0.0% | 0 | 0.0% | 1 | 100.0% | 0.773 | 0.679 |
*3 patients were tested by both FISH and GTG banding; Chi-square test applied
Of the 19 patients with normal genome by FISH and five patients with normal karyotype by GTG banding, none of the patients had plasmablastic morphology. All the patients (n=2,100%) with plasmablastic morphology who got tested with cytogenetics had del13q14.3 [Table/Fig-4].
Comparison of cytogenetics with morphological type of myeloma.
| Method | Morphological type of myeloma | Chi-square value | p-value |
|---|
| Plasmacytic | Plasma-blastic | Mixed (Plasmacytic/Plasmablastic) |
|---|
| No. | %age | No. | %age | No. | %age |
|---|
| FISH(n=34)* | Normal genome (n=19) | 14 | 73.7% | 0 | 0.0% | 5 | 26.3% | 2.223 | 0.329 |
| Positive for del13q.14.3 (n=14) | 8 | 57.1% | 2 | 14.3% | 4 | 28.6% | 0.949 | 0.622 |
| Positive for t (11,14) (n=1) | 1 | 100.0% | 0 | 0.0% | 0 | 0.0% | 0.597 | 0.742 |
| GTG Banding(n=7)* | Normal Karyotype (n=5) | 4 | 80.0% | 0 | 0.0% | 1 | 20.0% | 0.807 | 0.668 |
| Increase in heterochromatin (n=1) | 1 | 100.0% | 0 | 0.0% | 0 | 0.0% | 0.597 | 0.742 |
| Complex Karyotype (n=1) | 1 | 100.0% | 0 | 0.0% | 0 | 0.0% | 0.597 | 0.742 |
*3 patients were tested by both FISH and GTG banding; Chi-square test applied
Patients with increase in heterochromatin and complex karyotype on GTG banding showed diffuse pattern on bone marrow biopsy [Table/Fig-5].
Comparison of cytogenetics with pattern of infiltration on bone marrow biopsy.
| Cytogenetics | Nodular | Mixed | Interstitial | Diffuse |
|---|
| FISH(n=34)* | Normal genome (n=19) | 0 | 2 | 7 | 10 |
| Positive for del13q.14.3 (n=14) | 0 | 1 | 9 | 4 |
| Positive for t (11, 14) (n=1) | 0 | 0 | 1 | 0 |
| GTG Banding(n=7)* | Normal Karyotype (n=5) | 0 | 1 | 2 | 2 |
| Increase in heterochromatin (n=1) | 0 | 0 | 0 | 1 |
| Complex Karyotype (n=1) | 0 | 0 | 0 | 1 |
*3 patients were tested by both FISH and GTG banding
Of the 33 patients with Stage III disease, 21 patients had >50% plasma cells on BMA followed by 11 patients with 20 to 50% plasma cells and only one patient with <20% plasma cells with a p-value of 0.689. All patients (n=4, 100%) with plasmablastic myeloma had Stage III disease, followed by plasmacytic (n=22, 64.7%) and mixed (n=7, 50%) with a p-value of 0.435. Fourteen patients with Stage III disease had diffuse pattern of infiltration on BMB and fourteen patients had interstitial pattern [Table/Fig-6].
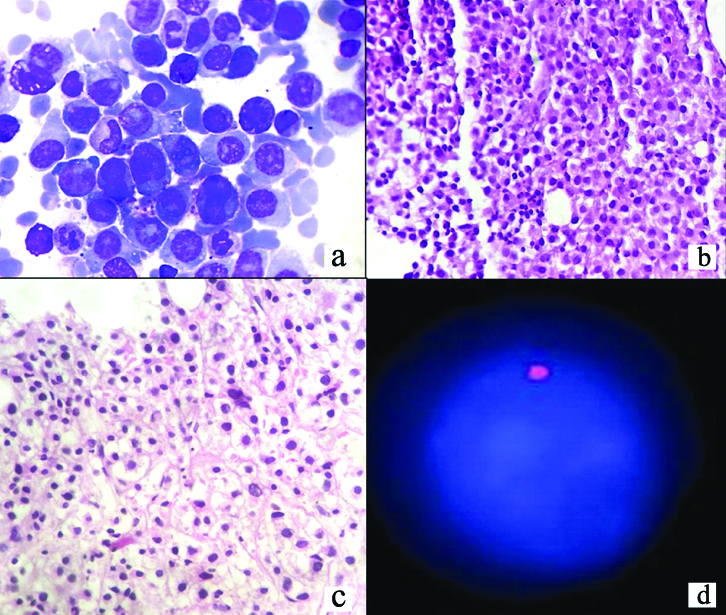
Case having (a) Plasmablastic morphology of Geimsa stained smears, [X400], (b) Diffuse infiltration of bone marrow biopsy [H&E stain, X40], (c) areas of fibrosis [H&E stain, X100] and (d) del13q (D).
Discussion
Multiple Myeloma, a plasma cell dyscrasia, accounts 10% of all haematologic malignancies. Each year over 20,000 new cases are diagnosed in the United States. MM is slightly more common in men than in women with 65 years being the median age at the time of diagnosis. Bone disease is the main cause of morbidity and can be detected on routine skeletal radiographs, Magnetic Resonance Imaging (MRI), or Fluorodeoxyglucose (FDG) Positron Emission Tomography/Computed Tomographic scans (PET/CT). Other major clinical manifestations are anaemia, hypercalcaemia, renal failure, and an increased risk of infections [2,4-6].
The diagnosis of MM requires 10% or more clonal plasma cells on bone marrow examination or a biopsy-proven plasmacytoma in addition to the presence of one or more Myeloma Defining Events (MDE). Bone marrow examination is essential not only for demonstration of plasmacytosis (as major criteria) but it also provides variable information regarding plasma cell morphology and infiltration pattern, which can help in determining the prognosis of the disease [2,4,5,7].
MDE consists of hypercalcaemia, renal failure, anaemia, or lytic bone lesions features along with clonal bone marrow plasma cells 60%, serum Free Light Chain (FLC) ratio 100, and more than one focal lesion on MRI [2,7].
Griepp PR et al., classified myeloma cells into mature, intermediate, immature and plasmablastic. Bartl R and Frisch B, had classified plasma cells into two categories: Plasmacytic-with predominantly non nucleolated PCs and plasmablastic-with predominantly nucleolated PCs [8,9].
In 2005, the International Staging System (ISS) for MM included parameters like Serum beta2-Microglobulin (Sbeta2M), serum albumin, platelet count, serum creatinine, and age as l predictors of survival [8].
However in 2015, this was updated and a Revised ISS was given which included cytogenetic abnormalities and LDH and defined the following three groups [8]:
Revised ISS (R-ISS) I, including ISS stage I (serum β2-microglobulin level <3.5 mg/L and serum albumin level ≥3.5 g/dL), no high-risk CA {del(17p) and/or t(4;14) and/or t(14;16)}, normal LDH level (less than the upper limit of normal range).
R-ISS III, including ISS stage III (serum β2-microglobulin level >5.5 mg/L) and high-risk CA or high LDH level.
R-ISS II, including all the other possible combinations.
The R-ISS is a simple and powerful prognostic staging system where both numerical and structural abnormalities were detected and included whole or partial chromosome deletions, translocations and complex cytogenetic abnormalities. The del17p, t(14,16), t(14,20) were considered high risk with an Overall Survival (OS) of three years. The t(4,14), del13 and hypodiploidy were considered intermediate risk with an OS of 4 to 5 years while t(11,14), t(6,14), hyperdiploidy and all others had standard risk with an OS of 8 to 10 years [8,9].
This rate of progression from premalignant lesions like MGUS, SMM to frank MM is influenced by the underlying cytogenetic type of disease; patients with t(4;14) translocation, del(17p), and gain(1q) are at a higher risk of progression from SMM to MM. The updated criteria allow early diagnosis and initiation of therapy before end-organ damage. When MM is suspected clinically, patients should be tested for the presence of M proteins using a combination of tests that should include a Serum Protein Electrophoresis (SPEP) test, Serum Immunofixation (SIFE), and the serum FLC assay. Bone marrow studies at the time of initial diagnosis should include work up for cytogenetic abnormalities using FISH and conventional karyotyping. FISH probes designed to detect t(11;14), t(4;14), t(14;16), t(6;14), t(14;20), trisomies, and del(17p) are essential. Conventional karyotyping detect hypodiploidy and deletion 13 has value, but if FISH studies are done, additional value in initial risk stratification is limited. Gene Expression Profiling (GEP) if available can provide additional prognostic value. PB MM represents a discrete entity in phase III trial E9486/E9487. It is an independent prognostic factor predicting shorter Event Free Survival (EFS) and Overall Survival (OS). A more frequently elevated level of PCLI, b2M, CRP, and creatinine, and a lower albumin level characterise PB MM as a more advanced and aggressive form of disease. Higher incidence of ras mutations and of elevations of sIL-6R suggests potential underlying mechanisms of aggressive behavior. Currently limited in use, PB classification of MM is potentially useful in practice and in clinical trials. Until more intensive therapy is definitively shown to be beneficial, we cannot conclude that it is a better approach for patients with PB MM [3,4,8-10].
Multiple Myeloma is characterised by cytogenetic heterogeneity which is an important prognostic indicator. In the present study, all the patients (n=2,100%) with plasmablastic morphology who got tested with cytogenetics had del13q14.3 and none of the patients with normal genome (n=22) had plasmablastic morphology. Thus, there is a correlation of plasmablastic morphology with del13q though the statistical significance could not be analysed because of small sample size. The same finding has corroboration by Moller HEH et al., where plasmablastic morphology was significantly associated with abnormal karyotype and del13q when detected by karyotyping, but not by FISH. They further corroborated that the high-risk aberrations del17p, t(4;14) and t(14;16) were not associated with plasmablastic morphology [12].
Of the patients positive for del13q (n=14) mean plasma cell percentage on BMA was found to be 64.64% and nine of these patients (64.28%) were found to have Stage III disease according to ISS Staging system. It was in accordance with Fonseca et al., who found statistically significant correlation of del13q and Stage III disease. However, Amare PSK et al., had similar observation in only 37% cases. The only patient with t(11,14) was found to have Stage III disease (1/1, 100%). However, Amare PSK et al., observed Stage III disease in 44% patients with t(11,14). These discrepancies can be due to small sample size of those who got their cytogenetics done due to bound financial constrains borne by the patients themselves [14,15].
Limitation(s)
The present study is limited by small number of patients and absence of clinical follow-up to evaluate the EFS and OS.
Conclusion(s)
In our study, we made an attempt to morphologically classify myeloma into Plasmacytic, Plasmablastic and Mixed (Plasmacytic/Plasmablastic) types and further correlate it with clinical and biochemical parameters, percentage of plasma cells on aspirate smears, stage of disease and cytogenetics. Cytogenetic studies have become an integral part of work up for MM patients for prognostification.
*3 patients were tested by both FISH and GTG banding
*3 patients were tested by both FISH and GTG banding; Chi-square test applied
*3 patients were tested by both FISH and GTG banding; Chi-square test applied
*3 patients were tested by both FISH and GTG banding