The most important part of fetomaternal unit is umbilical cord. “The baby’s life hangs by a cord”, as said by Ian Donald rightly states the importance of umbilical cord [1]. Umbilical cord abnormalities are associated with variable maternal and fetal outcomes. It is shown that umbilical cord abnormalities are associated in 22.5% of intrauterine fetal deaths [2]. The umbilical cord is the vital extension of the fetal circulatory system which regulates blood flow in both directions, thus allowing mother-child communications viz., immunological, oxygenation, fetal nutrition, cardiac function [2].
A coil is defined as complete 360° spiral twisting of umbilical vessels around the Wharton’s jelly. The total number of coils seen is between 0 and 40. Probable causes of coiling include fetal movements, active or passive torsion of the embryo [5], new differential vascular growth rates, fetal haemodynamic forces and muscular fibrils in arterial wall [6]. Strong TH et al., simplified and named it as “The UCI” [7]. The UCI is calculated by dividing the total number of coils by the total length in centimetres [8]. Increase in coiling level is associated with the adverse perinatal outcome, such as intrauterine fetal death, intrauterine growth restriction and fetal distress during labour.
Although pathogenesis of variability of umbilical cord abnormalities remains unclear, the aim was to study the association of umbilical cord abnormalities with maternal and fetal outcome.
Materials and Methods
This was a prospective observational study conducted in the Department of Obstetrics and Gynaecology at Saraswathi Institute of Medical Sciences (SIMS), Pilkhuwa, Hapur, Uttar Pradesh, India from June 2019 to March 2020. The approval for the study was taken by Institutional Ethical Committee (NO.SIMS/FMT/ETHI/7/19). Total number of deliveries during this period were 1284, out of which 1,053 were term deliveries.
Inclusion and Exclusion criteria: A total of 600 patients aged between 18-40 years and period of gestation of more than 37 weeks were recruited in the study at random, after taking prior informed consent who delivered either vaginally or by LSCS. Patients with malpresentation, multiple pregnancies, placenta previa or abruptio placenta, intrauterine fetal death were excluded.
Examination of cord was done during delivery for the presence of number of loops of cord around the neck or trunk, shoulders or limbs. Presence of knots, true or false was also noted.
After delivery of baby, cord was clamped and cut leaving 5 cm from the fetal end of cord. Cord was measured in centimeters (cm) with flexible tape from placental end without giving excessive traction on the cord and additional 5 cm added to the length. Less than 30 cm was labelled as short cord while >100 cm was included in long cord [9]. Numbers of coils were counted in total length of the cord, to calculate UCI (UCI=Total number of spirals or coiling/total length of cord in centimeters). The normal coiling index is 1 coil per 5 cm i.e., 0.2±0.1 completed coils per cm [10-12]. A UCI of less than 0.17 is accepted as hypocoiled and more than 0.37 is accepted as hypercoiled, and in between is normocoiled [10-13].
Umbilical cord was examined thoroughly for any abnormality, cyst or haematoma and type of insertion of cord was noted. Intrapartum factors like mode of delivery, neonatal parameters like Apgar score and NICU admissions were also noted.
Statistical Analysis
Descriptive stastistics was computed for all numerical data, in terms of percentage and mean. The significance was tested using Chi-square test. For all the statistical analysis, a p-value at <0.05 was considered to indicate as significant difference at 5% level of significance.
Results
In the study of 600 cases, umbilical cord abnormalities were seen in 194 (32.33%) patients, while in 406 (67.67%) patients no abnormality was detected in the cord. [Table/Fig-1] shows number of cases in different age groups. Maximum cases were in age group of 26-30 years (52.5%).
Age distribution of the participants.
| Age (years) | Number of total cases 600 | Percentage (%) |
|---|
| ≤20 | 80 | 13.33 |
| 21-25 | 124 | 20.67 |
| 26-30 | 315 | 52.5 |
| 31-35 | 47 | 7.83 |
| 36-40 | 34 | 5.67 |
Eccentric insertion was seen in maximum cases 436 (72.67%) followed by central insertion 102 (17%) and marginal 62 (10.33%). There was no case of velamentous insertion of cord. Mean UCI in this study was 0.25±0.09.
[Table/Fig-2] shows frequency of umbilical cord coiling. In 40 cases (6.67%) there was hypocoiling while hypercoiling was seen in 32 (5.33%) cases.
| Coiling | Number of cases (%) | Mean UCI |
|---|
| Hypocoiled | 40 (6.67) | 0.11±0.03 |
| Hypercoiled | 32 (5.33) | 0.38±0.03 |
| Normocoiled | 528 (88) | 0.26±0.03 |
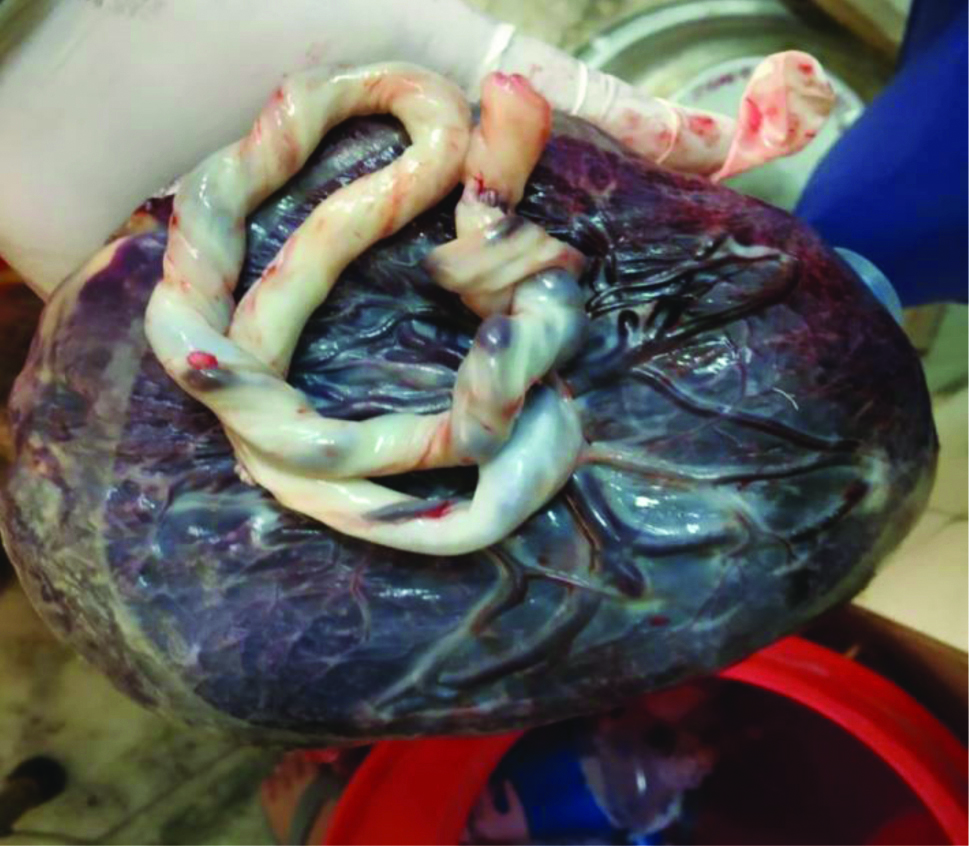
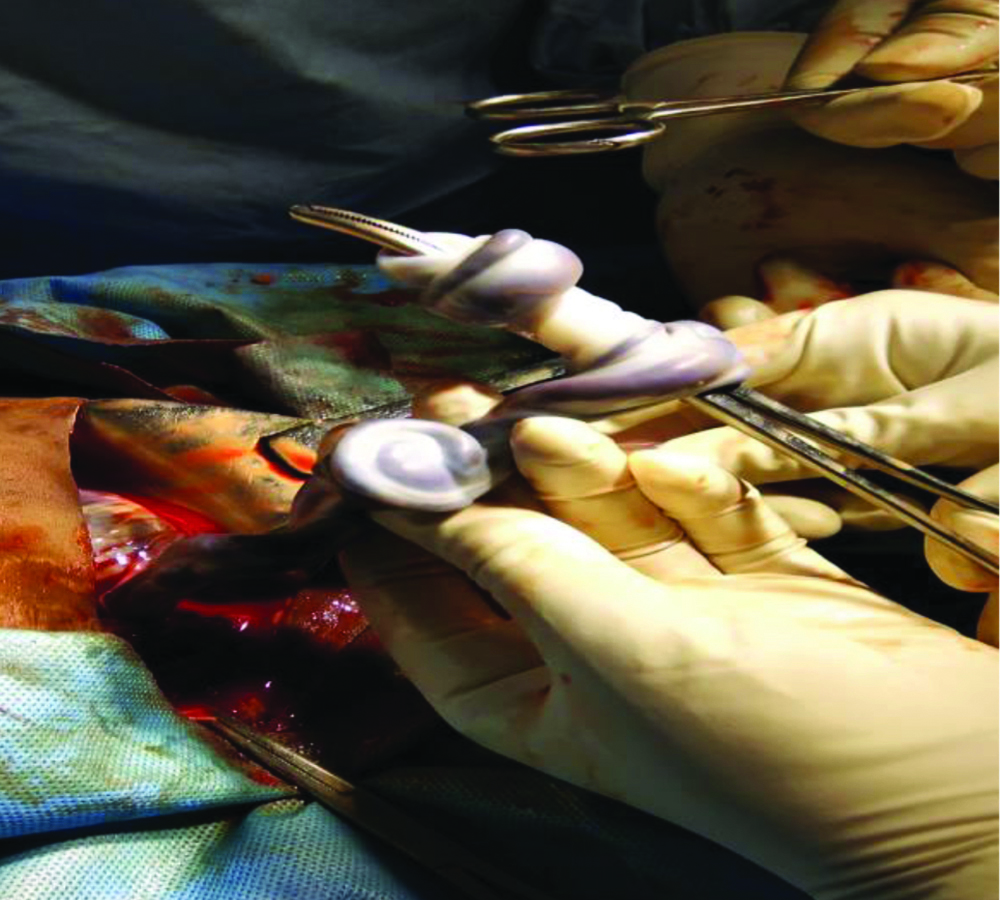
[Table/Fig-3] shows distribution of cases according to length of umbilical cord. Short cord was seen in 68 (11.33%) cases, while long cord was seen in 64 (10.66%) cases. The average cord length in this study was 59.14±12.46 cm. Nuchal cord, true knots were associated with higher mean cord length of 81±11.93 cm. [Table/Fig-4] shows image of true knot in umbilical cord following vaginal delivery and [Table/Fig-5] shows false knot in umbilical cord during vaginal delivery.
Frequency of umbilical cord length.
| Length of cord | Number of cases (%) | Mean cord length (cm) |
|---|
| Short cord | 68 (11.33) | 21.5±5.34 |
| Long cord | 64 (10.66) | 102.59±13.36 |
| Normal cord length | 468 (78) | 53.33±9.43 |
Image showing placenta and umbilical cord with presence of true knot.
False knot in umbilical cord during vaginal delivery.
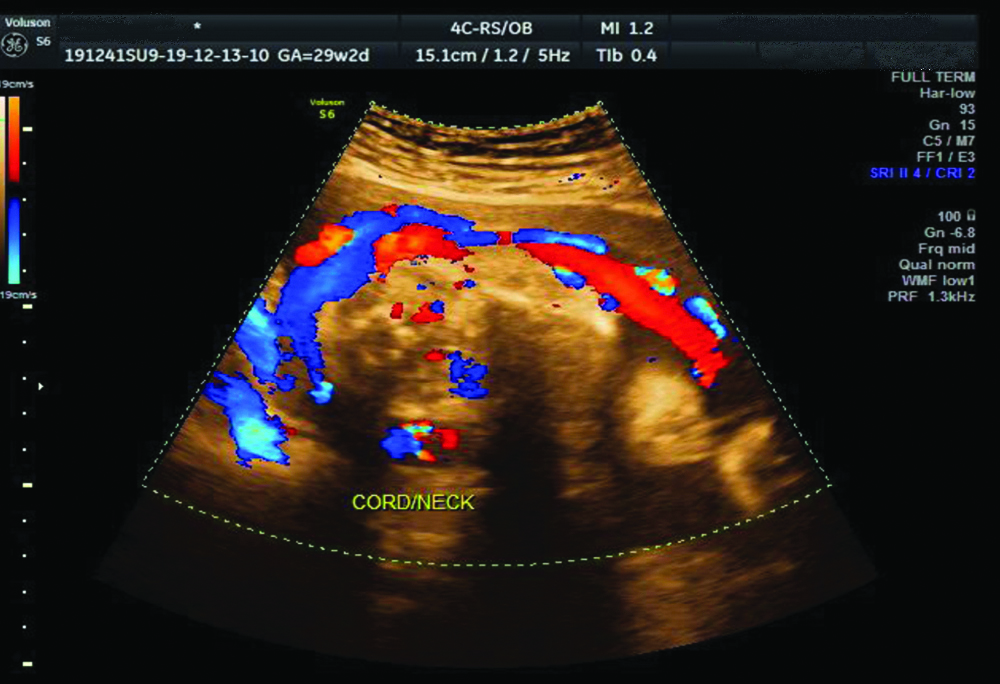
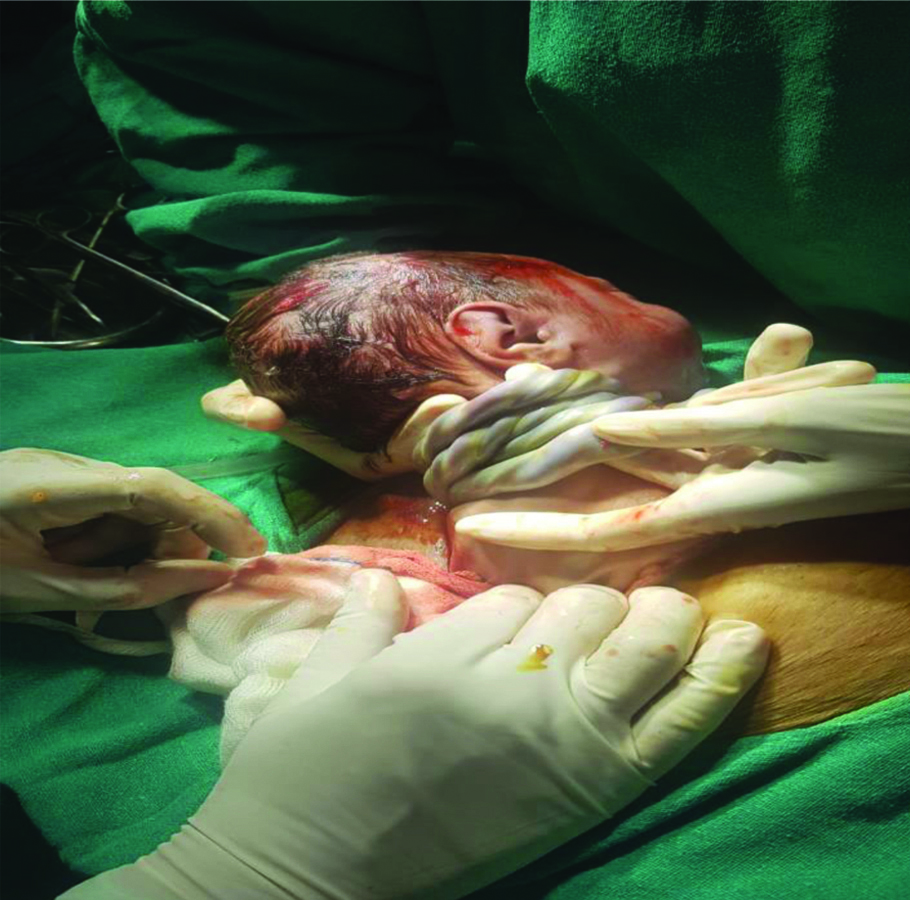
[Table/Fig-6] shows frequency of association of length of cord with other cord abnormalities. There was no case of cord prolapse or cord hematoma in the study. [Table/Fig-7] shows ultrasound image with colour Doppler of single loop of cord round the neck during antenatal period. [Table/Fig-8] shows per-operative image during LSCS showing four loops of cord around the neck.
Cord complications according to length of umbilical cord.
| Umbilcal cord length | Cord complications |
|---|
| No. of cases | Nuchal cord | True knot | False knot | Cord entaglement | Total |
|---|
| One loop | Two or three loop |
|---|
| Short cord | 68 | 9 | 1 | 0 | 5 | 0 | 15 |
| Long cord | 64 | 29 | 12 | 1 | 6 | 11 | 59 |
| Normal cord | 468 | 56 | 3 | 2 | 11 | 15 | 87 |
| Total | 600 | 94 | 16 | 3 | 22 | 26 | 161 |
Showing ultrasound image with colour Doppler of single loop of cord round the neck.
Per-operative image during LSCS showing four loops of nuchal cord.
Vaginal delivery was seen in 441 cases, (73.5%) while 159 cases (26.5%) had Cesarean delivery. [Table/Fig-9,10] show incidence of various umbilical cord abnormalities in vaginal and Cesarean deliveries, respectively.
Incidence of umbilical cord abnormalities in vaginal deliveries (n=441).
| S. No. | Umbilical cord abnormalities | Number of cases in vaginal delivery | Percentage (%) |
|---|
| 1 | Short length | 39 | 8.84 |
| 2 | Normal length | 374 | 84.8 |
| 3 | Long length | 28 | 6.35 |
| 4 | False knot | 15 | 3.4 |
| 5 | True knot | 1 | 0.22 |
| 6 | Hypocoiled | 17 | 3.85 |
| 7 | Normocoiled | 410 | 92.97 |
| 8 | Hypercoiled | 14 | 3.17 |
| 9 | Nuchal cord (one loop) | 78 | 17.68 |
| 10 | Nuchal cord (two or three loops) | 5 | 1.13 |
| 11 | Cord entanglement | 11 | 2.49 |
Incidence of umbilical cord abnormalities in LSCS deliveries (n=159).
| S. No. | Umbilical cord abnormalities | Number of cases in LSCS deliveries | Percentage (%) |
|---|
| 1 | Short length | 29 | 18.23 |
| 2 | Normal length | 94 | 59.11 |
| 3 | Long length | 36 | 22.64 |
| 4 | False knot | 7 | 4.4 |
| 5 | True knot | 2 | 1.25 |
| 6 | Hypocoiled | 23 | 14.46 |
| 7 | Normocoiled | 118 | 74.21 |
| 8 | Hypercoiled | 18 | 11.32 |
| 9 | Nuchal cord (one loop) | 16 | 10.06 |
| 10 | Nuchal cord (two or three loops) | 11 | 6.91 |
| 11 | Cord entanglement | 15 | 9.43 |
In patients who had umbilical cord abnormality (194 cases), 89 (45.87%) had LSCS, as compared to only 70 cases (17.24%) had LSCS out of 406 cases who had no abnormality of cord as shown in [Table/Fig-11].
Association of LSCS with umbilical cord abnormality.
| Cases with umbilical cord abnormality | No. of LSCS | Percentage (%) | p-value |
|---|
| Yes | 89 (Total 194) | 45.87 | <0.0001 |
| No | 70 (Total 406) | 17.24 |
Total 269 cases (44.83%) had maternal complications in this study out of which 143 cases (53.16%) were associated with umbilical cord abnormalities. [Table/Fig-12] shows distribution of cases with maternal complications in umbilical cord abnormalities group.
Incidence of maternal complications in cases with umbilical cord abnormalities.
| Maternal complications | No. of cases with cord abnormality (Total 194) | Number of cases with no cord abnormality (Total 406 cases) |
|---|
| Anaemia | 63 (32.47%) | 64 (15.76%) |
| Preeclampsia | 56 (28.86%) | 23 (5.66%) |
| GDM | 6 (3.09%) | 5 (1.23%) |
| Others | 18 (9.27%) | 34 (8.37%) |
| No maternal complication | 51 (26.28%) | 280 (68.96%) |
GDM: Gestational diabetes mellitus
[Table/Fig-13] shows incidence of Apgar score at 1 minute in cases with umbilical cord abnormalities. A 22.16% cases of cord abnormality group had Apgar score less than 7, as compared to 10.1% cases with no cord abnormality (p-value <0.0001).
Apgar score at 1 minute in cases with umbilical cord abnormality.
| Apgar score at 1 min | Number of cases with cord abnormality (Total 194) | Number of cases with no cord abnormality (Total 406 cases) | p-value |
|---|
| ≥7 | 151 (77.84%) | 365 (89.9%) | <0.0001 |
| <7 | 43 (22.16%) | 41 (10.1%) |
[Table/Fig-14] shows neonatal unit admissions in cases with cord abnormality and with no cord abnormality. In this study, there were total 51 Neonatal unit admissions (8.5%) out of which 23 had umbilical cord abnormalities (p-value <0.0416). There was no still birth in the study.
Incidence of Neonatal admissions with cord abnormality.
| Neonatal admissions (Total 51 cases) | Number of cases with cord abnormality (Total 194) | Number of cases with no cord abnormality (Total 406 cases) | p-value |
|---|
| Yes | 23 (11.86%) | 28 (6.9%) | 0.0416 |
| No | 171 (88.14%) | 378 (93.1%) |
Discussion
The data from this study demonstrate that umbilical cord abnormalities are associated with increased incidence of LSCS, low Apgar score and increase in NICU admissions.
The length of umbilical cord varied considerably between 10 to 300 cm [14,15]. In a study by Blanc WA, the average length of the cord is between 50-60 cm [16]. The study was also comparable to the findings of Malpas P where the maximum cord length was between 46 and 79 cm [15]. In a similar study by Balkawade NU and Shinde MA, maximum cases were seen between 50-60 cm [9]. Similar to these studies’ average length of cord in the study is 59.14±12.46 cm.
In study of “minimum cord length to allow spontaneous vaginal delivery” by LaMonica GE et al., it stated that the uterine axis and the birth canal are not so long as to impede spontaneous vaginal delivery in the presence of short umbilical cord [17].
In the present study, there was significant increase in incidence of LSCS in cases with umbilical cord abnormality 45.87% as against 17.24% incidence in normal cord group. In the present study, long cord was more associated with nuchal cord loops and cord entanglements. The study by Rayburn WF et al., and Greenhill JP, showed statistically significant association of cord complications with increasing in cord length [18,19]. Sarwano E et al., showed that risk of complications increased linearly with cord length [20].
Eccentric insertion of the cord is a common finding. In Fox series [21] it was seen in 62% cases, while in this study it was seen in 72.67% cases
The mean UCI in this study was 0.25±0.09 which was similar to the study done by Ezimokhai M et al., where mean UCI was 0.26±0.09 [11]. Another study by Strong TH et al., had mean UCI 0.21±0.07 [10]. In this study, caesarean deliveries had significant association (p-value <0.0001) with hypocoiled cords (14.46%) as compared to vaginal deliveries (3.85%). Many authors have found positive correlation of operative delivery and hypocoiling [7,22]. Adequate coiling prevents compression of cord, hypocoiling may result in reduced fetoplacental circulation due to compression. Similarly, hypercoiling predisposes to more kinking and torsion of cord again interfering in fetoplacental circulation, can possibly explain increased incidence of operative interference.
In the study, anaemia had association with umbilical cord abnormalities in 32.47% cases as against 15.76% with no cord abnormality. No significant association of anaemia was found in previous studies. This study shows association of preeclampsia with umbilical cord abnormalities especially hypocoiling in 28.86% cases as against 7.39% cases in no cord abnormality group.
The coiled umbilical cord has elastic properties, which are able to resist forces that might compromise the umbilical vascular flow. This might explain the association of hypo-coiling with preeclampsia.
In the study, an initial low Apgar score <7 at 1 minute was found in 22.16% with umbilical cord abnormality and in 10.1% cases with no cord abnormality. Spellacy WN et al., showed that all cord complications showed significantly low Apgar scores at 1 minute [22]. Similar result was obtained by Kashanian M et al., [23]. Shrestha NS and Singh N studied Nuchal cord and perinatal outcome [24]. Neonatal outcome was analysed by Apgar score at 1 and 5 minute and the need for neonatal unit admission. Apgar score <7 at 1 minute was present in 24.78% (n=29) of new-borns in the study group and 14.68% (n=58) of newborns in control group similar to the present study. Thus, the present study shows significant association of umbilical cord abnormalities with adverse maternal and perinatal outcomes.
Limitation(s)
Due to the study design which was observational in nature, it was susceptible to observer bias and confounding and cannot be used to demonstrate causality or making generalisations. Considering the wide spectrum of umbilical cord abnormalities in large group of patients, it was difficult to address all aspects of umbilical cord abnormalities into a single observational study. The strength of the study being less complex and cost-effectively with the requirement of minimal skill.
Conclusion(s)
The present study supports the association of umbilical cord abnormalities with the adverse maternal and perinatal outcome. The findings also support increased incidence of operative interference, in the form of LSCS and low Apgar score at 1 minute. The study shows the importance of awareness and knowledge of cord abnormalities and associated complications. There is scope of a lot of research in this area to detect and avoid complications arising due to cord abnormalities. The challenge should be taken up and further research in the arena is required, to develop newer equipments to detect cord complications during the antenatal period so that appropriate measures can be taken to reduce perinatal morbidity and mortality.
GDM: Gestational diabetes mellitus