The liver has unique capacity of regeneration hence, suitable for transplantation. In case of partial liver grafts as well as living donor liver transplantation, the important points to be considered are hepatic venous and arterial anatomy, the SLV and the anticipated graft size. An accurate SLV estimate is basically used to predict the liver graft volume, which is critical to prevent small-for-size syndrome in the recipient and to ensure an adequate remnant liver volume in the donor. The estimation can be useful for surgical planning for resection of tumours and it is also an important component in pharmacokinetic studies [1]. SLV estimation on the basis of patient characteristics such as BSA and Body Weight (BW), is a good reflection of the hepatic metabolic demands of an individual patient [2]. Though the gold standard for assessment of liver volume is CT Volumetry [3] and MRI volumetry [4-6] in day-to-day practice of liver volume measurement by both manual and semiautomated methods, clinicians mostly perform percussion technique during their physical examinations to quickly assess the size of the liver [5,7]. MRI and CT have both been shown to be reliable and valid in estimation of hepatic volumetry by both manual and semiautomated methods, but these are costlier to perform and have limited availability [8]. CT is additionally associated with it the risk of ionising radiation leading to an increased risk of cancer with each subsequent scan [9]. MRI causes issues of claustrophobia and is contraindicated in the first three months of pregnancy, and in patients with any metal within their body, such as pacemakers, defibrillation devices or cochlear implants [10].
In a well-designed and high standard study of Pomposelli JJ et al., sixteen SLV formulae have been identified in the literatures and were used to calculate SLV with each donor’s demographic and anthropometric data [1]. Most of these formulae use simple subject-specific parameters such as age, sex, weight, and height. BSA was calculated with either the Du Bois-Du Bois formula or Mosteller’s formula. In this valuable study, it was opined that Johnson TN et al.’s formula provided very accurate results in terms of the absolute volume with respect to Software Assisted Image Processing (SAIP). Johnson TN et al., performed a meta-analysis predicting liver size in children and adults to develop their formula [11]. Although no single formula provided a perfect fit with all their statistical analysis, they found that Johnson TN et al., formula was the most accurate in terms of the absolute volume over a wide range of liver volumes and had a relatively low percentage error [1].
Due to the ever-increasing need for a simple, uncomplicated, reliable and valid technique that can be used to measure the liver using 2D ultrasound and a reference value to differentiate between a normal liver and liver with hepatomegaly, Childs JT et al., derived a set of three easy sonographic measurement planes: an antero-posterior diameter and another dome to tip diameter of the right lobe of liver along with the third measurement of liver in the midline sagittal plane [12]. In a later study of 2015 these three sonographic measurements were correlated with CT findings and almost perfect agreement between these two modalities was obtained [13]. The efficiency and accuracy of linear 2D ultrasound in hepatic volume assessment was reliably established by another similar study of Farghaly S et al., [8].
Evaluating liver volume with 2D ultrasound is now very popular among clinicians. Comparison with gold standard CT volumetry is available on literature search. There are very few studies which compare it with formula based liver volume. The aims and objectives of this research project was to estimate liver volume using 2D ultrasound, especially among our Eastern Indian population and to compare with a standard well-established SLV method based on Johnson TN et al., formula. This knowledge will be of great help for surgeons as well as physicians treating their patients.
Materials and Methods
This was a cross-sectional study and total duration of the study was 10 weeks (from August-October 2020) of which eight weeks was for data collection and two weeks for compilation and analysis.
Inclusion criteria: Patients were selected (purposive sampling technique) by the physician from general OPD pool and clinically screened out and were sent for liver function test to detect any liver function abnormality.
Exclusion criteria: Participants were excluded if age <20 or >60 years, or who had a current or past medical history of liver diseases or abnormal liver function tests.
Sample size calculation: Sample size was calculated based on the technique suggesting a sample size of 100 would give an accuracy of ±92 cm3 with 95% confidence and a Standard Deviation (SD) of 472 [14]. A sample of 150 participants was recruited.
Study Procedure
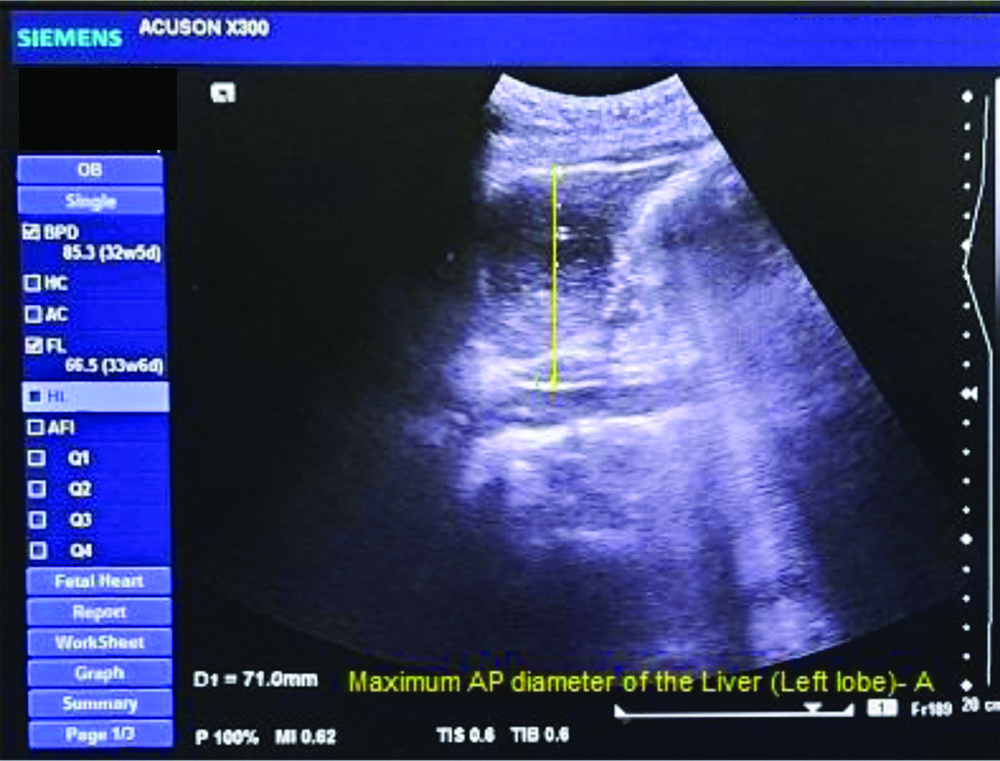
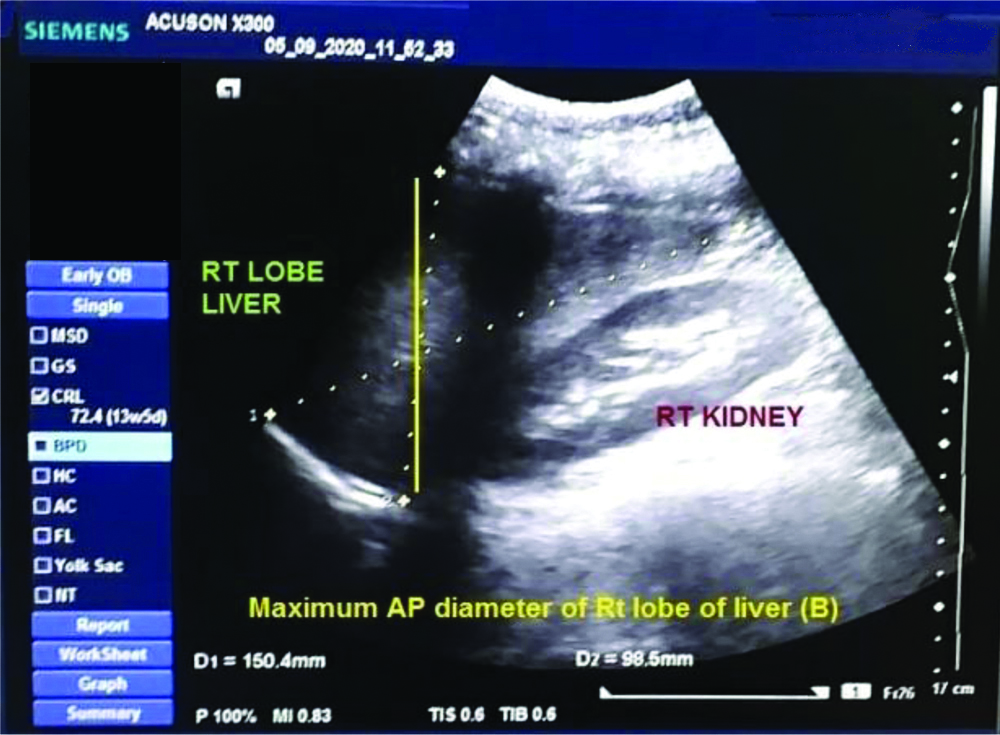
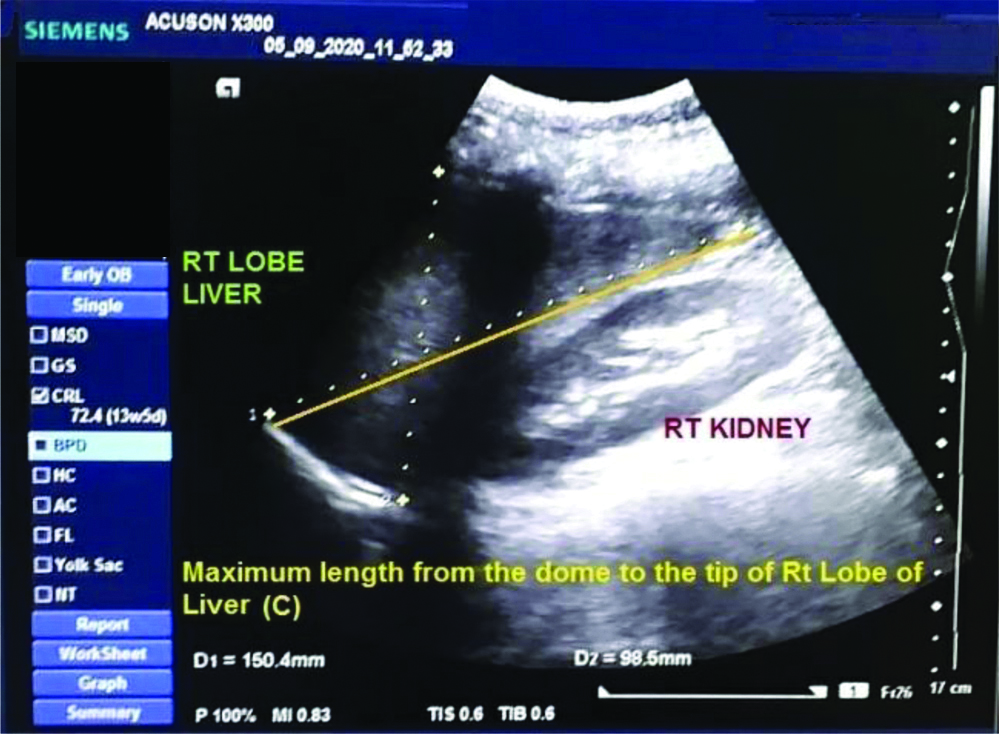
Images were taken on a Siemens Ultrasound System (ACUSON X300) set to an abdominal imaging protocol, with a C9-4 curved array transducer. After optimising scanning parameters (depth, gain and time gain compensation) for each patient, the patients were placed on an ultrasound table in 45° left lateral decubitus while the sonographer stood on the right side of the patient and images were captured in full inspiration. Two images of liver were acquired in this position on each patient. The [Table/Fig-1] was taken with the transducer orientated sagittally in the midline in a plane in line with the patient’s xiphisternum. The [Table/Fig-2] was taken with the transducer placed longitudinally in a plane in line with the midpoint of the patient’s clavicle (mid-clavicular line). This image showed the right lobe of the liver. One measurement was made from Image 1, and two measurements were made from Image 2 using the machine’s inbuilt calipers. The measurement taken from Image 1 was a linear measurement of the maximum anterior to posterior diameter of the liver (measurement A), shown in [Table/Fig-1]. The two measurements taken from Image 2 were a linear measurement of the maximum anterior to posterior diameter of the liver in this image (measurement B) shown in [Table/Fig-2] and another linear measurement from the dome to the tip of the right lobe of the liver was taken (measurement C), both are shown in [Table/Fig-3]. For the linear measurements individually, the mean (SD) for measurement A was 7.211 (0.764) cm, the mean (SD) for measurement B was 8.412 (0.835) cm and for C was 14.08 (1.063) cm.
Linear measurement (sagitally) of the maximum anterior to posterior diameter of the liver (Measurement A).
Linear measurement (longitudinally) of the maximum anterior to posterior diameter of the liver in this image (Measurement B).
Linear measurement from the dome to the tip of the right lobe of the liver was taken (Measurement C).
Following Childs JT et al., study, these three measurements were used to estimate liver volume using the following equation: liver volume (cm3)=343.71+(0.84×ABC), where ‘A’ denotes the maximum AP diameter of the Left (Lt) lobe of liver and ‘B’ and ‘C’ denote the maximum AP diameter of the Right (Rt) lobe of liver and length from the dome to the tip of the Rt lobe of liver successively [14]. Using this equation, we calculated SLV (in this study we referred it as estimated liver volume) sonographically, both meaning the same concept. This formula to calculate liver volume in terms of least deviation from the actual liver volume in Child JT et al., formula which has also been supported by the study Izranov V et al., in the year 2018 [15]. Formula used was: Liver volume={(BSA0.5×0.72)+0.171}3 for calculating SLV based on BSA (Du Bois-Du Bois formula) as per the well-designed meta-analysis of Johnson TN et al., and was evaluated by Pomposelli JJ et al., to achieve highest precision of detecting liver volume in adults [1].
Statistical Analysis
Data were collected by the principal investigator with the help of a radiologist in the Department of Radiology of the medical college. After compilation, data were analysed with the software SPSS version 17. Demographic variables were tested with t-test and chi-square test, when appropriate. Variances in liver volumes in two methods of measurement utilised F test. Bivariate correlation between two estimated volumes which indicates direction and magnitude of linear relationship were performed. Graphical representation in the form of scatter plot diagram will show such relationship. A regression model based on different body parameters of the study participants was derived to predict liver volume. Approval from the Ethics Committee (IEC) of Raiganj Government Medical College and Hospital, West Bengal, India (Letter no. IEC.02/2020 dated 05.08.2020) was taken prior to the commencement of the study. Written consent forms both in English and local language were signed by those agreeing to participate in the study.
Results
One hundred fifty patients were started of with both sexes and liver volume assessment was done with 2D ultrasound. Age varied between 20-60 years (mean 38.89 years), mean weight 53.93 kg, mean height 156.15 cm, and mean BSA was 1.52 m2. Mean liver volumes estimated in 2D ultrasound method was 1068.07 cc, SD 155.173 cc and based on Johnson et al.’s formula 1193.14 cc, SD 148.286 cc. Variances in two methods of measurement was statistically insignificant (F=1.095, df1=149, df2=149, p=0.29) [Table/Fig-4]. Differences between the two methods of measurements (Diff) were statistically significantly different from zero using one sample t-test (t=10.92, degree of freedom=149, p<0.0001) which implies that there is no agreement between the two.
Baseline characteristics of study participants.
| Parameters | N | Minimum | Maximum | Mean | Std. Deviation |
|---|
| Age (in years) | 150 | 17 | 65 | 38.89 | 13.872 |
| Weight (in Kg) | 150 | 32 | 79 | 53.93 | 8.782 |
| Height (in cm) | 150 | 137 | 173 | 156.15 | 7.689 |
| BSA (in M2) | 150 | 1 | 2 | 1.52 | 0.150 |
| SLV Formula (cc) | 150 | 804 | 1909 | 1193.14 | 148.286 |
| SLV USG (cc) | 150 | 708 | 1524 | 1068.07 | 155.173 |
| Valid N (listwise) | 150 | | | | |
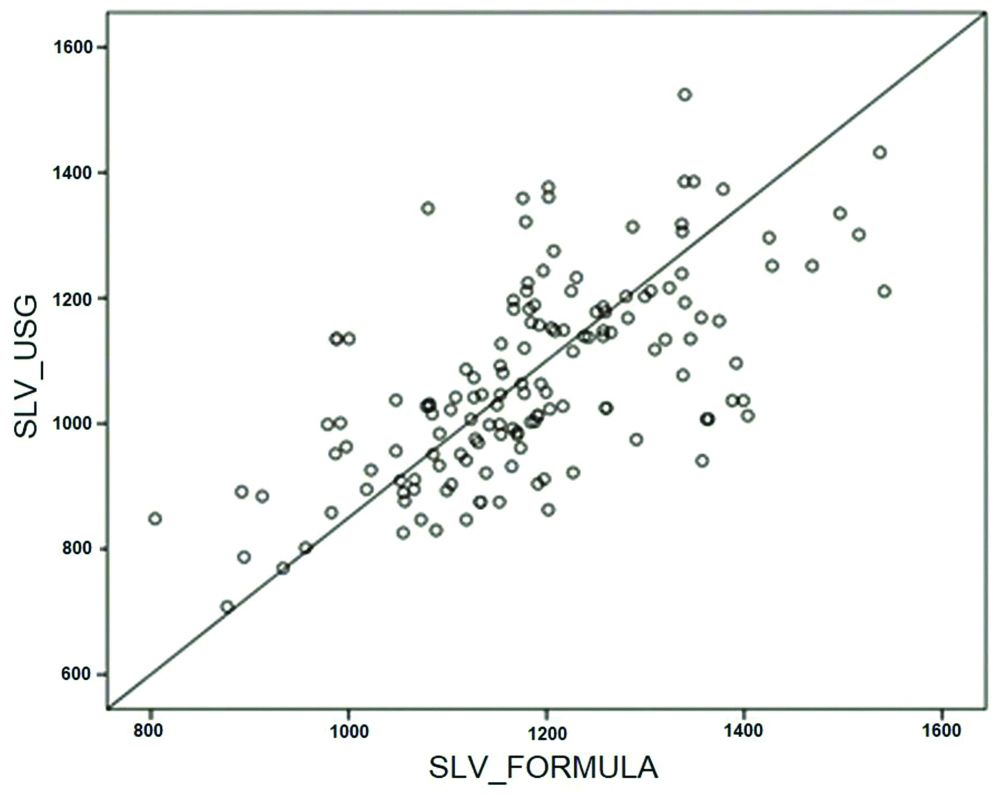
Liver volume based on ultrasonography method and different body indices was found to be correlated. There was good correlation between two volumes of measurement (r=0.574, p<0.01). Scatter plot shows good correlation and linear relationship [Table/Fig-5].
Scatter plot diagram showing linear relationship.
Correlation of SLV USG with weight, height, BSA and SLV Formula were significant at alpha level 0.01 (two tailed) [Table/Fig-6]. A multivariate regression analysis was carried out for estimating liver volume where independent variables were weight, height and BSA. Age and gender were excluded from the equation as their contribution was not significant (insignificant beta coefficient). Assumption of no multicollinearity met among the independent variables, tolerance value of 10 or less are cited as problematic (although 20 has also been suggested). Tolerance is the percentage of variance in the independent variable that is not accounted for by the other independent variables. Regression model was statistically significant where BSA has a significant contribution. Considering demographic characteristics, our regression equation came to be the following: Liver volume=158.57+8.78×weight+1.98×height+83.19×BSA.
Correlations between age, weight, height, BSA and SLV†.
| Tests | Age | Weight | Height | BSA | SLV Formula | SLV USG |
|---|
| Age | Pearson correlation | 1 | 0.208* | 0.283** | 0.232** | 0.224** | 0.174* |
| Sig. (2-tailed) | | 0.011 | 0.001 | 0.004 | 0.006 | 0.033 |
| Weight | Pearson correlation | 0.208* | 1 | 0.459** | 0.875** | 0.868** | 0.612** |
| Sig. (2-tailed) | 0.011 | | 0.001 | 0.001 | 0.001 | 0.001 |
| Height | Pearson correlation | 0.283** | 0.459** | 1 | 0.654** | 0.644** | 0.379** |
| Sig. (2-tailed) | 0.001 | 0.001 | | 0.001 | 0.001 | 0.001 |
| BSA | Pearson correlation | 0.232** | 0.875** | 0.654** | 1 | 0.999** | 0.579** |
| Sig. (2-tailed) | 0.004 | 0.001 | 0.001 | | 0.001 | 0.001 |
| SLV formula | Pearson correlation | 0.224** | 0.868** | 0.644** | 0.999** | 1 | 0.574** |
| Sig. (2-tailed) | 0.006 | 0.001 | 0.001 | 0.001 | | 0.001 |
| N | 150 | 150 | 150 | 150 | 150 | 150 |
| SLV USG | Pearson correlation | 0.174* | 0.612** | 0.379** | 0.579** | 0.574** | 1 |
| Sig. (2-tailed) | 0.033 | 0.001 | 0.001 | 0.001 | 0.001 | |
| N | 150 | 150 | 150 | 150 | 150 | 150 |
†Bivariate correlation; *Significant at the 0.05 level (2-tailed); **Significant at the 0.01 level (2-tailed)
Discussion
In present study, liver volume assessment by ultrasonography was well correlated with formula based volume estimation which is evident on scatter plot. Variances in two methods of measurement was statistically insignificant. Though the volumes in two method showed good correlation, their mean volumes were statistically significant. No agreement was found between these volumes. Body parameters were correlated with liver volume estimated with 2D ultrasound. In the predictive model, weight, height and BSA were significant predictors. Age and sex did not influence volume significantly.
Study by Chandramohan A et al., compared Total Liver Volume (TLV) with three formulae base SLV. They included only male participants where median age range was 10-70 years in contrast to 20-60 years of either sex in this study. Other parameters were similar. TLV was 1186 cc (639.3-2359.4) whereas in our case volume was 1068 cc (708-1524 cc) in ultrasonographic method and 1193 cc (804-1909 cc) as per the formula based method. TLV as measured by CT and the BSA were well correlated [2]. We found good correlation not only between methods but also weight, height and BSA with USG based volume. When compared, SLV obtained by the three formulae and TLV measured by CT were statistically highly significant, though there was close agreement with each other. They obtained regression models from study population based on weight and BSA being significant predictors [2]. Mean difference between the two methods in present study was statistically significant and the two methods did not show any agreement. In addition to weight and height, our predictive model included BSA and found to be a good predictor.
A study was carried out by Childs JT et al., with 126 participants using ultrasonography for estimation of liver volume, where there were 87 (69%) women and 39 (31%) men with ages ranging from 19-78 years with a mean (SD) age of 37 (12.8) years [14]. Liver volume measurements ranged from 979-2413 cm3 which supports the ultrasonography based liver volume. In another article by Izranov VA et al., the average liver volume was calculated using formula of Childs JT et al., and found to be 1355±487 (range 668-2631) mL [15]. Our 2D ultrasound method shows range between 708-1524 cc.
Farghaly S et al., included 100 patients with equal proportion of male and female in their study and compared liver volumes estimated by both USG and semiautomated MSCT [8]. Age ranged from 28-77 years, and the mean age was 50.58 years. The liver volume was estimated for each case by both U/S and semiautomated MSCT. The average liver volume by USG was 1572.10±326.43 cm3, while the average liver volume by semiautomated CT was 1559.30±381.02 with no statistically significant difference found between both (p>0.05). Average liver volume in two different age groups (less than 50 years and more than 50 years) was not statistically significant. Volume measurement was similar in both sexes. Both techniques were highly correlated with value of r was 0.7402 (Pearson correlation coefficient) which in present study was 0.574.
Sharma M et al., evaluated liver volume using CT scan where 100 subjects (62 males and 38 females) were analysed [16]. Their mean age was 48.33±10.87 years, mean BW was 62.06±8.84 kg, mean body height was 1.59±0.05 m, and mean BSA was 1.58±0.11 M2. Liver volumes were correlated with body indices age, height though there were sex variation. Age showed a relatively greater correlation. In their regression model, age and height were found to be good predictors of liver volume. Current study with ultrasonography was nearly similar in all respects except for BSA in addition to weight and height in prediction model. Age and sex had insignificant contribution in the linear regression model.
Study from north India by Agrawal D et al., recruited a total of 337 subjects with male and female in equal proportion [17]. Their mean age, weight, and BSA was more or less similar to present study observation. Mean liver volume was estimated to be 1,445.20±329.18 cm3 (1,209.72-1,680.68 cm3). Good correlation of liver volume estimated by ultrasonography with body indices supports our results. In their prediction model, age and height were good predictors of liver volume but weight and BSA were found insignificant in contrast to our study.
Further large multicentre level studies are to be done taking various methods in calculating the liver volumes before coming up with an accurate formula in Indian population and comparing it with the gold standard CT volumetry study may give good insight into the study. Accurate estimation of liver volume is not possible as this cannot be done in-situ in a healthy human subject.
Limitation(s)
Small sample size and CT volumetry study was not performed. Author also suggests carrying out an autopsy-based study and validation in Indian population.
Conclusion(s)
In present study, variances between two methods were statistically insignificant. Two methods of measurement had good correlation which signifies strength of linear relationship. Thus, sonographic evaluation of liver volume in preoperative period during major surgery is an useful tool. Formula based volume for calculation of SLV needs to be validated in Indian population.
†Bivariate correlation; *Significant at the 0.05 level (2-tailed); **Significant at the 0.01 level (2-tailed)