Assessment of corneal topographic data using Pentacam has revolutionised in the field of Ophthalmology, earlier placido based methods have been stated inaccurate by many authors [1]. Moreover, the new device provides elevation data along with pachymetric analysis and has made diagnosis of even early ectatic changes of cornea a bit easier to diagnose, thus Pentacam has become a popular device in our field [2]. It is a physiological process to undergo ageing, like other structures in human body, corneal topography is found to be altered with ageing which is indicated from change in corneal astigmatism from with-the-rule to against-the-rule and also associated increase in spherical aberrations [3,4]. But sometimes it becomes difficult to delineate physiological and pathological changes as age advances, thus it seems to be important to determine and study various physiological variations in corneal topography for accurate diagnosis and further management.
Scheimpflug-based tomographical analysis like with Pentacam not only provides information on corneal thickness and curvatural maps of anterior surface but allows thorough study of posterior corneal surface which is crucial in itself [5,6]. As there are few studies available on changes in corneal parameters with age, like by Ho JD et al [4], Nemeth G et al., and Vitalyos G which were done using Pentacam to demonstrate changes in astigmatism of anterior and posterior corneal surface with age [7,8]. This study was performed to determine the variations in various corneal indices with age in a healthy cohort using Pentacam. Previously published studies have not compared the data among different age groups except a study done by Roshdy M al., in Egyptian population [9]. K values determines the curvature of the cornea, Pachymetry measures the thickness of cornea, 540-560 μm seen in normative population, which is very important to diagnose keratoconus, CCT is the thickness of cornea at the corneal apex and TCT is thickness of cornea at its thinnest location. BFS is a reference plane, anterior and PE, normal values being 15 μm and 5 μm respectively, is calculated as raised or depressed regions in respect to this reference shape, in PE calculated from BFTE, a toric ellipsoid is used instead of a BFS, to determine even slightest changes in corneal curvature.
PPI determines the increase in pachymetry from the thinnest point, average increase is calculated as PPI avg (normally is equivalent to 0.58±0.30) [10]. ART avg is calculated by dividing thinnest point of cornea by PPI avg and this helps to differentiate normal corneal from thin corneas, cut-off value for ART is 412 μm [11]. This study was conducted in north Indian population with the aim to determine various corneal parameters and interpret variations in these with increasing age.
Materials and Methods
This cross-sectional study included a cohort of 60 healthy participants of north Indian descent with visual acuity of 6/6 with refractive error less than 2D without any other ocular disorders, attending Outpatient Department of Ophthalmology from July 2019 to February 2020 and Ethics Committee approval was taken (REC/GMC/987-20).
Inclusion criteria: Participants with age more than 18 years and distance visual acuity of 6/6 with refractive error <2D were included in the study.
Exclusion criteria: Participants with age less than 18 years, refractive error >2D, any active pathology, use of medication, pregnancy, corneal pathology, history of ocular trauma, ocular surgery and contact lens wear were excluded from the study.
Sixty participants were selected and explained about the procedure and informed consent was taken. Based on age, three groups were created with 20 participants in each, Group A with age 18 to 25 years, Group B with age between 26 and 40 years and Group C with age more than 40 years. Scanning of all study subjects was done three times using Pentacam and average of these three readings was taken into consideration, setting was done at 25 Scheimpflug images per scan. In case of blinking or image distortion, the scan was repeated and was approved by the OK signal given to examiner by the equipment. Two sets of values were determined, studied and compared between different age groups.
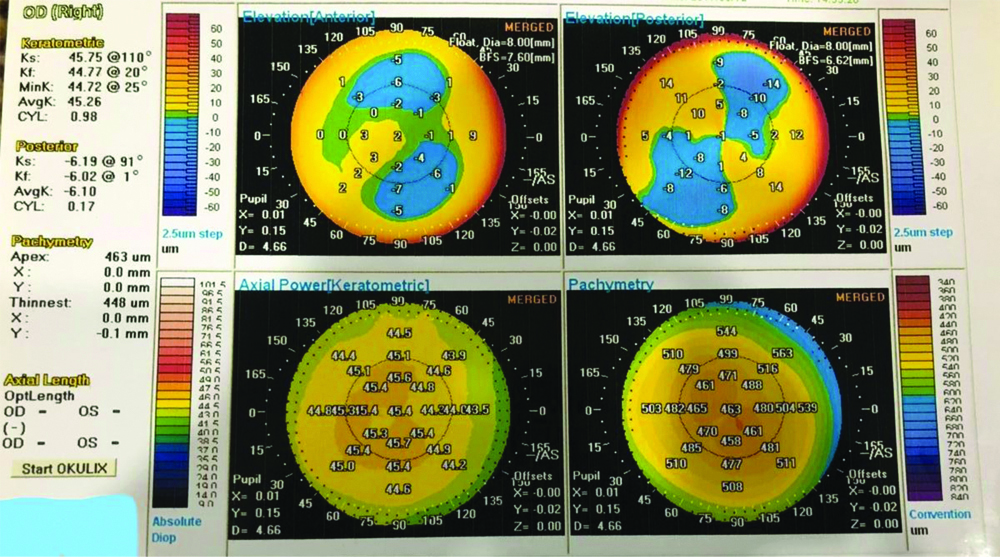
First set of values included, keratometry values in the flat (K1) and steep (K2) and maximal keratometry values of the front surface (Kmax). Second set of values included, AE, PE, PE minus AE from BFS of 8 mm (BFS) and PE from the BFTE, apex thickness (CCT), pachymetry at the thinnest-point thickness (TCT), average corneal PPI avg and average ART indices (ART avg). These values were then compared with normative baseline. Pentacam analyse 25000 different points on corneal surface and interprets thickness and topography of entire cornea, both anterior and posterior surface, from limbus to limbus. The images were then digitalised in the computer and data is displayed in forms of maps [Table/Fig-1].
Elevation, Keratometric and Pachymetry maps as displayed by Pentacam.
Kf=K1: Keratometry values in flat; Ks=K2: Keratometry values in steep; min k: Minimum keratometric values; Avg k: Average keratometric values; Cyl: Cylinder; x,y,z: Measurements of thickness of cornea in mm
Statistical Analysis
Data was collected in individualised proformas, which were then compiled in Microsoft Excel and statistical analysis were performed using Epi info software including calculation of mean, correlation coefficients and standard deviations. Mann-Whitney U test and Spearman correlation test were used for the statistical analysis. The p-values less than 0.05 were taken as significant and p-values less than 0.01 were taken as highly significant.
Results
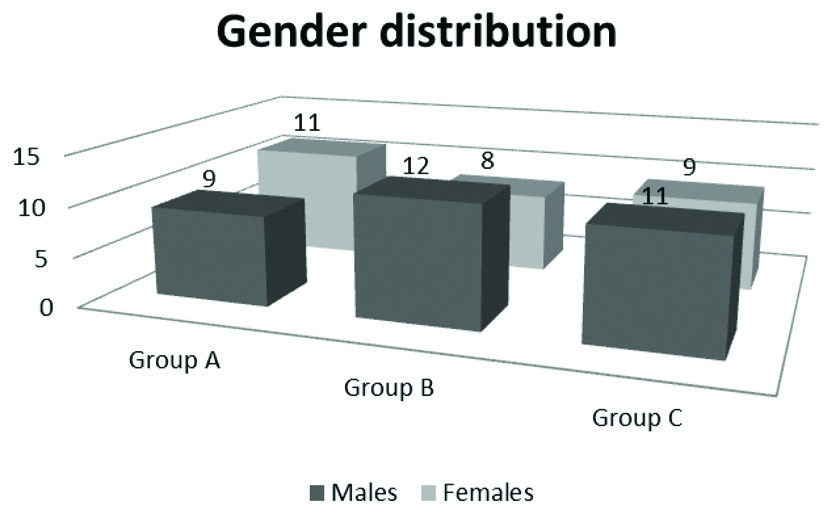
The study included 60 participants, 20 in each group, comprising group A with age 18 to 25 years, group B with age between 26 and 40 years and group C with age more than 40 years with an average age of 21±2.42 years in group A, 30.9±4.3 years in group B and 42.45±1.65 years in group C as shown in [Table/Fig-2]. There were 11, 8 and 9 females in Group A, B and C, respectively and 9, 12 and 11 males in Group A, B and C, respectively [Table/Fig-3].
| Group division | Group A | Group B | Group C |
|---|
| Age group (years) | 18-25 | 26-40 | >40 |
| Mean±SD (years) | 21±2.42 | 30.9±4.3 | 42.45±1.65 |
SD: Standard deviation
Gender distribution.
n=20 in each group
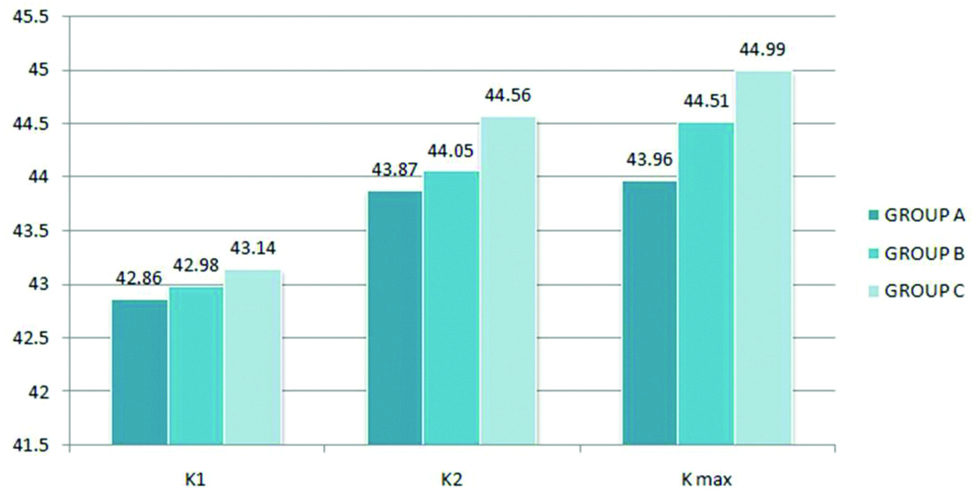
Analysis of first set of values: According to analysis of keratometric values, Flat (K1) is 42.86, 42.98 and 43.14 in 3 groups, respectively, steep (K2) is 43.87, 44.05 and 44.56 in 3 groups, respectively and maximal keratometry values of the front surface (Kmax) is 43.96, 44.51 and 44.99 in 3 groups, respectively [Table/Fig-4]. These values did not show any statistical difference among the groups (p-value=0.082) using Mann-Whitney U test.
Analysis of keratometric values.
Mann-Whitney U test used (p-value=0.082)
Analysis of second set of values: As tabulated in [Table/Fig-5,6], data collected from 3 groups shows statistically significant results.
Mean and standard deviation of different indices among the three age groups.
| Parameters | Group A | Group B | Group C |
|---|
| Mean | SD | Mean | SD | Mean | SD |
|---|
| AE from BFS (μm) | 2.8 | 0.20 | 2.3 | 0.30 | 1.3 | 0.44 |
| PE from BFS (μm) | 1.4 | 1.2 | 4.4 | 0.49 | 4.85 | 1.00 |
| PE minus AE (μm) | -1.4 | 1.00 | 2.1 | 0.19 | 3.55 | 0.56 |
| PE from BFTE (μm) | 3.1 | 2.8 | 3.9 | 3.6 | 5.1 | 4.7 |
| CCT (μm) | 539.6 | 36.2 | 542.9 | 30.9 | 557.1 | 39.1 |
| TCT (microm) | 536.1 | 35.5 | 541.6 | 29.3 | 550.0 | 37.6 |
| PPI avg (μm) | 0.80 | 0.22 | 0.86 | 0.25 | 0.71 | 0.18 |
| ART avg (μm) | 777.04 | 29.80 | 690.23 | 23.69 | 819.33 | 25.65 |
Anterior elevations (AE), Posterior elevations (PE), PE minus AE from best fit sphere of 8 mm (BFS) and PE from the best-fit toric ellipsoid (BFTE), apex thickness (CCT), pachymetry at the thinnest-point thickness (TCT), average corneal Pachymetry progression indices (PPI avg) and average Ambrosio’s relational thickness indices (ART avg); BFS: Best fit sphere
The p-value of comparing indices.
| Parameters | Group A versus Group B | Group A versus Group C | Group B versus Group C |
|---|
| p-value | z value | U value | p-value | z value | U value | p-value | z value | U value |
|---|
| AE from BFS | <0.00001 | 4.01 | 51 | <0.00001 | 5.39 | 0 | <0.00001 | 5.30 | 6 |
| PE from BFS | <0.00001 | -4.4 | 35.5 | <0.00001 | -4.61 | 35.5 | 0.24 | -1.16 | 156.5 |
| PE minus AE | <0.00001 | -4.65 | 27.5 | <0.00001 | -5.16 | 8.5 | <0.00001 | -4.77 | 23 |
| PPI avg | 0.51 | -0.6 | 175.5 | 0.19 | 1.2 | 151.5 | 0.048 | 1.97 | 126 |
| ART avg | <0.00001 | 4.42 | 36 | <0.00001 | -4.61 | 29 | <0.00001 | -5.3 | 1 |
p-values less than 0.05 were taken as significant and p-values less than 0.01 were taken as highly significant
Mann-Whitney U test was used
When AE, PE and PE-AE were compared among three age groups, results were highly significant with p-value <0.00001 with Mann-Whitney U test analysis. Thus, the elevation indices from BFS were found to be correlated with age, although comparison of PE from BFS among age group 26 to 40 years and those above 40 years was found to be statistically non-significant with p-value of 0.24. On comparison of average corneal PPI between participants with age 18-25 years and 26-40 years and those between 26-40 years and age more than 40 years was found to be statistically insignificant (p-values 0.51 and 0.19, respectively). Though in participants with age 18-25 years and with age more than 40 years, PPI avg was found to be of statistical significance (p-value=0.048). Average ART indices (ART avg) was found to produce highly statistically significant results among 3 groups (p-value <0.00001). The p-values for PE from BFTE, CCT and TCT were 0.06, 0.182 and 0.265, respectively and results were statistically insignificant.
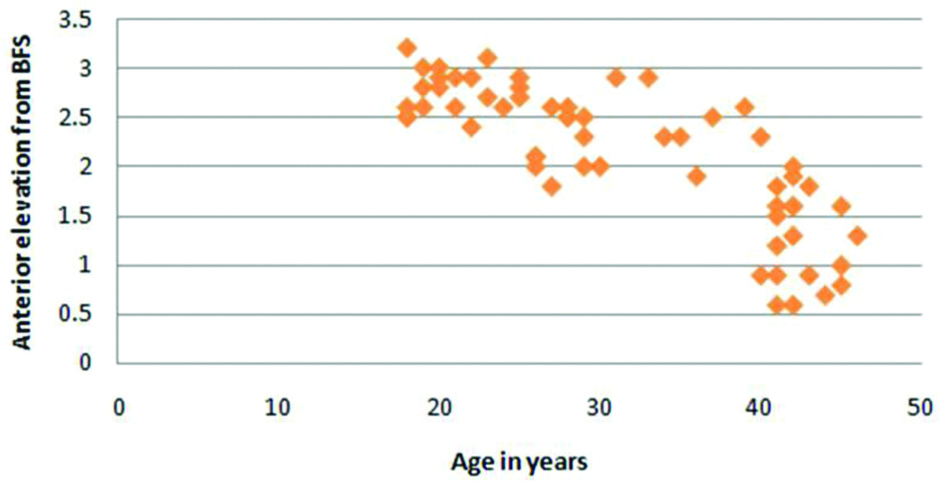
Correlation analysis was done between age and various corneal indices using Spearman’s rho value which was statistically significant in elevation indices (p-value=0.001) and avg ART (p-value=0.00122) but not of statistical significance when age was compared to avg PPI (p-value=0.26) [Table/Fig-7,8,9,10,11 and 12].
Correlation of age with corneal indices using Spearman correlation coefficient.
| Parameter | Spearman’s rho value | p-value |
|---|
| AE from BFS | -0.80 | 0.001 |
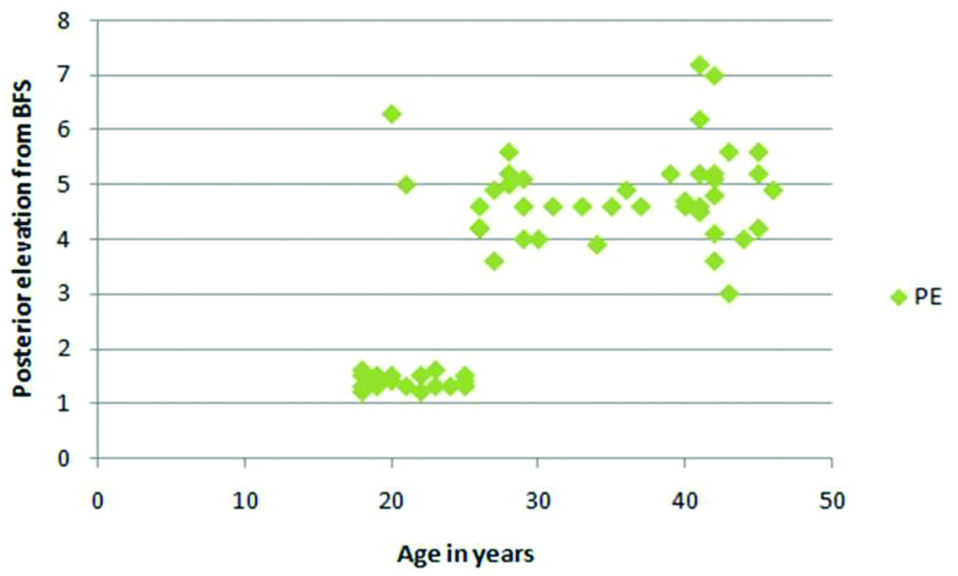
| PE from BFS | 0.60 | 0.001 |
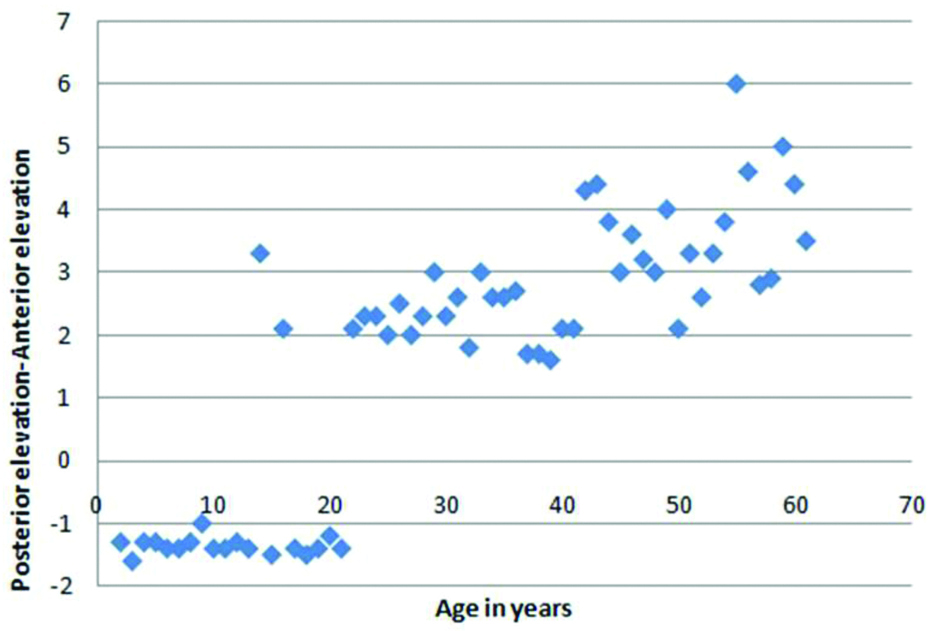
| PE minus AE | 0.7 | 0.001 |
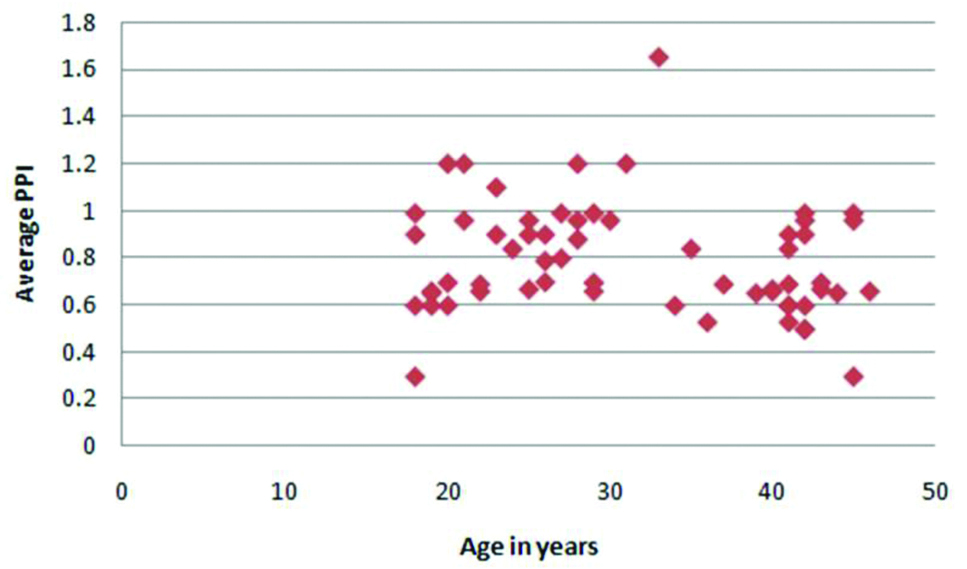
| PPI avg | 0.14 | 0.26 |
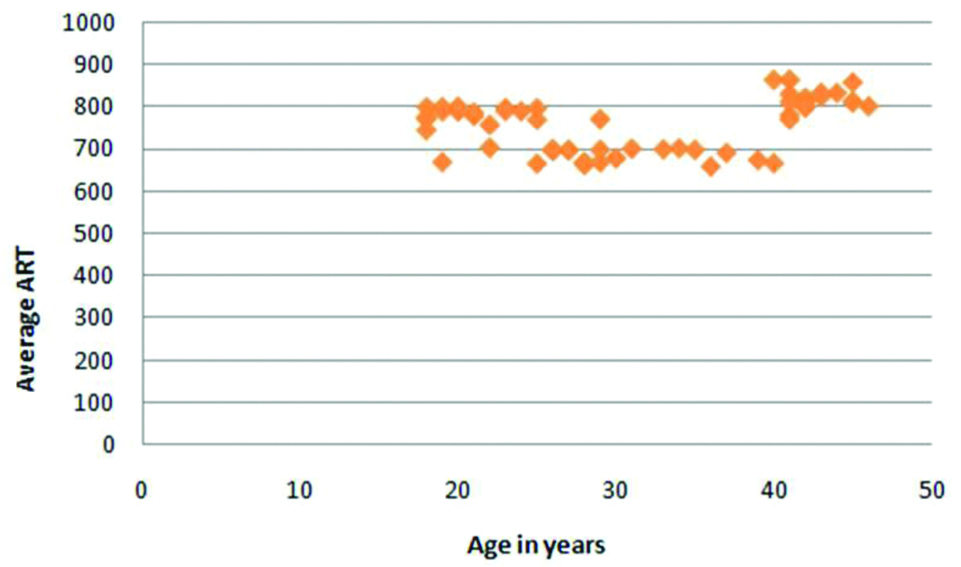
| ART avg | 0.4 | 0.00122 |
anterior elevations (AE), posterior elevations (PE) from BFS of 8 mm (BFS), average corneal pachymetry progression indices (PPI avg) and average Ambrosio’s relational thickness indices (ART avg)
Anterior Elevation (AE) and age analysis.
Posterior Elevation (PE) and age analysis.
BFS: Best fit sphere
Posterior Elevation-Anterior Elevation (PE-AE) and age analysis.
Average corneal pachymetry progression indices (Average PPI) and age analysis.
Average Ambrosio’s Relational Thickness indices (Average ART) and age analysis.
Discussion
In this study, authors compared many corneal parameters among 3 age groups comprising healthy cohort to remove confounding factors (Group A with age 18 to 25 years, Group B with age between 26 and 40 years and Group C with age more than 40 years) thus, spanning a wide age range. Elevation indices provided statistically significant results indicating that is a significant correlation between age and elevation indices of anterior and posterior corneal surfaces. It was concluded from this that group C (age >40 years) had more PE and less AE than group A (18-25 years age group). Similarly study done by Hashemi H et al., concluded a significant correlation of age with the maximum AE (p<0.001), but not with the maximum PE (p=0.476) [12]. Many studies are available on pachymetric analysis, so this was focused on elevation based indices and avg PPI and avg ART depicting that aside from relying on pachymetric indices, one should pay attention to other variables as they were found to have significant correlation with changing age. Kim J et al., studied pachymetry and corneal elevation indices among hypermetropes and myopes, when they adjusted the data for age, they found that PE changes were statistically significant as shown in this, while AE changes in their study were not significant, that was contrary to this study [13].
This study outlines that elevations indices and avg ART values of cornea are significantly altered with increasing age so it can be recommended to evaluate these parameter with increasing age. The strength of this study is that the data is reliable and reproducibly collected with Pentacam and it covered a wide age range. This study provides vital information about variation in corneal parameters with age amongst local population. Further, studies can be done to study how age alters high order aberrations at level of cornea.
Limitation(s)
The main limitation to this was number of patients as increasing the sample size would definitely provide more data for analysis. Another limitation was that it was a cross-sectional study, thus there was lack of follow-up.
Conclusion(s)
The corneal parameters are significantly altered from their normative values with age. It is thus important to use elevation based indices along with pachymetric based indices when differentiating physiological changes from pathological changes in cornea in patients belonging to different age groups. This study outlines that elevations indices and avg ART values are significantly altered with increasing age.
SD: Standard deviation
Anterior elevations (AE), Posterior elevations (PE), PE minus AE from best fit sphere of 8 mm (BFS) and PE from the best-fit toric ellipsoid (BFTE), apex thickness (CCT), pachymetry at the thinnest-point thickness (TCT), average corneal Pachymetry progression indices (PPI avg) and average Ambrosio’s relational thickness indices (ART avg); BFS: Best fit sphere
p-values less than 0.05 were taken as significant and p-values less than 0.01 were taken as highly significant
Mann-Whitney U test was used
anterior elevations (AE), posterior elevations (PE) from BFS of 8 mm (BFS), average corneal pachymetry progression indices (PPI avg) and average Ambrosio’s relational thickness indices (ART avg)