Thyroid gland is a butterfly-shaped gland comprising of two lobes- right and left, interconnected via a narrow central isthmus. The lobes are cone-shaped, each measuring about 5 cm in length, 3 cm in width and 2 cm in depth [1]. Isthmus measures about 1.25 cm in width as well as height, but dramatically varies in size and site [1]. Its thickness varies between 3-5 mm, correlating with various demographic factors [2]. Variations in morphometry include variations in volume, shape and size of the thyroid gland which may differ according to age and gender. For instance, the length and depth of the thyroid gland are 18-20 mm and 8-9 mm among newborns, 25 mm and 12-15 mm in one year, while 40-60 mm and 13-18 mm amongst adults, respectively. The normal limit of thyroid volume (without including the isthmus) is reported as 10-15 mL in females and 12-18 mL in males [3]. Mean thyroid volume increases with age [4]. Enlargement of the thyroid gland (goiter) may be associated with hyperfunction or hypofunction of the gland. There can be malignant growths of the thyroid gland leading to possible invasion into the neighboring structures giving rise to pressure symptoms and nerve involvement [5]. Morphometry of the thyroid with particular emphasis on its volume is an essential and most important parameter which must be evaluated. It is helpful in the diagnosis and monitoring of various thyroid diseases [6,7].
Most studies on volume assessment of the thyroid exclude the isthmus during the calculation of volume [8,9]. Other authors differ to state that thyroid isthmus comprises of the same tissue as the rest of the gland; hence, it must be sonographically assessed; with particular reference to its thickness and it may inturn, reveal essential clues in the diagnostic process [10]. Studies conducted for ultrasonographic evaluation of thyroid gland volume and its correlation with various anthropometric and demographic parameters have reported that the size of the thyroid gland varies with these parameters [3,4]. Therefore, it can be inferred that the nomogram will vary in different geographical regions as the physique of the population changes. Also, there is a scarcity of literatures published to date regarding the reference values of normal adult thyroid dimensions from our region. Hence, it is critical to establish some reference values for thyroid dimensions, measurements of the lobes, isthmus and volume with respect to the difference in demographic factors. The present study is an attempt in this direction. Through this study, authors endeavor to create a nomogram of the dimensions of lobes, isthmus and volume of the thyroid gland for asymptomatic young adult population using ultrasonography.
Materials and Methods
This was a cross-sectional observational study carried out between April 2019-March 2020 at Department of Anatomy in collaboration with Department of Radiodiagnosis, King George’s Medical University (KGMU), Lucknow. The study subjects included 100 volunteers from among the 1st year MBBS/BDS students (50 males and 50 females), who attended the classes in Department of Anatomy during the study. Informed consent from subjects and clearance from the Institutional Ethics Committee was obtained.
Sample size calculation: Sample size was calculated based on the following formula
N={Zα/2×p×(1-p)}/d2Where, Zα/2=critical value of the normal distribution at α/2=1.96 ~2 for 95% confidence level, power 80% and α is 0.05; p=sample proportion=0.50 i.e., 50% (considered for normative data amongst asymptomatic adults viz., infinite population); d=margin of error=0.10 i.e., 10%. Hence, Sample size (N)=22×0.5×0.5/(0.1)2=4×0.25/0.01=1.00/0.01=100.
Inclusion criteria: Subjects who were willing to participate in the study after submitting written and informed consent were included.
Exclusion criteria: Subjects with signs and symptoms like restlessness, hoarseness of voice, agitation, tremors, rapid significant weight loss despite an increased appetite, excessive sweating, elevated heart rate or intolerance to heat/cold were excluded from the present study. Also, any subjects with history of treatment for thyroid disorders, positive family history of thyroid cancer, prior history of radiotherapy/neck surgery or any visible/palpable mass in the neck were excluded.
B-mode ultrasonography (brightness mode ultrasound where a linear array of transducers simultaneously scan a plane through the body which could be then viewed as a 2-D image on screen with texture and tissue borders as black and white pictures) was performed using a linear probe with frequency 6-13 MHz for evaluation of thickness of the isthmus and depth (d), width (w), and length (l) of each lobe of the thyroid gland.
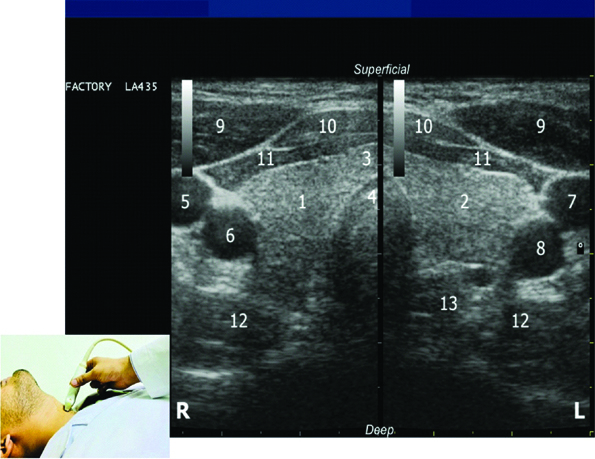
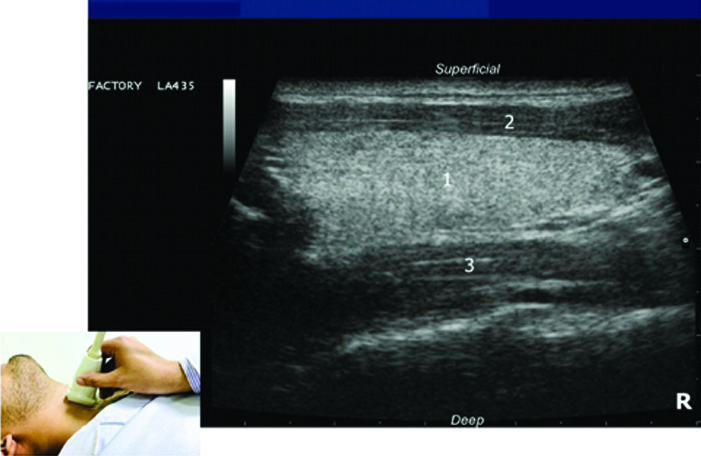
Scanning protocol [11]: Imaging was performed with the subject in supine position with hyperextended neck (the pillow was kept beneath the shoulders). The image presenting thyroid isthmus along with both the lobes was captured. The thickness of the thyroid isthmus was also measured at this stage, but was not included in calculation of total thyroid volume. Thereafter, both the lobes (hyperechoic in contrast to adjacent muscles) were visualised using the split screen view [Table/Fig-1] with the capsule being hyperechoic to parenchyma of the gland. One lobe was scanned at a time; the image showing the lobe at its greatest depth and width was captured and then procedure was repeated similarly on the opposite side. The measurements- the maximal width (mediolateral) and depth (anteroposterior) of the transverse section of each lobe were taken. The gland was then scanned longitudinally beginning in the sagittal plane holding the transducer perpendicular above the sternal notch. The image which showed the lobe at its greatest length (craniocaudal), was frozen and captured [Table/Fig-2,3]. The scanning was repeated for the opposite lobe and the measurements were taken.
Ultrasound image showing split screen view of thyroid lobes.
[1-right lobe, 2-left lobe, 3-isthmus, 4-trachea, 5-right internal jugular vein, 6-right common carotid artery, 7-left internal jugular vein, 8-left common carotid artery, 9-sternocleidomastoid muscles right and left, 10-sternohyoid muscles right and left, 11-sternothyroid muscles right and left, 12-longus colli muscles right and left, 13-oesophagus]
Ultrasound image of right lobe of thyroid gland in longitudinal view.
[1-right lobe, 2-strap muscles, 3-longus colli muscle]
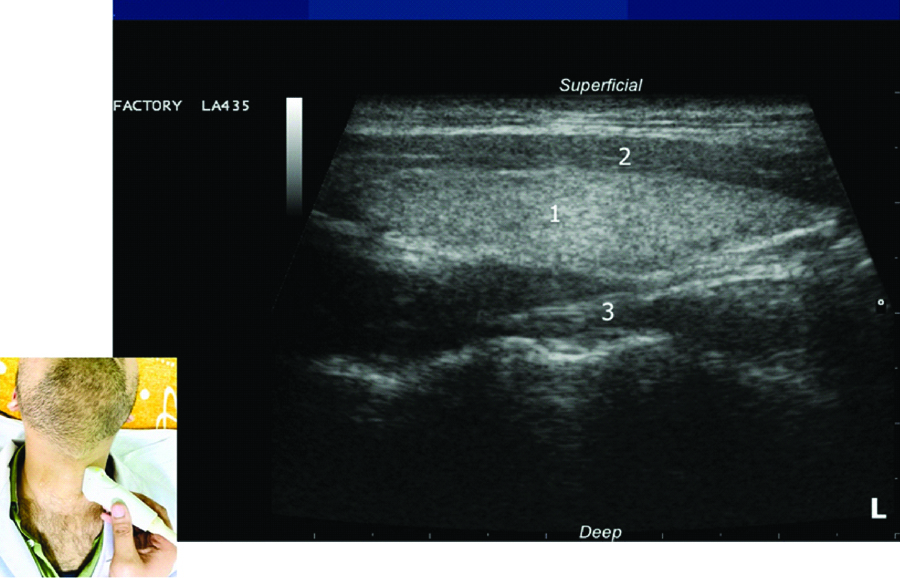
Ultrasound image of left lobe of thyroid gland in longitudinal view.
[1-right lobe, 2-strap muscles, 3-longus colli muscle]
Formulae used: Volume of the thyroid gland (V) was calculated by the ellipsoid formula using the measurements of each lobe and a correction factor (0.479) [12]. The total thyroid volume (V) was the sum of the volumes of both lobes. But, the measurement of the isthmus was not included for calculating thyroid volume [8,9]. BSA(m2)=W0.425(kg) x H0.725(cm) x 71.84 x 10⁻⁴ [13,14]. Boer formula was used for LBM calculation in adults [15]:
For Males: LBM (kg)={0.407×W (kg)}+{0.267×H (cm)}-19.2;
For Females: LBM (kg)={0.252×W (kg)}+{0.473 × H (cm)}-48.3.
Statistical Analysis
The statistical analysis was done using SPSS Version 24.0 (Chicago, Inc, USA). The values were represented in Number (%) and mean±SD. To test the significance of two means, the student t-test was used. Also, a paired t-test was used as authors needed the difference between two variables for the same subjects. The ANOVA (Analysis of Variance) test was used to compare the within group and between group variances amongst the study groups. Also, bivariate correlation using Karl Pearson correlation coefficient (r) was used, where value of r ranged from −1 to +1, with +1 indicating perfect positive correlation and −1 indicating perfect negative correlation. The p-value <0.05 was regarded as statistically significant.
Results
Volume of right lobe of thyroid gland (3.89±1.28 mL) was significantly higher than that of left (3.59±1.09 mL) [Table/Fig-4]. Total thyroid volume was significantly higher in males (8.32±2.30 mL) than in females (6.63±1.78 mL) (p<0.001). Thickness of thyroid isthmus in males (2.22±0.76 mm) was higher than in females (1.96±0.53 mm), but this difference was not statistically significant [Table/Fig-5,6 and 7].
Comparison of volume of right and left lobes of thyroid gland (mL).
| Sides | Mean | SD | 95% CI (Normative range) |
|---|
| Lower limit | Upper limit |
|---|
| Right | 3.89 | 1.28 | 3.64 | 4.14 |
| Left | 3.59 | 1.09 | 3.37 | 3.81 |
‘t’=3.495; ‘p’=0.001 (Paired t-test); SD: Standard deviation
Total volume of thyroid gland and thickness of thyroid isthmus.
| Gender | Total thyroid volume (mL) | Thickness of isthmus (mm) |
|---|
| Mean | SD | Mean | SD |
|---|
| Female (n=50) | 6.63 | 1.78 | 1.96 | 0.53 |
| Male (n=50) | 8.32 | 2.30 | 2.22 | 0.76 |
| ‘t’=4.103; p<0.001 | ‘t’=1.974; p=0.051 |
| Total (n=100) | 7.48 | 2.22 | 2.09 | 0.66 |
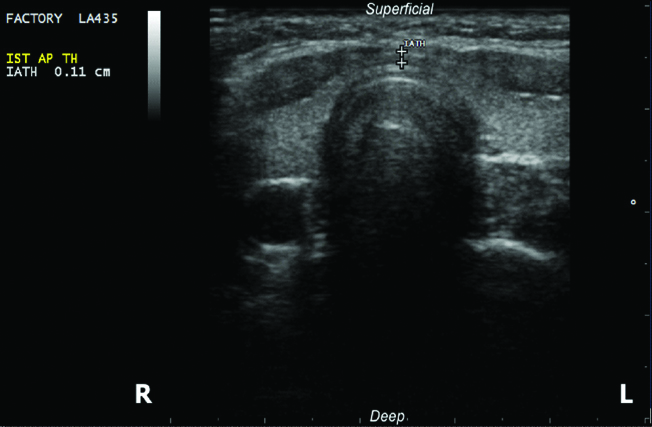
Ultrasound image showing maximum thickness of isthmus of thyroid gland.
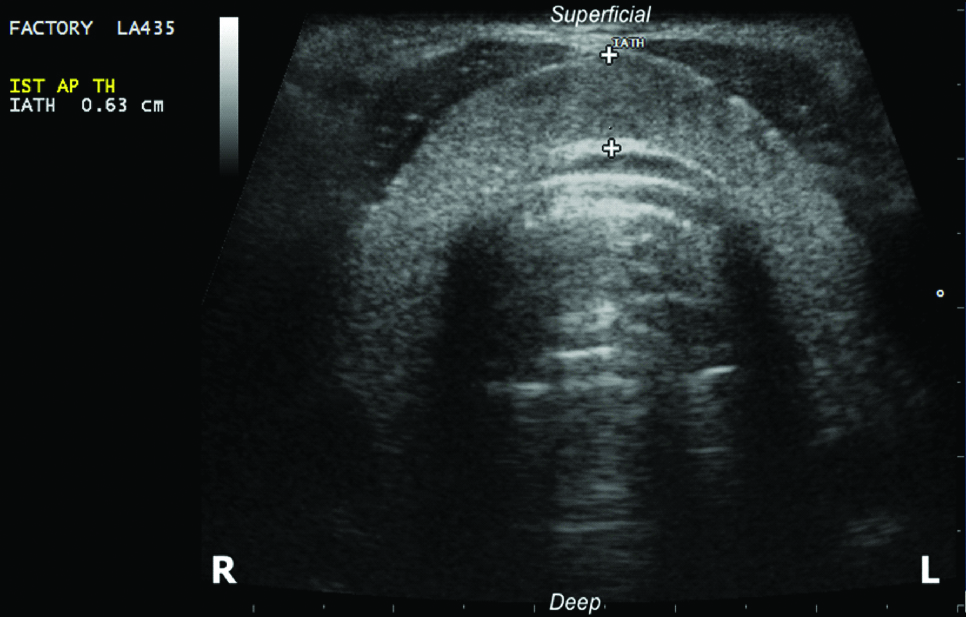
Ultrasound image showing minimum thickness of isthmus of thyroid gland.
A subsequent increment in total thyroid volume and isthmus thickness was observed with progressive quartiles of height, weight, BSA, LBM, across different categories of BMI as well as among cases with normal NC and central obesity. All these associations with regards to the total volume of thyroid gland for each of the anthropometric variables were statistically significant, however not so for thyroid isthmus. Correlations of total thyroid volume with height, BMI and NC were mild and significant, while with weight, BSA and LBM were moderate and significant. Correlations of thickness of thyroid isthmus with LBM and NC were weak, but statistically significant, while with height, weight, BMI and BSA were weak and insignificant statistically [Table/Fig-8,9].
Impact of anthropometric parameters (height, weight, BMI) on total thyroid volume (mL) and thickness of thyroid isthmus (cm).
| S. No. | Variable | Total thyroid volume (mL) | Thickness of isthmus (mm) |
|---|
| Mean | SD | 95% CI | Mean | SD | 95% CI |
|---|
| Lower | Upper | Lower | Upper |
|---|
| 1. | Height |
| Q1 (n=21) | 6.26 | 1.77 | 5.45 | 7.06 | 1.88 | 0.36 | 1.71 | 2.04 |
| Q2 (n=28) | 7.15 | 2.01 | 6.37 | 7.93 | 2.04 | 0.63 | 1.79 | 2.28 |
| Q3 (m=26) | 7.66 | 1.67 | 6.98 | 8.33 | 2.25 | 1.00 | 1.85 | 2.66 |
| Q4 (m=25) | 8.69 | 2.69 | 7.58 | 9.80 | 2.14 | 0.38 | 1.99 | 2.30 |
| ANOVA | F=5.554; p=0.001 | F=1.382; p=0.253 |
| Correlation/Sig. | ‘r’=0.457 (Mild); p<0.001 | ‘r’=0.179 (Weak); p=0.074 |
| 2. | Weight |
| Q1 (n=25) | 6.02 | 1.34 | 5.46 | 6.57 | 1.90 | 0.42 | 1.73 | 2.08 |
| Q2 (n=25) | 7.25 | 1.62 | 6.58 | 7.92 | 2.08 | 0.59 | 1.84 | 2.33 |
| Q3 (n=23) | 8.24 | 2.19 | 7.29 | 9.19 | 2.15 | 0.97 | 1.73 | 2.57 |
| Q4 (n=27) | 8.39 | 2.66 | 7.34 | 9.45 | 2.20 | 0.59 | 1.97 | 2.44 |
| ANOVA | F=7.314; p<0.001 | F=0.988; p=0.402 |
| Correlation/Sig. | ‘r’=0.506 (Mod); p<0.001 | ‘r’=0.178 (Weak); p=0.076 |
| 3. | BMI |
| Underweight (n=8) | 6.71 | 1.26 | 5.66 | 7.77 | 1.91 | 0.29 | 1.67 | 2.15 |
| Normal (n=78) | 7.20 | 2.02 | 6.74 | 7.66 | 2.07 | 0.67 | 1.91 | 2.22 |
| Overweight (n=14) | 9.46 | 2.70 | 7.91 | 11.02 | 2.30 | 0.74 | 1.87 | 2.73 |
| ANOVA | F=7.591; p=0.001 | F=1.037; p=0.358 |
| Correlation/Sig. | ‘r’=0.313(Mild); p=0.002 | ‘r’=0.100 (Weak); p=0.321 |
Quartile-wise distribution for height: Q1 (148-156 cm), Q2 (157-164.9 cm), Q3 (165-171.70 cm) Q4 (≥171.75 cm); for weight: Q1 (37-53.24 kg), Q2 (53.25-59.49 kg), Q3 (59.50-65.99 kg), Q4 (≥66.0 kg). Mod: Moderate
Impact of anthropometric parameters (BSA, LBM, NC) on total thyroid volume (mL) and thickness of thyroid isthmus (cm).
| S. No. | Variable | Total thyroid volume (mL) | Thickness of isthmus (mm) |
|---|
| Mean | SD | 95% CI | Mean | SD | 95% CI |
|---|
| Lower | Upper | Lower | Upper |
|---|
| 1. | BSA |
| Q1 (n=22) | 5.93 | 1.40 | 5.31 | 6.56 | 1.92 | 0.44 | 1.73 | 2.12 |
| Q2 (n=28) | 7.13 | 1.71 | 6.47 | 7.80 | 2.01 | 0.56 | 1.79 | 2.23 |
| Q3 (n=22) | 8.10 | 2.05 | 7.20 | 9.01 | 2.24 | 1.01 | 1.79 | 2.68 |
| Q4 (n=28) | 8.54 | 2.60 | 7.54 | 9.55 | 2.18 | 0.55 | 1.96 | 2.39 |
| ANOVA | F=7.871; p<0.001 | F=1.114; p=0.347 |
| Correlation/Sig. | ‘r’=0.526 (Mod); p<0.001 | ‘r’=0.193 (Weak); p=0.054 |
| 2. | LBM |
| Q1 (n=25) | 6.15 | 1.66 | 5.46 | 6.83 | 1.87 | 0.41 | 1.70 | 2.04 |
| Q2 (n=25) | 7.12 | 1.80 | 6.37 | 7.86 | 2.08 | 0.63 | 1.81 | 2.34 |
| Q3 (n=25) | 8.01 | 1.77 | 7.28 | 8.74 | 2.23 | 0.91 | 1.86 | 2.61 |
| Q4 (n=25) | 8.64 | 2.74 | 7.51 | 9.77 | 2.17 | 0.58 | 1.93 | 2.41 |
| ANOVA | F=7.092; p<0.001 | F=1.468; p=0.228 |
| Correlation/Sig. | ‘r’=0.521(Mod); p<0.001 | ‘r’=0.209(Weak); p=0.037 |
| 3. | NC |
| Normal (n=69) | 7.11 | 1.97 | 6.63 | 7.58 | 2.06 | 0.71 | 1.89 | 2.23 |
| Central obesity (n=31) | 8.30 | 2.54 | 7.37 | 9.23 | 2.15 | 0.55 | 1.95 | 2.35 |
| Student ‘t’ test | ‘t’=2.565; p=0.012 | ‘t’=0.651; p=0.516 |
| Correlation/Sig. | ‘r’=0.474 (Mild); p<0.001 | ‘r’=0.204 (Weak); p=0.041 |
Quartile-wise distribution for BSA: Q1 (1.28-1.51 m2), Q2 (1.52-1.63 m2), Q3 (1.64-1.75 m2), Q4 (≥1.76 m2); for LBM: Q1 (32.01-40.10 kg), Q2 (40.11-45.63 kg), Q3 (45.64-53.33 kg), Q4 (≥53.34 kg); Mod: Moderate; BSM: Body surface area; LBM: Lean body mass; NC: Neck circumference
Correlation of total thyroid volume with thickness of thyroid isthmus was weak (even with respect to gender), but statistically significant among females (p=0.043) and overall subjects (p=0.009) [Table/Fig-10].
Correlation of total thyroid volume and isthmus thickness with both genders as well as overall population.
| Gender | ‘r’ | Level of correlation | ‘p’ | Significance |
|---|
| Female | 0.287 | Weak | 0.043 | Significant |
| Male | 0.159 | Weak | 0.259 | Not significant |
| Total | 0.259 | Weak | 0.009 | Significant |
Discussion
Ultrasonography has been routinely used for calculating thyroid volume using linear parameters and mathematical formulas [16]. Various studies have been conducted for assessing thyroid gland volume using ultrasound throughout the world. As reported in the previous literatures, the thyroid volume was found to vary with chronological age, from 0.84±0.38 mL Chanoine JP et al., to 18.6±4.5 mL Hegedus L et al., [4,17]. The data showed that size of the thyroid gland varied with geographical and ethnic factors as well as with the population’s iodine status. Moreover, accurate knowledge about the dimensions of the thyroid gland is essential for diagnosing various pathologies related to the gland. Hence, it is detrimental that normative data on thyroid size must be updated.
In present study, the mean total volume of the thyroid gland was found to be 7.48±2.22 mL. Ahidjo A et al., found the mean thyroid volume 8.55±1.82 mL, which was close to our reported value [18]. Ivanac G et al., randomly selected 51 healthy females with normal thyroid hormonal status, aged 20-38 years (mean age 22 years) from Croatia to obtain thyroid volume (10.68±2.83 mL) which was found higher than this study [19]. Seker S and Tas I using ultrasound, reported even higher mean total thyroid volume as 13±6.27 mL [2]. Kayastha P et al., reported the overall thyroid volume to be 6.629±2.502 mL in a mountainous area that had good iodisation programme [20]. It is already known that iodine deficiency is one of the key causes for enlargement of thyroid gland. Hence, it was contemplated that proper iodine supplementation in our country is vital to avoid higher values of the total thyroid volume.
It was also found that the total volume of thyroid gland was significantly higher in males (8.32±2.30 mL) than in females (6.63±1.78 mL) (p<0.001). This finding was close to that of other investigators; Suwaid MA et al., found the mean thyroid volume for males (5.32±2.50 cm3) to be more than found in females (4.79±2.38 cm3) with a p-value of 0.03 [21]. Furthermore, a significant difference was also reported by Seker S and Tas I who reported total thyroid volume of 15.87±7.18 mL in men and 10.94±4.53 mL in women with p<0.05 [2]. Salaam AJ et al., reported thyroid volume in males (6.30±2.37 mL) to be higher than that found in females (5.65±2.61 mL) [22]. These differences could be attributed to the fact that males had higher BMI than females amongst same age groups. However, Anele T and Marchie T et al., didn’t find any significant difference between thyroid volumes among males and females, which differs from our study [23,24].
In our study, authors observed that mean volume of right lobe of thyroid gland (3.89±1.28 mL) was higher than that of left (3.59±1.09 mL) and the difference was significant (p=0.001). This finding is in agreement with data given by Ahidjo A et al., they also reported right thyroid lobe volume (4.48 cm3) to be higher than the left (4.07 cm3) (p=0.000) [18]. Similar findings were noted by other investigators, Seker S and Tas I in 251 volunteers, found right thyroid lobe volume (7.22±3.65 cm3) to be higher than the left (5.78±2.91 cm3) [2], likewise, Suwaid MA et al., in reported mean right lobe volume 2.68±1.29 cm3 and left lobe volume 2.65±1.23 cm3 for males and 2.42±1.23 cm3 and 2.37±1.16 cm3 for females, respectively. They proposed that larger right lobe volume could be attributed to better vascularisation of right as compared to left lobe [21]. Also, this asymmetry of thyroid gland has been attributed to and associated with the handedness of subjects by Yildirim M et al., [25]. Furthermore, Ying M and Yung DM have related it to the position of oesophagus stating that as the oesophagus was usually deviated slightly to the left, there was more space for growth of the right lobe [26].
The volume of thyroid gland has been found to correlate linearly with weight, height, BMI and BSA [17]. In this study found a statistically significant positive correlation between thyroid volume and height of the individual (p<0.001) (r=0.457) such that, an increment in volume of thyroid gland was observed with progressive quartiles of height. This observation is similar to the study conducted by Ivanac G et al., where thyroid volume best correlated with body height (r=0.37; p=0.001) [19]. Likewise, Kayastha P et al., found significant positive correlation between total thyroid volume and height of the individual (r=0.320, p<0.0001) [20]. In our study, the volume of thyroid gland also increased with progressive quartiles of weight (p<0.001). This finding was consistent with the results of Sari R et al., Svensson J et al., and Barrère X et al., [27-29]. Sari R et al., stated that thyroid volume correlated linearly with a change in body weight (r=0.341, p=0.009) [27]. However, Ivanac G et al., and Veres C et al., stated that no significant linear correlation was observed between thyroid volume and body weight [19,30].
Thyroid volume was also found to increase with increase in BMI in our study (r=0.313, p=0.002). This observation was similar to that found by Sari R et al., with r=0.504 and p<0.001 [27]. Barrère X et al., also deduced a significant positive correlation of thyroid volume with BMI for both males (p=0.0001) and females (p=0.005) [29]. However, our observation was in contrast to that by Kaloumenou I et al., who found a minimal correlation of thyroid volume with BMI (r=0.166, p=0.023) [31]. Veres C et al., also found lowest correlation of thyroid volume with BMI (r=0.54 for males and r=0.35 for females) as compared to the other anthropometric parameters studied by them [30].
Brindel P et al., stated that BSA was a key variable to be assessed as it attributed to be the best anthropometric parameter for predicting thyroid cancer risk [32]. In our study, authors observed a significant statistical increment of thyroid volume with an increase in BSA (r=0.526, p<0.001). This proved to be the best predictor of thyroid volume as per our statistical analysis, which remained in line with several other studies. Veres C et al., observed highest correlation for BSA (r=0.75 for males and r=0.6 for females) [30]. Chanoine JP et al., found thyroid volume to be best correlated with BSA (p<0.01) [4]. Mickuviene N et al., also stated BSA as the best indicator for evaluation of thyroid volume. They suggested to use criteria based on BSA, for the evaluation of constitutional attributes for individual child’s development [33]. However, Ivanac G et al., found thyroid volume to weakly correlate to BSA, but this was statistically significant (r=0.28; p <0.05) [19].
In this study, it was also found subsequent increment of total volume of thyroid gland with progressive quartiles of LBM (r=0.521, p<0.001). Likewise, Kamran M et al., reported a positive correlation of thyroid volume with LBM, which was statistically significant (r=0.277, p=0.001) [34]. Berghout A et al., estimated thyroid size by inspection and palpation among Caucasians living in iodine abundant areas of Amsterdam and drew conclusion that LBM was one of the key factors which influenced total thyroid volume [35]. Wesche MF et al., extrapolated LBM to be a robust determinant for total thyroid volume (r=0.64, p-value <0.0001) in the studied population group of Netherlands [36]. It was seen that cases with normal NC and central obesity, also showed this increment in total volume of thyroid gland like other anthropometric parameters studied alongside. The correlation was mild, but significant (r=0.474, p<0.001). However, there is scarcity of literature regards correlation of thyroid volume assessment with NC, which makes our study stand out. Meco BC et al., aimed to anticipate airway management challenges using NC >43 cm and thyroid volume assessment using ultrasound, as the predictors of difficult intubation. They found mean thyroid volume of the patients to be 26.38±14 mL. But, they concluded that thyroid-related parameters didn’t actually pose any greater risk of difficult intubation in their setting [37].
In the present study, we found mean thickness of thyroid isthmus to be 2.09±0.66 mm. Kayastha P et al., using B-mode ultrasonography, reported mean thickness of isthmus to be 3.097±1.009 mm (range 1.0 to 6.8 mm), which was close to our findings [38]. Mean Isthmus thickness 3.23±1.10 mm was reported using ultrasonography by Seker S and Tas I [2]. A cadaveric study conducted by Won HS et al., revealed the thickness of thyroid isthmus to be 3.4±1.7 mm in adult Korean cadavers, which was more than our reported value [39]. These results could enhance the information pool for the location and morphometry of the thyroid isthmus to enable better surgical outcomes. It was also noticed that the thickness of thyroid isthmus in males (2.22±0.76 mm) was higher than in females (1.96±0.53 mm), but this difference was not statistically significant (p=0.051). Thickness of thyroid isthmus of 3.42±1.14 mm in male and 3.10±1.05 mm in female was reported by Seker S and Tas I which was significantly higher in men (p=0.021) [2]. It was 3.114±0.9513 mm in males and 3.083±1.056 mm in females, as reported by Kayastha P et al., using ultrasound. In their study, the thickness of isthmus positively correlated with BMI, BSA, weight (with all p-values=0.0001) and height (p=0.004) [38]. Similarly, in our study, a positive correlation of thickness of thyroid isthmus with height, weight, BMI, BSA, LBM and NC was observed. But, none of these associations for each of these anthropometric variables were found to be statistically significant which keeps our finding different from others. Also, there is a paucity of literature available on the normative values for thickness of thyroid isthmus, so our findings could not be compared well regarding this.
Using statistical analysis in our study, a weakly positive correlation of total thyroid volume with thickness of thyroid isthmus was found. It wasn’t statistically significant among males (p=0.259, r=0.159). It was significant for females (p=0.043, r=0.287) and while taking total subjects into consideration (p=0.009, r=0.259). Not much literature is available till date stating the correlation between the two, which makes our findings distinctive from the rest. Authors could find only a study conducted by Kayastha P et al., which showed notably high positive correlation of total thyroid volume with thickness of thyroid isthmus (p<0.001, r=0.373). They deduced that measurement of thyroid isthmus thickness could possibly guide the thyroid volume, which itself was the most frequently used parameter for evaluation of thyroid size in diffuse thyroid diseases [38]. To compare our results more effectively with other ethnic groups, further studies in children as well as older age group, are required. Authors also believe that there is a need for future studies on larger samples from our region.
Limitation(s)
In the present study, the study participants were young individuals who attended classes in the Department of Anatomy of the University. The age of study subjects was within 17-24 years. It was also realise that the sample size of 100 is a limitation of the current study given the time constraint and feasibility for the conduction of this study.
Conclusion(s)
The right thyroid volume was significantly greater than left. The total thyroid volume was significantly greater in males than females and its correlation with the studied anthropometric parameters was significant. The thickness of thyroid isthmus was greater in males than females and its correlation was significant only with LBM and NC.
‘t’=3.495; ‘p’=0.001 (Paired t-test); SD: Standard deviation
Quartile-wise distribution for height: Q1 (148-156 cm), Q2 (157-164.9 cm), Q3 (165-171.70 cm) Q4 (≥171.75 cm); for weight: Q1 (37-53.24 kg), Q2 (53.25-59.49 kg), Q3 (59.50-65.99 kg), Q4 (≥66.0 kg). Mod: Moderate
Quartile-wise distribution for BSA: Q1 (1.28-1.51 m2), Q2 (1.52-1.63 m2), Q3 (1.64-1.75 m2), Q4 (≥1.76 m2); for LBM: Q1 (32.01-40.10 kg), Q2 (40.11-45.63 kg), Q3 (45.64-53.33 kg), Q4 (≥53.34 kg); Mod: Moderate; BSM: Body surface area; LBM: Lean body mass; NC: Neck circumference