As per World Health Organisation (WHO) there are more than two million cases of breast cancer in the world. It is the most common cancer in Indian women forming 14% bulk of all cancers. In India, the giant killer has an uglier face, here the age adjusted rate of prevalence is as high as 25.8 per 100,000 women with mortality as high as 12.7 per 100,000 women [1,2].
Therapeutic plans include surgical options, targeted chemo radiotherapy, hormonal therapy and immunotherapy. To facilitate the targeted therapies, the pathologically heterogeneous groups of breast cancer are divided into five types as per their Immunohistochemistry (IHC) features. Luminal A, Luminal B, Normal Type, HER2/neu positive and basal like which is TNBC. TNBC is defined by lack of expression of all three receptors, Estrogen Receptor (ER), Progesterone Recepptor (PR) and HER2/neu (Human Epidermal growth factor Receptor 2). This feature makes TNBC unfit for targeted hormonal and immunotherapies and hence makes it the most aggressive molecular type of breast cancers [3,4]. Also, frequently associated BRCA1 (BReast CAncer gene 1) mutation, early age of onset, lack of definite oncogenic factor with earlier metastases and lesser disease free periods make TNBC a dreaded clinical diagnosis [5,6].
One major reason of higher mortality rate in India is relatively more prevalence of TNBC than the western world where TNBC range from 12-17% of all breast cancers. While in India, a recent meta-analysis observed a 24-31% incidence of TNBC which is comparable to African American women [6,7].
The most efficient clinical tool in fighting TNBC remains early diagnosis since the aggressive disease if diagnosed late leaves few therapeutic options available. The definite diagnosis of TNBC relies on IHC, which in a country like India is not easily available and is not very cost effective. Though, IHC remains prudent for diagnosis and cannot be replaced, an attempt can be made by other diagnostic modalities to pick up TNBC early and alert the clinician [8]. In India, this task can be taken up by easily available and cost-effective radiological modalities of mammography and USG.
This study thus aims to analyse the specific mammographic and USG features of TNBC in comparison with non-TNBC, with an attempt to identify significant imaging predictors of TNBC.
Materials and Methods
The present retrospective case-control study was performed at All India Institute of Medical Science, Rishikesh, Uttarakhand, India, in foothills of Northern India, as per the Institute’s Ethical Committee norms via Letter No. AIIMS/IEC/19/710. The study analyses the imaging features of 50 histopathologically proven cases of TNBC in comparison with 50 non-TNBC cases over a period of one year from September 2018 to August 2019. The sample size comprised of all confirmed TNBC presenting to the Department of Integrated Breast Clinic in one year.
Inclusion criteria: All pathologically proven cases of breast cancer which had undergone preoperative mammography and USG at this institute and were found to be negative for all three hormonal receptors expression (ER, PR and HER2/neu) on IHC were included in the study. Fifty age matched cases of non-TNBC (with any one or more receptors positive on IHC) were taken as control group.
Exclusion criteria: Patients who underwent only one radiological investigation. Patients who did not undergo IHC examination at our institute. Patient who had undergone previous surgical treatment or radiotherapy procedures.
Study design: After obtaining the data of all patients undergoing mammographic and ultrasonographic examinations at the centre in the study period, their Histopathological Examinations (HPE) and IHC examination results were obtained from the hospital database and analysed. Out of the 287 patients which had undergone HPE, 50 were confirmed to be TNBC and were included in present study. Another 50 patients of histopathologically proven breast cancer, which were non-TNBC on IHC, were selected by the radiologist who was blinded to the HPE results, for control group after age matching with the TNBC group.
The imaging features of pathologically proven TNBC on both mammography and USG were retrospectively, independently analysed and recorded by two radiologists with ten years’ and two years’ experience in breast imaging. In case of inter-observer variability, the senior Radiologist’s opinion presided. Each morphological parameter of the lesions was analysed and compared for both modalities. On mammography, breast density, lesion laterality, focality, lesion size, mammographic characters of mass with or without calcification, only calcification, architectural distortion or asymmetry, shape, margins, density, calcification and features in surrounding breast were documented. On USG, mass or non-mass characterisation, size, shape, echogenicity, vascularity and posterior features were documented for each lesion.
The imaging features were analysed and classified according to BIRADS ACR 5th edition (Breast Imaging Reporting and Data base; American College of Radiology) [9]. Sonography was performed using linear high frequency (10 MHz) probe of “MINDRAY” Diagnostic Ultrasound System, Model: Z6 scanner and Mammography was performed using Hologic Selenia Dimensions, Hologic (USA). Full field digital mammography with medio-lateral- oblique and cranio-caudal views was obtained. Digital breast tomosynthesis was done in all diagnostic mammograms. Additional views were obtained when required.
Statistical Analysis
Quantitative variables were analysed as mean, medians and percentages. Inter-modality agreement was measured using Cohen’s Kappa coefficient (this is regarding both modalities, interobserver question has been answered above). Comparative analysis of features of TNBC and non-TNBC was done using Chi-square/Fischer’s-exact test. The p-value <0.05 was considered significant. Predictive values of each morphological parameter were assessed by linear and multivariate regression models. All calculations were done on Microsoft Excel and Graph Pad Version 8.4.2.
Results
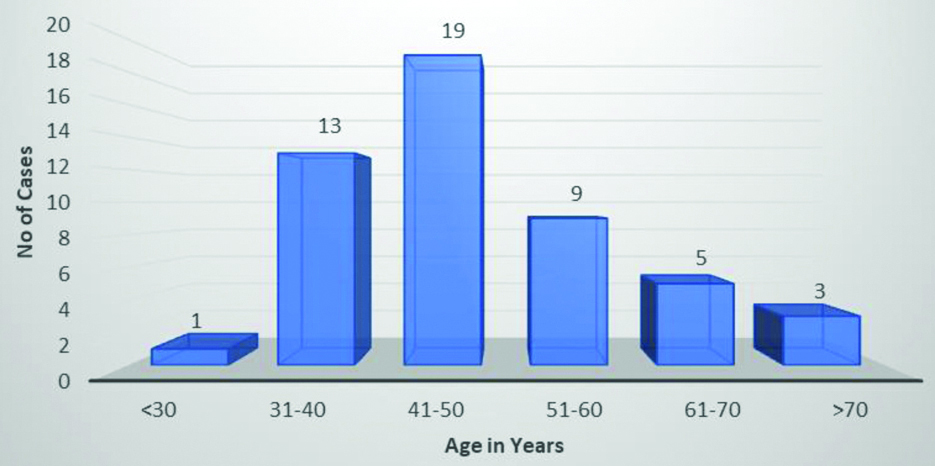
Prevalence of TNBC amongst breast cancer patients was found to be 17.4%. The demographic profile consisted of women from 26-82 years of age with maximum cases in the 5th decade [Table/Fig-1]. The non-TNBC group was chosen after relevant age matching. While pre-menopausal women formed the bulk of TNBC patients (n=31, 62%), Post-menopausal patients (n=26, 52%) had a slightly higher prevalence in the non-TNBC group. It was observed that a vast majority of TNBC was detected by self/clinical examination (n=46, 92%), more likely than the non-TNBC cancers (n=42, 84%), however the difference was not statistically significant. Clinical profile of patients is described in [Table/Fig-2].
Age distribution in the study group.
Clinical profile of patients (TNBC=Triple Negative Breast Cancer).
| S.No. | Variable | TNBC | % | non-TNBC | % | p-value (<0.05) |
|---|
| N=50 | N=50 |
|---|
| 1. | Age (In years) |
| Mean | 49.06 | | 50.51 | | |
| Range | 26-82 | | 25-81 | | |
| 2. | Menstrual status |
| Pre-menopausal | 31 | 62 | 24 | 48 | 0.2276 |
| Post-menopausal | 19 | 38 | 26 | 52 |
| 3. | Detection of Lesion |
| Examination | 46 | 92 | 42 | 84 | 0.3576 |
| Imaging | 4 | 8 | 8 | 16 |
| 4. | Focality |
| Unifocal | 40 | 80 | 40 | 80 | |
| Multifocal | 8 | 16 | 5 | 10 | |
| Diffuse | 2 | 4 | 5 | 10 | |
| 5. | Breast Involved |
| Right | 21 | 42 | 23 | 46 | 0.8405 |
| Left | 27 | 54 | 26 | 52 |
| Bilateral | 2 | 4 | 1 | 2 |
p-value not calculated for all descriptors especially where overlapping descriptors in one variable.
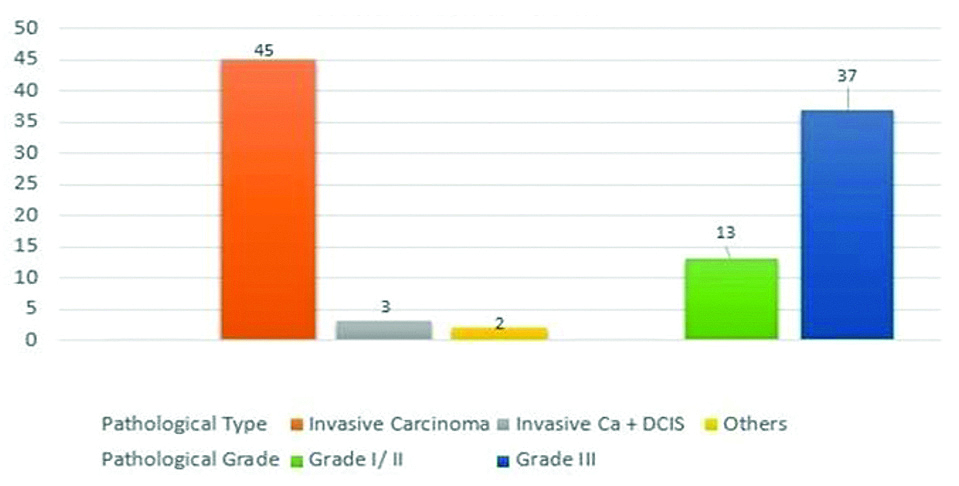
On pathological analysis, as many as 2/3rd of TNBC were found to be high grade (Grade III) tumours. Infiltrating ductal carcinoma without Ductal Carcinoma in-situ (DCIS) was the most common pathological diagnosis, forming 90% of the study group. Pathological analysis is presented in [Table/Fig-3].
Pathological profile of TNBC in study group.
Mammographic features of both TNBC and non-TNBC cases are documented in [Table/Fig-4]. Corresponding to the pre-menopausal prevalence, Type C breasts were more common in TNBC, Type B predominance was seen in the non-TNBC group. Both types of lesions showed predominant involvement of the upper outer quadrant without any statistically significant difference. A higher mean size of 4.9 cm was measured for TNBC as against 3.9 cm of non-TNBC, again highlighting the aggressive nature of the former, however this difference was not statistically significant. The most common mammographic feature of TNBC was mass without calcification (n=32, 64%) and the second most common presentation was mass with calcification (n=9, 18%). Only micro calcifications in absence of a mass was not found in any case of TNBC. While calcification with or without mass was a more frequent occurrence in the non-TNBC group, overall the two groups did not show statistically significant difference (p=0.07). A negative mammogram suggesting an occult disease was seen in 6% patients of TNBC while no patient of non-TNBC showed the same. The two statistically significant mammographic differences in the two groups were observed in shape and margins of the lesions. TNBC showed round/oval shape in more than half of the cases (n=27, 54%) while non-TNBC showed such shape in only one fourth cases (n=12, 24%) (p=0.001). Lobulated margins formed the major bulk of TNBC (n=19, 38%) while spiculated were the most common in Non-TNBC (n=20, 40%), (p=0.0023).
Mammographic features of TNBC and non-TNBC along with statistical association with TNBC (chi-square test, p<0.05) (sig: significant).
| S.No. | Variable | TNBC | % | non-TNBC | % | p-value |
|---|
| N=50 | N=50 | (<0.05) |
|---|
| 1. | Breast density |
| A | 6 | 12 | 7 | 14 | |
| B | 16 | 32 | 22 | 44 | |
| C | 22 | 44 | 15 | 30 | |
| D | 6 | 12 | 6 | 12 | |
| 2. | Location within breast |
| Upper outer | 23 | 46 | 22 | 44 | 0.8407 |
| Upper inner | 10 | 20 | 6 | 12 | |
| Upper central | 5 | 10 | 3 | 6 | |
| Lower outer | 2 | 4 | 4 | 8 | |
| Lower inner | 4 | 8 | 4 | 8 | |
| Lower central | 0 | 0 | 0 | 0 | |
| Retro | 4 | 8 | 11 | 22 | |
| All/Diffuse | 2 | 4 | 0 | 0 | |
| 3. | Size (In cm) |
| Mean | 4.9 | | 3.89 | | |
| Range | 1.5-12 | | 1.8-10 | | |
| 4. | Mammographic findings |
| Mass without calcification | 32 | 64 | 26 | 52 | 0.3110 |
| Mass with calcification | 9 | 18 | 13 | 26 | 0.0716 |
| Only microcalcification | 0 | 0 | 5 | 10 | |
| Focal asymmetry/architectural distortion | 6 | 12 | 6 | 12 | |
| Negative | 3 | 6 | 0 | 0 | |
| 5. | Mammographic features |
| Shape | | | | | <0.001(highly sig) |
| Round/Oval/Lobulated | 27 | 54 | 12 | 24 |
| Irregular | 20 | 40 | 38 | 76 |
| Margins | | | | |
| Circumscribed | 8 | 16 | 2 | 4 | 0.0023(highly sig) |
| Obscured | 6 | 12 | 6 | 12 |
| Lobulated | 19 | 38 | 5 | 10 |
| Irregular | 9 | 18 | 17 | 34 |
| Spiculated | 5 | 10 | 20 | 40 |
| 6. | Axillary lymph nodes |
| Yes | 22 | 44 | 21 | 42 | 0.8399 |
| No | 28 | 56 | 29 | 58 |
| 7. | BIRADS |
| 0/1 | 3 | 6 | 0 | 0 | 0.0360 (sig) |
| 2 | 0 | 0 | 0 | 0 |
| 3 | 2 | 4 | 4 | 8 |
| 4 | 18 | 36 | 8 | 16 |
| 5 | 27 | 54 | 38 | 76 |
p-value not calculated for all descriptors especially where overlapping descriptors in one variable
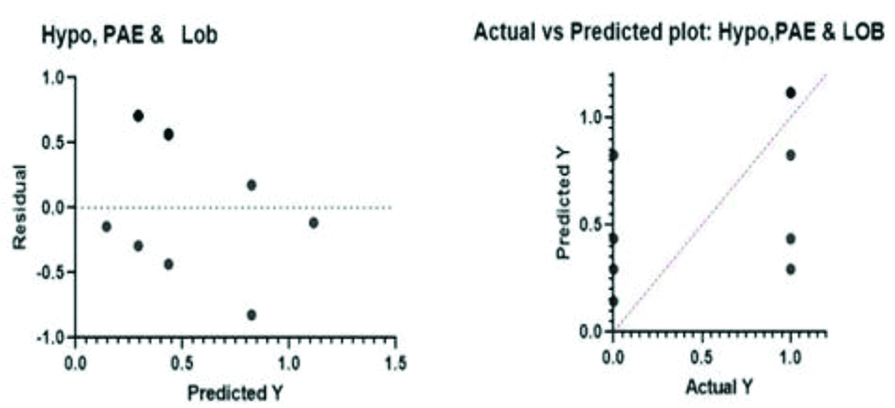
On ultrasonographic examination [Table/Fig-5], TNBC presented as a definite mass in almost all (98%) of the study population, with no negative sonograms. While evaluating the lesion characters, again a round/oval shape (n=26, 52%) and lobulated margins (n=22, 44%) were found to be predominant imaging features. Additionally, hypo-echogenicity (n=38, 76%) was also a significant feature of TNBC in comparison to non-TNBC (n=21, 42%) correlating with the higher number of pathological aggressive lesions in TNBC (n=37, 74%). The major sonographic descriptor of TNBC was found to be PAE (n=27, 54%) with extremely significant difference from control group (n=04, 8%, p<0.001) and high predictability for TNBC (R2=0.2473, p<0.0001).
Ultrasonographic features of TNBC and non-TNBC along with statistical association with TNBC (chi-square test, p<0.05) (SIG: significant).
| S.No. | Variable | TNBC | % | non-TNBC | % | p-value |
|---|
| N=50 | N=50 | (<0.05) |
|---|
| 1. | USG findings |
| Mass | 49 | 98 | 43 | 86 | 0.0594 |
| Non-mass | 1 | 2 | 7 | 14 |
| 2. | Size (In cm) |
| Mean | 5.6 | | 4.1 | | |
| Range | 1.8-12 | | 1.5-10 | | |
| 3. | Ultrasonographic features |
| Shape |
| Round/Oval/Lobulated | 26 | 52 | 10 | 20 | 0.0018(highly sig) |
| Irregular | 24 | 48 | 40 | 80 |
| Margins |
| Circumscribed | 6 | 12 | 2 | 4 | 0.0296(Sig) |
| Obscured | 1 | 2 | 1 | 2 |
| Lobulated | 22 | 44 | 8 | 16 |
| Irregular/Indistinct | 18 | 36 | 22 | 44 |
| Spiculated | 3 | 6 | 17 | 34 |
| Echogenicity |
| Anechoic | 0 | 0 | 0 | 0 | 0.0011(highly sig) |
| Hypoechoic | 38 | 76 | 21 | 42 |
| Heteroechoic | 12 | 24 | 29 | 58 |
| Vascularity |
| No | 5 | 10 | 3 | 6 | 0.426 |
| Minimal | 28 | 56 | 23 | 46 |
| Significant | 17 | 34 | 24 | 48 |
| Posterior features |
| No/Mixed | 19 | 38 | 28 | 56 | <0.001(highly sig) |
| Enhancement | 27 | 54 | 4 | 8 |
| Shadowing | 4 | 8 | 18 | 36 |
| 4. | Axillary nodes on USG | 0.5265 |
| Yes | 35 | 70 | 31 | 62 |
| No | 15 | 30 | 19 | 38 |
| 5. | BIRADS |
| 0/1 | 0 | 0 | 0 | 0 | 0.6234 |
| 2 | 0 | 0 | 0 | 0 |
| 3 | 0 | 0 | 0 | 0 |
| 4 | 12 | 24 | 9 | 18 |
| 5 | 38 | 76 | 41 | 82 |
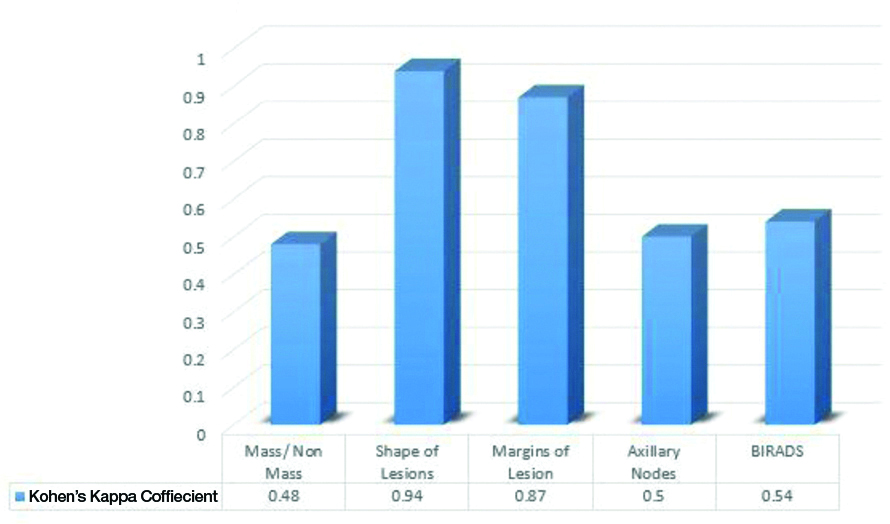
Comparisons of both modalities in overall agreement over features of TNBC and non-TNBC are depicted in [Table/Fig-6a,b].
Intermodality agreement between mammography and USG by Cohen’s Kappa for TNBC.
Interpretation of Kappa values : >0.8=Excellent Agreement, 0.6-0.8=Good Agreement, 0.4-0.6=Moderate Agreement, 0.2-0.4=Fair Agreement, 0.2=No or slight agreement
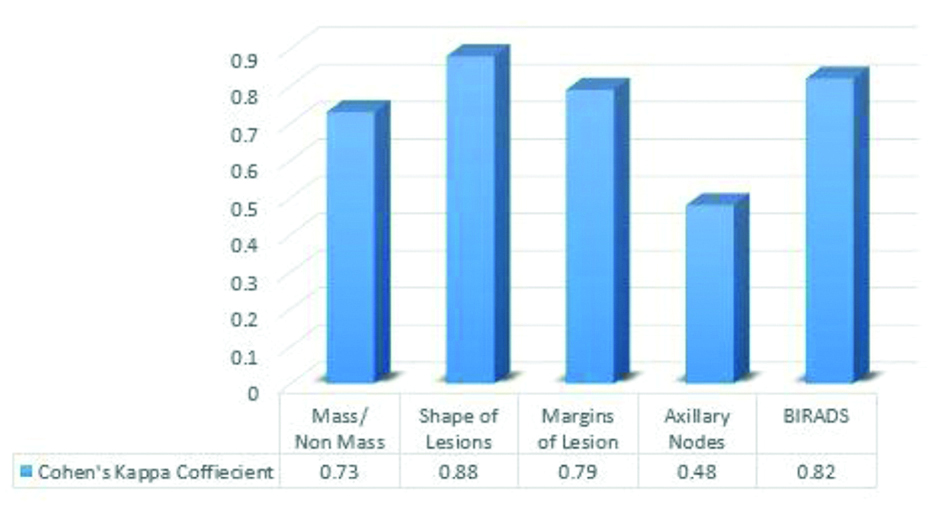
Intermodality agreement between mammography and USG by Cohen’s Kappa for non-TNBC.
Interpretation of Kappa values: >0.8=Excellent Agreement, 0.6-0.8=Good Agreement, 0.4-0.6=Moderate Agreement, 0.2-0.4=Fair Agreement, 0.2=No or slight agreement
With an attempt to pick up predictors of TNBC on imaging, author assessed lesion characters via regression models to find that single as well as combination of features which can be marked as statistically significant imaging predictors of TNBC. Results are depicted in [Table/Fig-7,8a,b,9a,b,c]. Few representative cases are shown in [Table/Fig-10,11 and 12].
Regression analysis for significant predictive factors of TNBC on mammography and USG.
| Linear regression (predictive value of single imaging finding) |
|---|
| | 95% CI | R2 | p-value |
|---|
| Mammography |
| 1. | Shape: Round/Oval | 0.1194-0.5111 | 0.0945 | 0.0019 (<0.005) |
| 2. | Margins: Lobulated | 0.1617-0.6058 | 0.1075 | 0.0009 (<0.001) |
| Ultrasonography |
| 1. | Shape: Round/Oval | 0.1501-0.5444 | 0.1111 | 0.0007 (<0.001) |
| 2. | Margins: Lobulated | 0.1248-0.5419 | 0.0933 | 0.0020 (<0.005) |
| 3. | Echogenicity: Hypoechoic | 0.1599-0.5429 | 0.1195 | 0.0004 (<0.001) |
| 4. | Posterior acoustic enhancement | 0.3493-0.7259 | 0.2473 | <0.0001 |
| Multivariate regression analysis (predictive value of multiple imaging findings together) |
| | Degrees of Freedom | R2 | p-value |
| Mammography | | | |
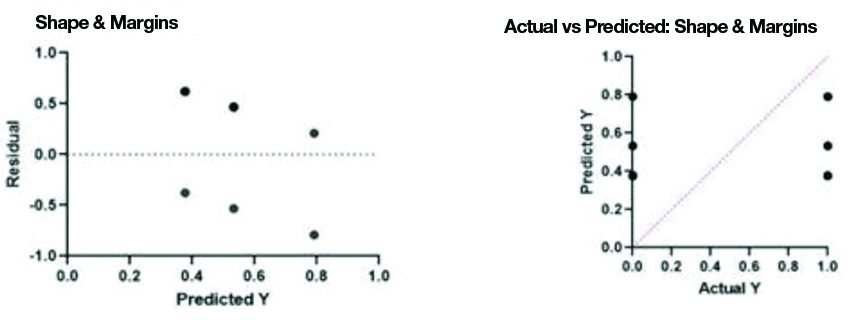
| 1. | Round/Oval Shape + Lobulated Margins | 97 | 0.1192 | 0.0021 (<0.005) |
| Ultrasonography |
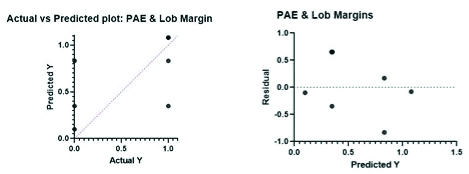
| 1. | Lobulated Margins + Posterior Acoustic Enhancement | 97 | 0.2670 | <0.0001 |
| 2. | Lobulated Margins + Posterior Acoustic Enhancement + Hypoechogenicity | 96 | 0.2798 | <0.0001 |
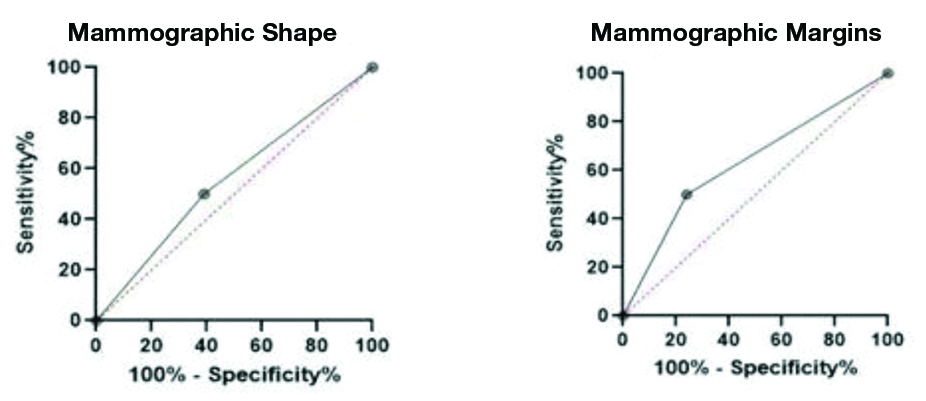
ROC curves for mammographic features: Round/Oval Shape (Area Under Curve: 0.5550) and lobulated margins (Area under curve: 0.6300).
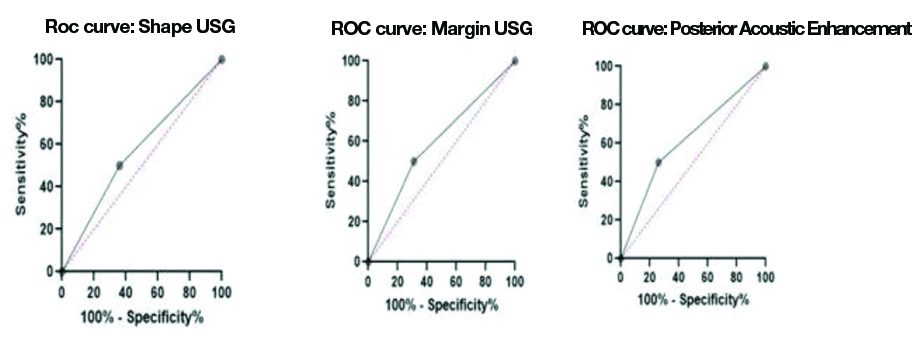
ROC curves for USG Features: Round/Oval shape (area under curve (AUA): 0.5700), lobulated margins (AUA: 0.5950) & Posterior Acoustic Enhancement (PAE) (AUA: 6200).
Multivariate Regression Analysis (MVA) for Round/Oval Shape and lobulated margins on mammography. p-value <0.005, R2: 0.1192).
Multivariate Regression Analysis (MVA) for Posterior Acoustic Enhancement (PAE) and Lobulated margins. p-value <0.0001, R2: 0.2670).
Multivariate Regression Analysis (MVA) for hypoechogenicity, Posterior Acoustic Enhancement (PAE) and lobulated margins. p-value <0.0001, R2: 0.2798).
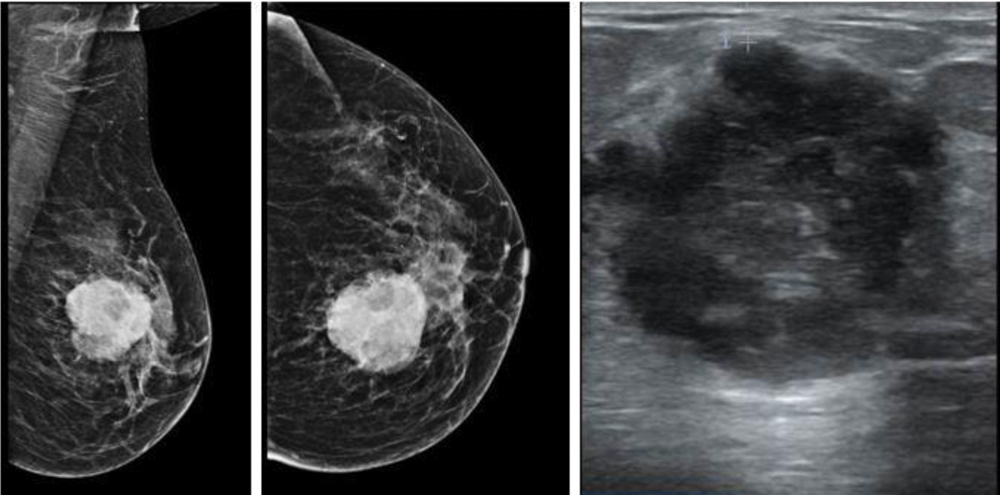
Mediolateral Oblique (MLO) and Craniocaudal (CC) view mammograms of left breast show high density, oval lesion in upper inner quadrant with lobulated margins, which corresponded to an oval hypoechoic lesion on ultrasonography and multilobulated margins and posterior acoustic enhancement.
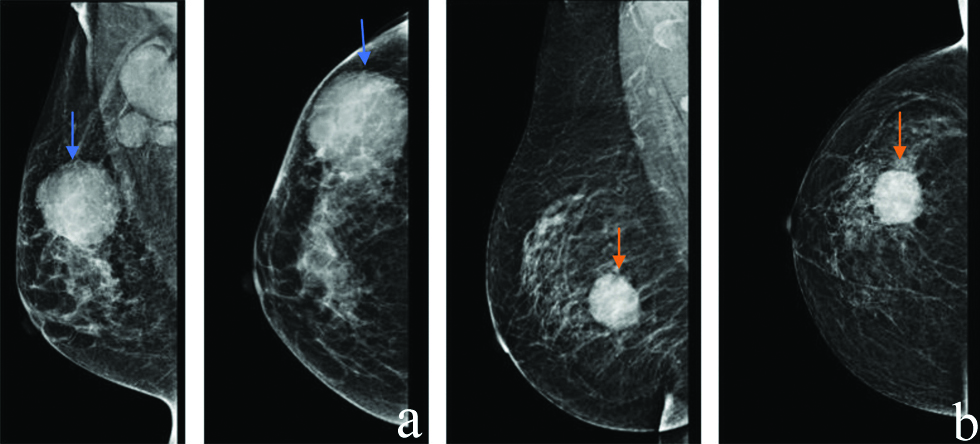
a) MLO and CC view mammograms show a large round to oval high density lesion with lobulated margins (blue arrow) and surrounding mild architectural distortion and enlarged high density axillary nodes. b) MLO and CC view mammograms show a round high density lesion in lower outer quadrant (Orange arrow) with no associated calcification or architectural distortion. Lesion shows lobulated margins.
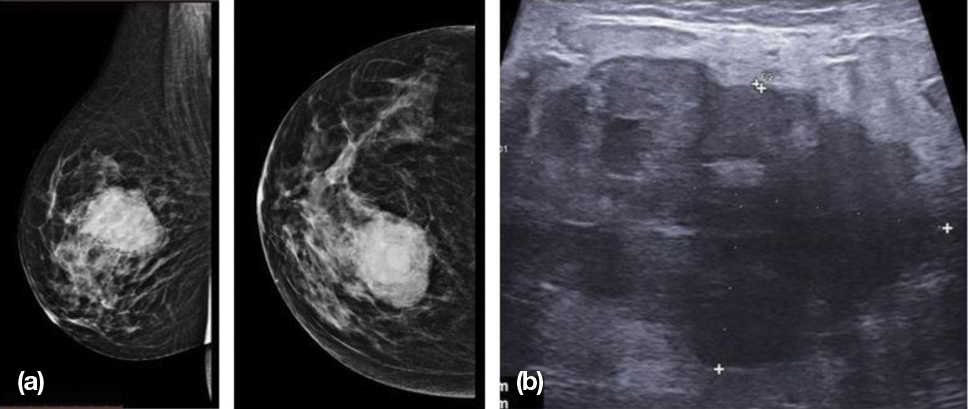
MLO and CC views of mammogram show a high density oval mass in upper inner quadrant with multilobulated margin and a radiolucent rim. On USG evaluation, lesion was heterogeneously hypoechoic with multiple lobulations and Posterior Acoustic Enhancement (PAE).
Discussion
TNBC is a disease of younger females with an aggressive nature and often lethal outcomes. A recent study indicated a 26% prevalence in Indian population [10]. The prevalence of TNBC was 17.4% in this study with a premenopausal predominance. The mean age group in present study population was 49 years, similar to the observations of Gao B et al., (48.9 years) and Ko ES et al., (49 years) [4,11]. The most prevalent pathological diagnosis was Invasive Ductal Carcinoma which consisted of more than 3/4th of the study group similar to the studies of Gao B et al., and Boisserie-Lacroix M et al., [4,8].
Authors assessed that TNBC are more likely to be diagnosed by self/clinical examination with 92% of the study population being diagnosed of having a breast lump by examination. This may be attributed to the faster growth rate and the aggressive mass forming ability of TNBC in lack of DCIS comparison to non-TNBC which may consist of an earlier DCIS component not presenting as a palpable lump [4,11,12]. Similar observations were made in literature by Dogan BE and Turnbull LW (91%) and Dent R et al., (71%) [5,13]. Authors found that 16% (n=8) cases were multifocal in TNBC group in comparison to only 10% (n=5 cases) in non-TNBC group, another attribute of tumour aggression. Boisserie-Lacroix M et al., while studying 73 TNBC cases, found a 21% multifocality in their study group [8]. They also recorded an upper outer quadrant predominance (46.6%) in their study group, similar to present study observations (46%).
Mammographic Features
As observed in various studies in literature, TNBC has a younger peak which depicts a more common Type C breast density (43-66 %), similar to present study observations of 44% prevalence of Type C mammographic breast density [4,6,8]. This further explains the more number of negative mammograms in TNBC (Six percent), as the higher breast density obscures small masses and makes detection difficult at times [4,6,14].
The most common mammographic presentation of TNBC in various study groups remains as a mass without calcification [Table/Fig-13] [4-6,8,11,12,14]. The lack of calcification is explained by a fast growth of invasive tumour without any preceding duct in-situ component. The mammographic calcifications are representations of ductal components of tumours and hence the lack of the latter prevents the appearance of the former in TNBC [4,8,11,14]. Another, striking mammographic feature is a round/oval shape without any architectural distortion suggesting that the tumour leaves no time for surrounding desmoplastic reaction often seen in other typical cases of breast cancer [8]. Microlobulated margins in absence of spiculations were also a striking feature with similar prevalence in recent TNBC literature groups. It was observed that these atypical features often resulted in the mammographic assignment of BIRADS 4 category for TNBC, instead of a confident BIRADS 5 [4,8]. Thus, the role of ultrasonography was found prudent which led to the final upgradation of BIRADS with a confident axillary diagnoses and other additional markers of TNBC.
Comparative analysis of mammographic features of TNBC with literature [4-6,8,11,12,14].
| Study | Mammographic Feature | Shape | Margins |
|---|
| Number of Patients | Negative Mammogram (%) | Mass without calcification (%) | Mass with calcification (%) | Only calcification (%) | Focal asymmetry/ Architectural Distortion (%) | Round/ Oval(%) | Lobulated (%) |
|---|
| Gao B et al., [4] | 54 | 0 | 63 | 16.7 | 5.6 | 14.8 | 58.1 | 25.6 |
| Dogan BE and Turnbull LW [5] | 43 | 9.3 | 53.5 | 4.7 | 7.0 | 20.9 | 60 | |
| Krizmanich-Conniff KM et al., [6] | 207 | 2 | 58 | 29 | 7 | | 31 | 5.0 |
| Boisserie-Lacroix M et al., [8] | 73 | 15.9 | 59.3 | 10.2 | 13.6 | 16.9 | 55 | 12.5 |
| Ko ES et al., [11] | 87 | 0 | 49 | 21 | 7 | 22.0 | | |
| Yang WT et al., [12] | 38 | 13 | 85 | 15 | 0 | 0 | 48 | |
| Wang Y et al., [14] | 33 | 18 | 48 | 12 | 9.0 | 12 | 50 | 5.0 |
| Present Study | 50 | 6 | 64 | 18 | 0 | 12 | 54 | 38 |
Ultrasonographic Findings
Since occult disease cannot be ruled out on mammography, ultrasonographic support is essential for diagnosis. Also, higher breast density in these patients makes ultrasound a prudent addition. Various study groups [Table/Fig-14] observed a higher rate of lesion detection on ultrasonography, similar to present study where authors detected 98% of lesions on USG [6,8,11,14-16]. Most common ultrasonographic appearance of TNBC was found to be hypoechoic, round/oval mass with micro-lobulated margins, similar to the observations of Gao B et al., and Krizmanich-Conniff KM et al., [4,6]. These features may lead to a misrepresentation and even a benign diagnosis, hence a confident clincher on USG was found to be the presence of PAE in 54% cases of TNBC in comparison to only 8% cases of non-TNBC group (p<0.001), precisely similar to the findings of Li Z et al., [15]. Krizmanich-Conniff KM et al., Boisserie-Lacroix M et al., and Ko ES et al., also emphasised the importance of PAE in TNBC detection [6,8,11]. Only few studies have studied the colour doppler features of TNBC including Rashmi S et al., Kojima Y et al., and Shin HJ et al., which are in concordance with present findings that 56% of TNBC cases showed at least minimal vascularity on colour doppler study in comparison to 46% in non-TNBC group [3,16,17].
Comparative analysis of USG features of TNBC with literature [6,8,11,14-16].
| Study | Ultrasonographic feature | Shape | Margins |
|---|
| Negative (%) | Mass (%) | Non-mass (%) | Hypoechoic (%) | PAE (%) | Round/Oval (%) | Lobulated (%) |
|---|
| Boisserie-Lacroix M et al., [8] | 5.5 | 92.8 | 7.2 | 87.6 | 35.5 | 65.1 | 39.7 |
| Krizmanich-Conniff KM et al., [6] | 2 | 98 | 0 | 92 | 23 | 43 | 38 |
| Li Z et al., [15] | | | | 48 | 82 | 32 | 54 |
| Wang Y et al., [14] | 21 | 79 | 0 | 80 | | 46 | 33 |
| Kojima Y and Tsunoda H [16] | 0 | 92.5 | 7.5 | 29 | | 70.2 | |
| Ko ES et al., [11] | 0 | 86 | 14 | 48 | | 17 | 9 |
| Present Study | 0 | 98 | 2 | 76 | 54 | 52 | 44 |
Since ACR BIRADS 5th edition [9] recommends a single final BIRADS assessment after multimodality evaluation, it is essential to evaluate the intermodality concordance between mammographic and ultrasonographic appearance of TNBC to arrive at a meticulous diagnosis [Table/Fig-6a,b]. As already discussed, occult mammograms are more likely than occult sonograms in TNBC both modalities could show only moderate agreement in lesion detection. Though authors found that for evaluating lesion characters such as shape and margins, both modalities showed excellent agreement (K >0.8). Also, in axillary assessment, USG was the better modality with 70% detection in TNBC cases as against 44% detection in mammography. Pertaining to the above mentioned discrepancies in lesion detection and axillary evaluation, both modalities showed only moderate agreement in final BIRADS assessment with USG making a 22% higher BIRADS 5 diagnosis, hence being the better modality.
Predictors of TNBC
With the final aim of demarking imaging predictors of TNBC, linear and multivariate regression analysis were done on various morphological features of TNBC appearing on both modalities. We observed that PAE (p<0.0001: AUC: 0.6200) on USG was the single strongest imaging predictor of TNBC in present study, followed by lobulated margins on mammography (p<0.001: AUC: 0.6300), round/oval shape (p<0.001: AUC: 0.5700), and hypoechogenicity (p<0.001) on ultrasonography. Since, a combination of these factors can lead to a more meticulous diagnosis, authors analysed that the presence of a lobulated hypoechoic mass with PAE is the most statistically confident predictor of TNBC on imaging [Table/Fig-8a,b]. This is in agreement with the study of Rashmi S et al., who deciphered that a lesion with circumscribed margins and PAE is a strong candidate for a TNBC diagnosis [3].
Limitation(s)
Along with its retrospective nature, the major limitation of present study was reference bias, since it is a tertiary institute and receive higher number of complicated cases thus depicting a higher prevalence of advanced cancers. A prospective study on a larger group may prove to be more statistically useful in proving present study aim.
Conclusion(s)
TNBC has specific imaging features on both mammography and USG which may be used as utility tools in early diagnosis and raising essential clinical alarms. Ultrasonography provides a more confident diagnosis, though a combination of clinical examination and both modalities is superior to any single modality. A round, lobulated mass on both modalities with hypoechogenicity and PAE on ultrasonography are definite red flags for TNBC on imaging.
p-value not calculated for all descriptors especially where overlapping descriptors in one variable.
p-value not calculated for all descriptors especially where overlapping descriptors in one variable