Determination of Combination Factor as an Aid in Orthodontic Treatment Planning in Western Region of Saudi Arabian Young Male Population- A Retrospective Cephalometric Study
Raghu Devanna1, Nayef H Felemban2, Yousef Althomali3, Puneet Gupta4
1 Associate Professor, Department of Preventive Dentistry, Faculty of Dentistry, Taif Saudi Arabia, Makkaha, Saudi Arabia.
2 Associate Professor, Department of Preventive Dentistry, Faculty of Dentistry, Taif Saudi Arabia, Makkaha, Saudi Arabia.
3 Associate Professor, Department of Preventive Dentistry, Faculty of Dentistry, Taif Saudi Arabia, Makkaha, Saudi Arabia.
4 Reader, Department of Community Dentistry, Government College of Dentistry, Indore, Madhya Pradesh, India.
NAME, ADDRESS, E-MAIL ID OF THE CORRESPONDING AUTHOR: Dr. Raghu Devanna, HUWAYA, Taif Saudi Arabia, Makkaha, Saudi Arabia.
E-mail: drraghu@tudent.edu.sa
Introduction
Diagnosis and treatment planning in orthodontics determines the treatment outcome and long term stability. Cephalometric radiography is an essential diagnostic aid in orthodontics and hence numerous studies have been carried out in the past.
Aim
To determine the Combination Factor (CF) through evaluation of the mean Overbite Depth Indicator (ODI) and Anteroposterior Dysplasia Indicator (APDI) values in western region of Saudi Arabian young male patients which would act as an aid in orthodontic treatment planning.
Materials and Methods
A retrospective cephalometric study was conducted on 80 Saudi Arabian young male patients ranging in age from 7 to 14 years. Data was collected from records derived from the University Dental Hospital. Patients (n=80) were divided into four age groups: ages 7 (n=20), 8-9 (n=20), 10-11 (n=20), and 12-14 (n=20) years. Lateral cephalometric images were hand-traced and measured by one standardised and calibrated investigator. Statistical analysis was done with significance level set at 0.05, assuming that the length of the 95% confidence interval was two. One-way analysis of variance, followed by the Tukey test used to compare the mean ODI and APDI values of different groups. The statistical data were analysed through SPSS version 24 for Windows (IBM SPSS, Chicago, IL, USA).
Results
The mean ODI value was 69.2688° and standard deviation 4.66670°, respectively. The overall APDI mean value was 81.7063° and standard deviation 4.18987°, respectively. There were no significant differences in the mean ODI and APDI values among different age groups (p>0.05).
Conclusion
This retrospective cephalometric study determined the CF for western region of Saudi Arabian young male population to be 150.96°. This factor can be used as a diagnostic aid for planning orthodontic treatment. When the CF, is under the norm (150.96°), the skeletal pattern tends to improve with dental extractions. A CF higher than the norm (150.96°) will maintain a better relation with a non-extraction treatment.
Anteroposterior dysplasia indicator, Lateral cephalometric radiography, Overbite depth indicator
Introduction
Orthodontic diagnosis and treatment planning involves use of essential and supplementary diagnostic aids. There are many adjunctive diagnostic aids like study model analysis, cephalometric analysis and photographic analysis. Occlusal indices have been introduced and used to rank or categorise the occlusion. Index of Orthodontic Treatment Need (IOTN), Dental Aesthetic Index (DAI), Handicapping Labio-Lingual Deviation index (HLD), and the Index of Complexity, Outcome and Need (ICON) are some of the major indices used in orthodontics [1]. Cephalometric radiography is a technique to radiographically image the skull. Lateral Cephalometric Radiography (LCR) is a standardised 2D imaging technique used in dentistry. Introduced in 1931, LCR has since then become a popular tool to study oromaxillofacial growth and development [2]. LCR and panoramic radiography are 2D imaging techniques. With the advent of 3D imaging, the cone-beam computed tomography, studying the craniofacial region has become much easier, contributing significantly to the clinical decision-making process. Still, 2D imaging is widely employed in daily orthodontic practice [3]. Orthodontists have long been interested in studying the correlation between malocclusion and facial form/structure, human craniofacial growth and development, and the determinants affecting them. LCR has rapidly emerged as an important tool to study these aspects and plan treatment henceforth.
Cephalometric analysis has been used to study differences in the dental and skeletal structures of people belonging to different racial and ethnic groups [2,4]. Data collected over the years are used to establish the standard mean values for different racial populations. An individual’s measurements can then be compared to the population mean values of facial parameters to objectively quantify the deviations from an ideal dental-cranial base relationship. Behrents RG has documented the skeletal and dental developmental changes that occur throughout adulthood [5]. Standard values for white adolescents have also been reported [6-14]. Since, it is well established that skeletal and dental features differ between races and ethnic groups and that a single standard cannot be applied to all [15-17]. Researchers have compared these characteristics of different races with the whites to establish values that can be useful for populations with diverse ethnicities [18]. Standard data for some Middle Eastern populations such as Iranians [19], Saudi Arabian, [20,21] and Egyptians [22,23] are also available.
Kim YH introduced the ODI in 1974 [24] and APDI in 1978 [25] to assess various components of malocclusion. The author examined LCRs from 119 normal occlusion white subjects (aged between 7-14 years) and 500 whites with untreated malocclusion. The study demonstrated a high correlation between incisal overbite depth and ODI, with a mean ODI of 74.58±6.08 for the sample with clinically normal occlusion, differing significantly from those without malocclusion. The mean APDI of subjects with normal occlusion was reported as 81.48±3.79; values lesser than mean indicated Class II malocclusion, while higher values indicated Class III malocclusion.
Various methods are available to analyse cephalometric data to diagnose discrepancies leading to dental malocclusion but with a variable probability [26]. Han SH and Park YS and Wen YF et al., showed that ODI and APDI are of superior diagnostic value in objective identification of the deviations in skeletal structure resulting in malocclusion [27,28]. The CF was proposed by Kim YH and the author determined this factor for whites which is 155.9° (sum of averages of ODI and APDI) [26]. It is immensely valuable in clinical practice for planning an orthodontic patient for extraction or nonextraction treatment approach. The mean ODI and APDI data of whites and Asians races are available [28,29]. There is no data available for the Saudi Arabian population as it represents a largest ethnic group in the Middle East Asia. Hence, this study aimed to determine the CF for Saudi Arabian population by obtaining ODI and APDI values as different racial groups show differences in dento-skeletal and cephalometric characteristics [28,30], this study hypothesised significant differences between the values.
Materials and Methods
This is a retrospective cephalometric study conducted on 29th October 2020. Medical records of the year 2018, 2019 and 2020 till the date of study conducted were used to retrieve data from the Faculty of Dentistry, Taif University Dental Hospital, Taif, Saudi Arabia. An ethical approval from the Ethical Decision Committee of the institution was obtained with approval number TUDENT-20-006 for using the lateral cephalometric radiographs for the purpose of the study.
Sample Size Calculation
A sample size of 80 was estimated based on power analysis [29]. Applying power analysis, with α error at 5%, and 95% confidence intervals of ±2, the above sample attained 80% power. Eighty Saudi Arabian males aged 7-14 years were chosen for the study.
Inclusion criteria: Due to issues with the availability of a sufficient number of radiographs, only male participants could be recruited. Subjects were included if: 1. Good diagnostic quality radiographs were available; 2. Angle’s Class I molar relationship; 3. Normal occlusion; and 4. Absence of dental treatment history.
Exclusion criteria: Those with malocclusion (spacing and crowding), Angle’s Class II or Class III malocclusion, and ethnicity other than Saudi Arabian were excluded.
The subjects were categorised, 20 in each group, based on their age as up to 7 years, 8-9 years, 10-11 years, and 12-14 years.
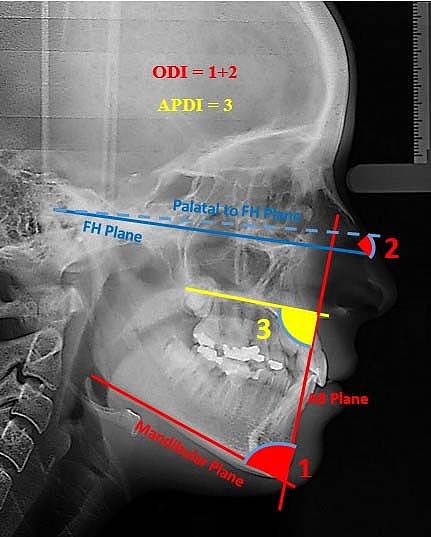
The variables calculated were ODI and APDI [Table/Fig-1]. A single experienced and trained investigator hand-traced and measured the landmarks on the radiographs. The cephalometric points and planes used for the Kim’s cephalometric analysis explained in the [Table/Fig-2]. The mandibular plane (containing menton and gonion), A-B plane (by joining point A and point B), palatal plane (formed by joining anterior (ANS) and posterior (PNS) nasal spines), and Frankfort horizontal (FH) plane were denoted to do the measurements. ODI was calculated by adding two angles-the first formed by joining the A-B plane to the mandibular plane, and the other formed by joining the palatal and the FH plane (PP-FH angle) [Table/Fig-3] [24]. With respect to the FH plane, when the palatal plane (PNS-ANS) sloped upward in anterior direction, the PP-FH angle was subtracted from the ODI. Conversely, if the palatal plane sloped downward in anterior direction (ANS), the PP-FH angle value was added to the ODI. The APDI depends on two interplanar angular measurements, measured as the angle formed between the A-B and the palatal plane [Table/Fig-3] [24,25].
Descriptive statistics of ODI and APDI values for the total study sample.
| Age (years) | Variable | n | Mean (degrees) | SD (degrees) |
|---|
| 7 | ODI | 20 | 71.2750 | 3.51865 |
| APDI | 20 | 81.1750 | 2.32987 |
| 8-9 | ODI | 20 | 68.7250 | 3.28263 |
| APDI | 20 | 82.5000 | 3.13302 |
| 10-11 | ODI | 20 | 67.6250 | 4.01273 |
| APDI | 20 | 81.7750 | 2.35905 |
| 12-14 | ODI | 20 | 69.4500 | 6.62313 |
| APDI | 20 | 81.3750 | 7.14856 |
| Total | ODI | 80 | 69.2688 | 4.66670 |
| APDI | 80 | 81.7063 | 4.18987 |
APDI: Anteroposterior dysplasia indicator; n: Number of patients; ODI: Overbite depth indicator; SD: Standard deviation
Cephalometric points and planes.
| Cephalometric points | Definition |
|---|
| Porion (Po) | A point located at the most superior point of the external auditory meatus, which is located on the odontoid process axis and passes through basion point |
| Orbitale (Or) | A point located at the lowermost point on the infraorbital margin in the middle of the lower boundaries of both orbits |
| Anterior Nasal Spine (ANS) | A point located at the apex of the anterior nasal spine of the maxilla on the lower margin of the nasal cavity |
| Posterior Nasal Spine (PNS) | A point located at the posterior limit of the hard palate at the palatine bone junction |
| Menton (Me) | A point located at the lower and posterior limits of the mental symphasis curvature at the point where the lower border of the symphasis connects the inferior border of the mandibular body |
| A Point (A) | The point of the deepest concavity anteriorly on the maxillary alveolus. To locate point A more easily, a line was performed from ANS to the most prominent point of the alveolar ridge in the upper incisor cervical region. Point A was drawn in the deepest part of the Alveolar profile in relation to the mentioned line. |
| B Point (B) | The point of the deepest concavity anteriorly on the mandibular symphysis. |
| Cephalometric planes | Definition |
| Frankfort Horizontal Plane (FH) | This plane cross porion and orbitale points |
| Palatal plane (PP) | This plane cross ANS and PNS points |
| Mandibular Plane (MP) | Formed by a line that connects the chin to the lower and posterior border of the mandibular body |
| A-B plane | This plane cross A and B points |
Kim’s cephalometric analysis- ODI and APDI angles.
The primary investigator repeated the procedure after one week on 16 radiographs, which were randomly selected from the present sample to check for intra-observer reliability. For inter-observer reliability, a second investigator independently performed the same procedure on 16 randomly selected radiographs. The values for both intra-observer and inter-observer reliabilities were high Concordance Correlation Coefficient (CCC) and were above 0.95.
Statistical Analysis
Statistical Package For The Social Sciences (SPSS) version 24 for Windows (IBM SPSS, Chicago, IL, USA) software was used for the analysis. Besides, the descriptive analyses for ODI and APDI estimations, One-way ANOVA, at p<0.05, followed by the Tukey-Kramer post-hoc testing were used to compare the different Saudi Arabian groups. Intra-observer and inter-observer reliabilities were calculated using Lin’s Concordance Correlation Coefficient (CCC) [31].
Results
The results of the present study determined the CF of 150.96° for Saudi Arabian young male population [Table/Fig-4]. A mean age of 9.8±1.5 years was recorded. Descriptive statistics for the measured values for a full sample and group-wise analysis are represented in [Table/Fig-1,4].
Descriptive statistics of ODI and APDI values for the total sample; APDI indicates Anteroposterior Dysplasia Indicator.
| Male (n) | Variable | n | Mean (degrees) | SD (degrees) | Median (degrees) | Min (degrees) | Max (degrees) |
|---|
| 80 | ODI | 80 | 69.2688 | 4.66670 | 69.0000 | 57.00 | 79.00 |
| 80 | APDI | 80 | 81.7063 | 4.18987 | 82.5000 | 61.00 | 93.00 |
| CF Value = ODI+APDI | | 150.96 | 8.84 | | | |
Min: Minimum; Max: Maximum; N: Number of patients; ODI: Overbite depth indicator; SD: Standard deviation; CF: Combination factor
ODI
The full sample ODI values ranged from 57° to 79°. The mean value was 69.26±4.67 [Table/Fig-1]. Between group analysis showed no significant differences (F=2.263, p=0.088) in the mean ODI values for Saudi Arabian male belonging to different age groups [Table/Fig-5].
Comparative statistics of ODI values for the total samples within the study groups and between the different age groups.
| ANOVA result for ODI values |
|---|
| Parameters | Sum of squares | df | Mean square | F | p-value |
|---|
| Between groups | 141.109 | 3 | 47.036 | 2.263 | 0.088 |
| Within groups | 1579.363 | 76 | 20.781 | | |
| Total | 1720.472 | 79 | | | |
ANOVA followed by post-hoc tuckey test with Significance value set at <0.05; ODI: Overbite depth indicator, df: Degree of freedom
APDI
The APDI values (n=80) ranged from 61° to 93°. The APDI values for the full sample [Table/Fig-1] were 81.71±4.18. The between group analysis resulted in no significant differences among different age groups with p-value 0.767 (p>0.05) [Table/Fig-6].
Comparative statistics of APDI values for the total sample within the study groups and between the different age groups.
| ANOVA result for APDI values |
|---|
| Parameters | Sum of squares | df | Mean square | F | p-value |
|---|
| Between groups | 20.534 | 3 | 6.845 | 0.381 | 0.767 |
| Within groups | 1366.313 | 76 | 17.978 | | |
| Total | 1386.847 | 79 | | | |
ANOVA followed by post-hoc tuckey test with significance value set at <0.05; APDI: Anteroposterior dysplasia indicator; df: Degree of freedom
Discussion
This study aimed to retrospectively study and determine CF through establishing normal cephalometric values, ODI and APDI, for the western Saudi Arabian male population. Since, the only available standard cephalometric values are based on the whites and the Asians, the facial and skeletal features are affected by racial/ethnic differences, this study chose to study the Saudi Arabian population in this respect.
Different races and ethnic groups represent different skeletal structures and dento-facial attributes [27-31]. The present study shows no statistical difference between the groups, regarding the ODI as well as APDI measure. A study done on Latin American population [32] also found similar results when ODI values were compared to white by Kim on Caucasian individuals, the results were slightly hyper divergent. Similar results were found in this study regarding ODI, although they were statistically not significant. Racial differences in the composition of each sample may have attributed to this finding. Similar results were found by Freudenthaler J et al., in Japanese and European, by Jones OG in an African American sample, by Kim JY et al., in Korean individuals, by Saloom JE in Iraqis, as well as by Romero M and Castañeda T in Mexicans [29,33-37].
A study done on African-Americans found statistically significant lower mean values of ODI and APDI as compared to mean values for the white patients [38]. The present study was done on exclusively young males and hence result could not be compared to these studies. Future study is recommended for such comparison by inclusion of both the genders for determining the values of ODI and APDI for Saudi Arabian population.
The CF measurement obtained by the sum of ODI, and APDI. The norm is 155.9° for whites [25] and represents the balance of both dimensions (Vertical-Horizontal). In the present study done on Saudi Arabian young male population, the sum of ODI and APDI show a value of 150.96°. CF is useful in preparing orthodontic treatment plan. When the CF, is under the norm (150.96°), the skeletal pattern tends to improve with dental extractions, but it is understood that it must analyse some other aspects to define this possibility. The other aspects like lip-to-tooth relationship and inter-incisal angel must also play a role in decision of extractions. On the other hand, a CF higher than the norm (150.96°) will maintain a better relation with a nonextraction treatment. The higher the CF, there will be a facial balance both in horizontal and vertical dimensions as determined by the ODI and APDI values.
Limitation(s)
The CF, ODI and APDI were determined for Saudi Arabian male population. Lack of availability of sufficient radiographs barred the authors from studying the female gender, and the effect of gender on dental, facial, and skeletal profile. The gender differences exist as the skeletal and dental features differ significantly between the genders. Further research recommended in this regard which could highlight the gender variation that may affect the CF, ODI and APDI values. The other major limitation of this study, was to not able to compare to the studies done on other ethnic groups. As the present study was done only on determining ODI, APDI and CF values of Saudi Arabian young male population, this limited the possibility of such comparison. The results of this study must be used with caution as the other soft tissue factors such as lip-to-tooth relation and inter-incisal angels were not considered in determining CF.
Conclusion(s)
This retrospective cephalometric study determined the CF for Western region of Saudi Arabian young male population to be 150.96°. This factor can be used as a diagnostic aid for planning orthodontic treatment. Further studies are recommended in future for determining the role of soft tissues in this aspect.
Min: Minimum; Max: Maximum; N: Number of patients; ODI: Overbite depth indicator; SD: Standard deviation; CF: Combination factor
ANOVA followed by post-hoc tuckey test with Significance value set at <0.05; ODI: Overbite depth indicator, df: Degree of freedom
ANOVA followed by post-hoc tuckey test with significance value set at <0.05; APDI: Anteroposterior dysplasia indicator; df: Degree of freedom
Author Declaration:
Financial or Other Competing Interests: None
Was Ethics Committee Approval obtained for this study? Yes
Was informed consent obtained from the subjects involved in the study? NA
For any images presented appropriate consent has been obtained from the subjects. NA
Plagiarism Checking Methods: [Jain H et al.]
Plagiarism X-checker: Jan 23, 2021
Manual Googling: Feb 04, 2021
iThenticate Software: Feb 09, 2021 (8%)
[1]. Borzabadi-Farahani A, An insight into four orthodontic treatment need indicesProg Orthod 2011 12(2):132-42.10.1016/j.pio.2011.06.00122074838 [Google Scholar] [CrossRef] [PubMed]
[2]. Broadbent BH, A new x-ray technique and its application to orthodontiaAngle Orthod 1931 1(2):45-66. [Google Scholar]
[3]. Scarfe WC, Farman AG, What is cone-beam CT and how does it work?Dent Clin North Am 2008 52(4):707-30.s10.1016/j.cden.2008.05.00518805225 [Google Scholar] [CrossRef] [PubMed]
[4]. Brodie AG, Cephalometric roentgenology; History, technics and usesJ Oral Surg (Chic) 1949 7(3):185 [Google Scholar]
[5]. Behrents RG, Growth in the aging craniofacial skeleton, craniofacial growth series, monograph 17 1985 Ann ArborCenter for Human Growth and Development, University of Michigan [Google Scholar]
[6]. Broadbent BH, Bolton standards and technique in orthodontic practiceAngle Orthod 1937 7(4):209-33. [Google Scholar]
[7]. Downs WB, Variations in facial relationships: Their significance in treatment and prognosisAm J Orthod 1948 34(10):812-40.10.1016/0002-9416(48)90015-3 [Google Scholar] [CrossRef]
[8]. Downs WB, The role of cephalometrics in orthodontic case analysis and diagnosisAm J Orthod 1952 38(3):162-82.10.1016/0002-9416(52)90106-1 [Google Scholar] [CrossRef]
[9]. Downs WB, Analysis of the dentofacial profileAngle Orthod 1956 26(4):191-212. [Google Scholar]
[10]. Ricketts RM, Planning treatment on the basis of the facial pattern and an estimate of its growthAngle Orthod 1957 27(1):14-37. [Google Scholar]
[11]. Riolo M, Moyers R, McNamara Jr JA, Hunter W, An Atlas of Craniofacial Growth: Cephalometric standards from the Center for Human Growth and Development 1974 Ann ArborUniversity of Michigan:261-332. [Google Scholar]
[12]. Jacobson A, The “Wits” appraisal of jaw disharmonyAm J Orthod Dentofacial Orthop 1975 67(2):125-38.10.1016/0002-9416(75)90065-2 [Google Scholar] [CrossRef]
[13]. Bishara SE, Longitudinal cephalometric standards from 5 years of age to adulthoodAm J Orthod 1981 79(1):35-44.10.1016/0002-9416(81)90099-3 [Google Scholar] [CrossRef]
[14]. McNamara Jr JA, A method of cephalometric evaluationAm J Orthod 1984 86(6):449-69.10.1016/S0002-9416(84)90352-X [Google Scholar] [CrossRef]
[15]. Wuerpel EH, On facial balance and harmonyAngle Orthod 1937 7(2):81-89. [Google Scholar]
[16]. Moyers RE, Handbook of Orthodontics 1988 Chicago, IllMosby:67 [Google Scholar]
[17]. Proffit WR, Contemporary Orthodontics 1999 St Louis, MoMosby:160-175. [Google Scholar]
[18]. Drummond RA, A determination of cephalometric norms for the Negro raceAm J Orthod 1968 54(9):670-82.10.1016/0002-9416(68)90018-3 [Google Scholar] [CrossRef]
[19]. Hajighadimi M, Dougherty HL, Garakani F, Cephalometric evaluation of Iranian children and its comparison with Tweed’s and Steiner’s standardsAm J Orthod 1981 79(2):192-97.10.1016/0002-9416(81)90317-1 [Google Scholar] [CrossRef]
[20]. Shalhoub SY, Sarhan OA, Shaikh HS, Adult cephalometric norms for Saudi Arabians with a comparison of values for Saudi and North American CaucasiansBr J Orthod 1987 14(4):273-79.10.1179/bjo.14.4.2733481279 [Google Scholar] [CrossRef] [PubMed]
[21]. Hamdan AM, Rock WP, Cephalometric norms in an Arabic PopulationJ Orthod 2001 28(40):297-300.10.1093/ortho/28.4.29711709595 [Google Scholar] [CrossRef] [PubMed]
[22]. Loutfy MS, Ponitz P, Harris JE, Cephalometric standards for the normal Egyptian faceEgypt Dent J 1971 17(1):91-100. [Google Scholar]
[23]. Bishara SE, Abdalla EM, Hoppens BJ, Cephalometric comparison of dentofacial parameters between Egyptians and North American adolescentsAm J Orthod Dentofacial Orthop 1990 97(5):413-21.10.1016/0889-5406(90)70113-Q [Google Scholar] [CrossRef]
[24]. Kim YH, Overbite depth indicator with particular reference to anterior open-biteAm J Orthod Dentofacial Orthop 1974 65(6):586-611.10.1016/0002-9416(74)90255-3 [Google Scholar] [CrossRef]
[25]. Kim YH, Vietas JJ, Anteroposterior dysplasia indicator: An adjunct to cephalometric differential diagnosisAm J Orthod 1978 73(6):619-33.10.1016/0002-9416(78)90223-3 [Google Scholar] [CrossRef]
[26]. Kim YH, Caulfield Z, Chung WN, Chang YI, Overbite depth indicator, anteroposterior dysplasia indicator, combination factor and extraction indexInt J Meaw 1994 1(1):11-32. [Google Scholar]
[27]. Han SH, Park YS, Growth patterns and overbite depth indicators of long and short faces in Korean adolescents: Revisited through mixed-effects analysisOrthod Craniofac Res 2019 22:38-45.10.1111/ocr.1225530450776 [Google Scholar] [CrossRef] [PubMed]
[28]. Wen YF, Wong HM, Lin R, Yin G, McGrath C, Inter-Ethnic/Racial facial variations: A systematic review and Bayesian meta-analysis of photogrammetric studiesPLoS One 2015 10(8):e013452510.1371/journal.pone.013452526247212 [Google Scholar] [CrossRef] [PubMed]
[29]. Freudenthaler J, Celar A, Kubota M, Akimoto S, Sato S, Schneider B, Comparison of Japanese and European overbite depth indicator and antero-posterior dysplasia indicator valuesEur J Orthod 2012 34(1):114-18.10.1093/ejo/cjq17721393373 [Google Scholar] [CrossRef] [PubMed]
[30]. Obamiyi S, Malik S, Wang Z, Singh S, Rossouw EP, Fishman L, Radiographic features associated with temporomandibular joint disorders among African, white, Chinese, Hispanic, and Indian racial groupsNiger J Clin Pract 2018 21:1495-500. [Google Scholar]
[31]. Lawrence I, Lin K, A concordance correlation coefficient to evaluate reproducibilityBiometrics 1989 45(1):255-68.10.2307/2532051 [Google Scholar] [CrossRef]
[32]. Caballero-Purizaga PJ, Arriola-Guillén LE, Watanabe-Kanno GA, Efficiency of ODI and APDI of Kim’s cephalometric analysis in a Latin American population with skeletal open biteDental Press J Orthod 2019 24(3):46-54.Maringá May/June Epub Aug 01, 201910.1590/2177-6709.24.3.046-054.oar [Google Scholar] [CrossRef]
[33]. Jones OG, A cephalometric study of 32 North American black patients with anterior open biteAm J Orthod Dentofacial Orthop 1989 95(4):289-96.10.1016/0889-5406(89)90161-3 [Google Scholar] [CrossRef]
[34]. Kim JY, Lee SJ, Kim TW, Nahm DS, Chang YI, Classification of the skeletal variation in normal occlusionAngle Orthod 2005 75(3):311-19. [Google Scholar]
[35]. Saloom JE, Anteroposterior dysplasia indicator (APDI) and overbite depth indicator (ODI) in a sample of Iraqi adults with different skeletal classesJ Bagh Coll Dent 2011 23(4):128-33. [Google Scholar]
[36]. Romero M, Implementación del análisis de Kim en población de 9-14 años de edad para el departamento de ortodoncia, UAEM. [Tesis] 2015 Toluca (MX)Universidad Autónoma del Estado de Mexico [Google Scholar]
[37]. Castañeda T, Análisis de Kim en adolescentes y adultos mexiquenses [monografia] 2015 Toluca (MX)Universidad Autónoma del Estado de México [Google Scholar]
[38]. Obamiyia S, Wanga Z, Sommersb E, Rossouwc PE, Michelogiannakisd D, Overbite depth indicator and anteroposterior dysplasia indicator cephalometric norms for African AmericansAngle Orthod 2019 89(6):897-902.10.2319/021619-116.131306073 [Google Scholar] [CrossRef] [PubMed]