The ongoing COVID-19 pandemic has caused unprecedented burdening of the healthcare professionals and healthcare system around the world with clinical and operational challenges [1]. In this scenario, early diagnosis of COVID-19 is of utmost importance, so that patients can be isolated and treated in time, eventually preventing spread of the disease, improving the prognosis and reducing the mortality. The gold standard for confirmative diagnosis of COVID-19 infection is RT-PCR however, its accuracy rate is reported to be lower [2]. Although the role of HRCT chest for diagnosis of COVID-19 is being debated, some studies have shown that it can provide improved sensitivity when associated with RT-PCR in COVID-19 suspected cases [3-6]. Findings in HRCT chest may sometimes precede the clinical symptoms, which can aid in early detection of the disease [7]. The increasing use of radiological findings in diagnosis of COVID-19 has significantly increased the radiologist’s workload. On the other hand, AI driven analysis of HRCT chest images can decrease this growing burden on radiologists, reduce the case reporting time and increase their diagnostic precision [1].
The objectives of the study were to explore the various HRCT chest findings of COVID-19 and their temporal changes in different phases of the disease. The study also aimed to propose a grading system based on the severity of HRCT chest findings by correlating with the clinical severity of the disease. An attempt was also made to assess the potential role of AI in quantitative assessment of lung parenchymal involvement in COVID-19 pneumonia in correlation with clinical severity.
Materials and Methods
This was a retrospective observational study conducted over a period of 15 weeks between 1st May 2020 and 13th August 2020 after obtaining Institutional Ethical Committee (IEC) approval (No.- KIIT/KIMS/IEC/319/2020). Informed consent was not needed as the study was conducted by retrieving data from the hospital records and there was no direct contact with patients.
Inclusion and Exclusion criteria: RT-PCR confirmed COVID-19 patients admitted to COVID hospital, KIMS, Bhubaneswar, Odisha, India, who underwent HRCT chest were included in this study. Clinically, suspected COVID-19 cases that were negative on RT-PCR testing and COVID-19 positive patients who had not undergone HRCT chest were excluded from study.
Epidemiological and Clinical Data Collection
All relevant epidemiological data (age and sex) and clinical data (symptoms and duration of symptoms) were collected from hospital records. Based on the clinical data, the patients were divided into asymptomatic and symptomatic patients. According to the COVID-19 clinical management protocol of Ministry of Health and Family Welfare, Government of India [8], the symptomatic patients were then categorised into three groups, based on the clinical severity, as follows: (i) Mild-presence of constitutional symptoms (fever/cough/sore throat/nasal congestion/headache etc.,) with no evidence of breathlessness or hypoxemia {Oxygen saturation (SpO2) ≥95%}; (ii) Moderate-presence of clinical features of pneumonia with no signs of severe disease; SpO2 ≤94% (range 90-94%) on room air; Respiratory Rate more than 24 per minute; (iii) Severe-presence of respiratory distress; SpO2 ≤89% on room air; respiratory rate >30 breaths/min.
CT Image Data Acquisition
HRCT chest scans of 2169 patients were performed using a newly installed dedicated 64 Slice CT scanner (Siemens- Somatom: Go up). During the HRCT chest scanning, patients were kept in supine position with arms raised and instructed to hold their breath during image acquisition that included whole lung volume. Scanning parameters were 1 mm slice thickness, 5 mm gap, 120 kV and 150 mA. The average time between hospitalisation and initial CT scan of chest was two days.
Image Interpretation and Analysis
The HRCT chest images were viewed with standard lung (window width 1500 HU; window level- 600 HU) and mediastinal (window width 350 HU; window level 40 HU) window settings. All images were reviewed independently by three radiologists and any disagreement was resolved by consensus. Presence and distribution of lesions like- GGO, consolidation and any specific patterns like septal thickening (reticular pattern/crazy-paving pattern), reverse halo, halo sign, etc., were noted. The presence of pleural effusion, mediastinal lymphadenopathy, pleural thickening and any other abnormalities were also noted.
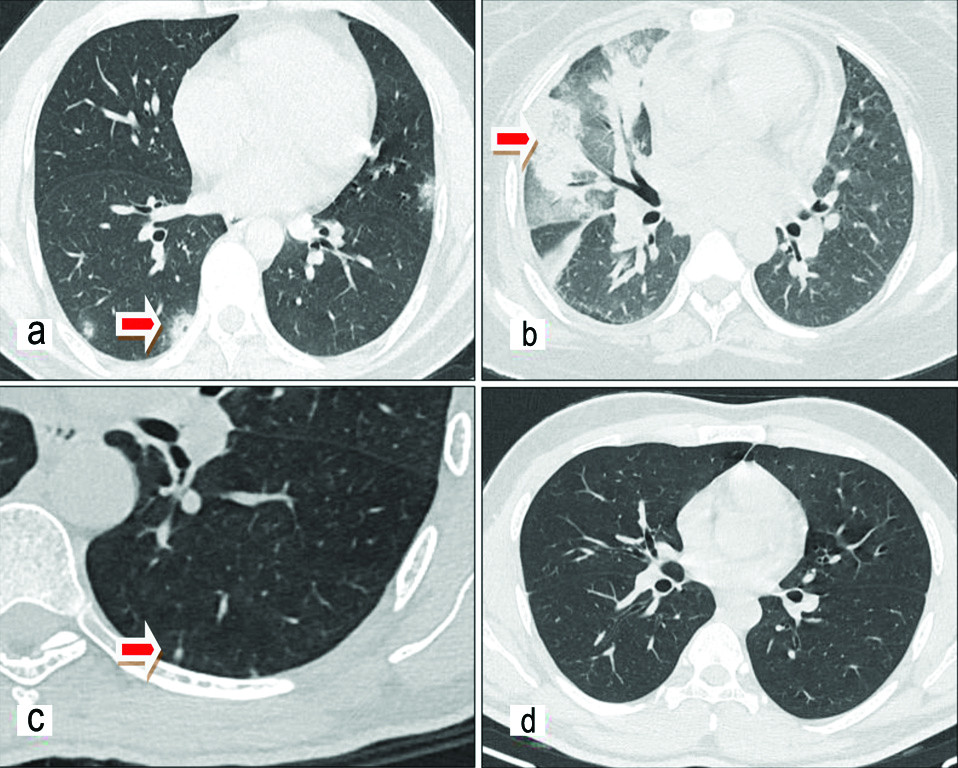
HRCT chest findings were classified into four patterns: Typical, Indeterminate, Atypical and Negative for COVID-19 pneumonia based on the Radiological Society of North America (RSNA) classification [9]. Typical pattern includes the commonly reported features of COVID-19 pneumonia such as bilateral, peripherally located GGOs with or without consolidation or crazy paving. Indeterminate pattern includes non-specific features like multifocal, diffuse, perihilar or unilateral GGOs with or without consolidation. Atypical pattern includes the findings that are rare or not seen in COVID-19 pneumonia, like lobar or segmental consolidation without GGOs or small nodules or cavitation or pleural effusion. Negative pattern indicates that there is no obvious parenchymal abnormality due to infection [Table/Fig-1].
CT patterns: a) Typical (Bilateral peripheral rounded GGOs); b) Indeterminate (Diffuse unilateral consolidation and GGO); c) Atypical (Subpleural nodular opacity); d) Negative (No obvious findings).
Semi-quantitative assessment for extent of lung parenchymal involvement in CT chest images was done using CTSS [10]. Each lobe of the lungs (total five lobes) was visually assessed and given a score between 0 to 5 on the basis of percentage of parenchymal involvement: 1 for <5% involvement, 2 for 5-25% involvement, 3 for 26-49% involvement, 4 for 50-75% involvement and 5 for >75% involvement. The CTSS is the sum of all lobar scores and can range from 0 (no involvement) to 25 (maximum involvement).
Changes in CT findings with duration of symptoms was assessed by classifying the study population into three phases (early, intermediate or late phase), based on the duration between day of onset of illness (day of onset of symptoms in symptomatic patients or day of becoming positive on RT-PCR in asymptomatic patients) and day of CT scan [11]. Patients were considered to be in the (I) Early phase of illness if the duration was <5 days; (II) Intermediate phase of illness for 6-10 days duration; and (III) Late phase if the scan was done >10 days after the date of onset of illness.
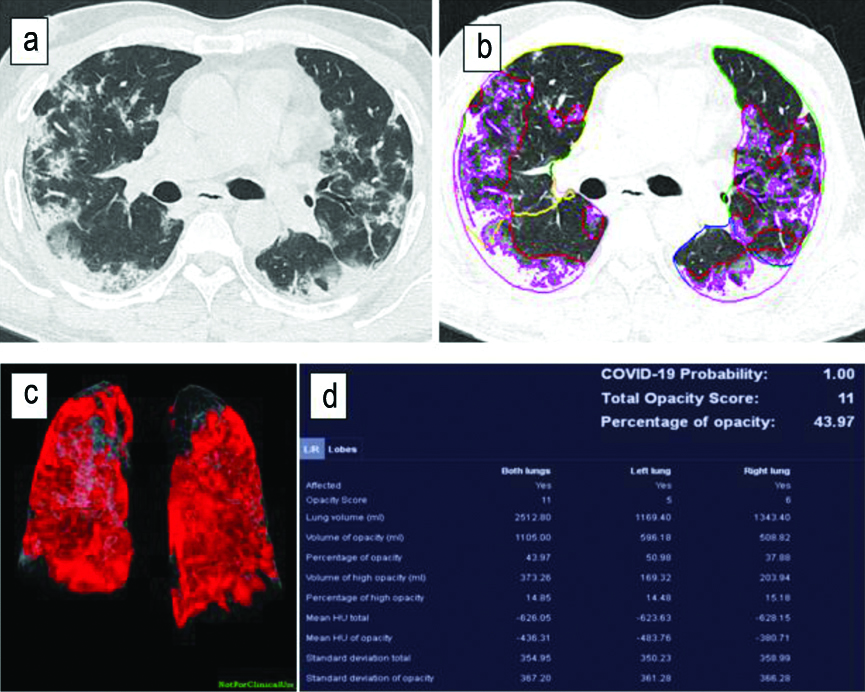
AI powered “CT Pneumonia analysis” algorithm developed for research purposes by Siemens Healthineers, is designed to automatically detect and quantify abnormal areas in lungs from HRCT chest [Table/Fig-2] [1]. Using the algorithm, the extent of involvement of lungs was quantified by calculating: (i) PO: Percentage of predicted volume of abnormalities compared to the total lung volume; and (ii) PHO: Percentage of predicted High opacity volume compared to the predicted volume of abnormalities.
Artificial intelligence (AI) analysis for research purpose): a) Axial CT section of chest showing bilateral lung lesions; b,c) Post processing of images by AI; d) Results.
Statistical Analysis
Statistical analysis was done using Statistical Package for the Social Sciences (SPSS) (version-21) software. Categorical variables were analysed using Chi-square test and the means of PO and PHO in different categories of clinical severity were analysed using ANOVA and Post-hoc test. The p-value <0.05 were considered to be statistically significant.
Results
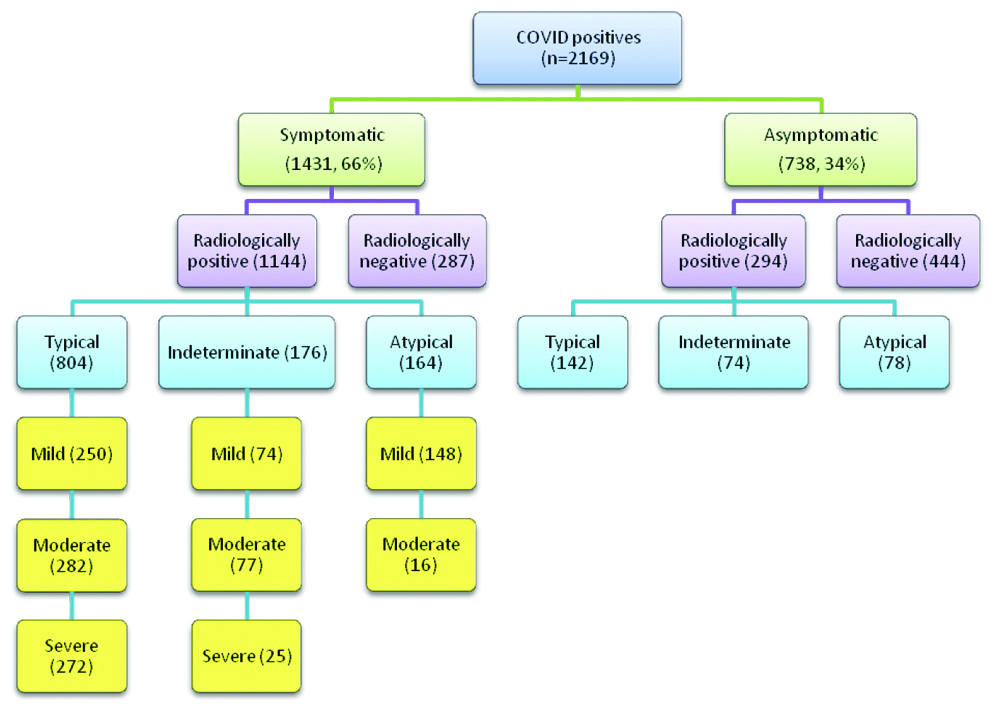
In present study, the age of patients ranged from 7 to 91 years with the mean age being 39.4±11.7 years. Males 1700 (78.4%) outnumbered the females 469 (21.6%) in present study. Out of 2169 COVID-19 patients, 1431 patients (66%) were symptomatic while 738 patients (34%) were asymptomatic.
A total of 804 (85%) patients having typical patterns in HRCT images were symptomatic, while 176 (70%) and 164 (67%) patients having indeterminate and atypical patterns respectively on HRCT were symptomatic. Out of total asymptomatic cases, 294 (39.8%) asymptomatic cases were found to be radiologically positive on HRCT chest imaging. Out of total 297 clinically severe cases, 272 (91.5%) of clinically severe cases had typical pattern [Table/Fig-3].
Distribution of study population according to clinical and radiological findings.
Proportion of Various Chest Lesions among Radiologically Positive (1438) Patients
A 55.8% patients had both Ground-Glass Opacities (GGO) and consolidation, 42.6% had only GGO and 1.6% had only consolidation as shown in [Table/Fig-4].
| CT features | Number of patients | % Among total patients (N=2169) | % Among radiologically positive patients (N=1438) |
|---|
| Parenchymal opacifications |
| Only GGO present | 612 | 28.2 | 42.6 |
| GGO and consolidation both present | 802 | 37 | 55.8 |
| Only consolidation | 24 | 1.1 | 1.6 |
| Associated findings |
| Sub pleural bands/Atelectasis/Fibrotic stripes | 604 | 27.8 | 42 |
| Septal thickening (Crazy paving and Reticular pattern) | 437 | 20.1 | 30.4 |
| Vascular widening | 519 | 23.9 | 36.1 |
| Pulmonary nodules | 309 | 14.2 | 21.4 |
| Thoracic lymphadenopathy | 122 | 5.62 | 8.48 |
| Pleural effusion | 47 | 2.1 | 3.2 |
| Cavitory lesion | 2 | 0.09 | 0.13 |
| Bronchiectasis | 27 | 1.24 | 1.8 |
| Pneumomediastinum | 2 | 0.091 | 0.13 |
| Pulmonary emphysema | 25 | 1.2 | 1.7 |
| Other findings | 10 | 0.46 | 0.69 |
| Opacity distribution |
| Central | 25 | 1.1 | 2 |
| Peripheral | 633 | 29.1 | 53 |
| Both | 538 | 24.8 | 45 |
| Number of lobes affected |
| 1 | 241 | 11.11 | 16.75 |
| ≥2 | 1197 | 88.89 | 83.25 |
| B/L lung disease | 958 | 44.16 | 66.6 |
| U/L | 238 | 16.5 | 10.97 |
| Frequency of lobe involvement |
| RUL | 660 | 30.4 | 45.9 |
| RML | 584 | 26.9 | 40.6 |
| RLL | 875 | 40.3 | 60.8 |
| LUL | 659 | 30.4 | 45.8 |
| LLL | 840 | 38.7 | 58.4 |
| AL | 636 | 29.3 | 44.2 |
GGO: Ground glass opacity; RUL: Right upper lobe; RML: Right middle lobe; RLL: Right lower lobe; LUL: Left upper lobe; LLL: Left lower lobe; AL: All lobes; U/L: Unilateral; B/L:Bilateral
Lobar Involvement and Distribution of Lung Opacities in Radiologically Positive Patients
[Table/Fig-4] also depicts 16.7% patients had only one lobe affection and rest of the patients had multilobar affection whereas bilateral lung involvement was seen in 66.6% patients.
CT Severity Score (CTSS): Average CTSS of the study was found to be 4.9. Among asymptomatic patients, 639 (86.6%) cases had CTSS of zero and 99 (13.4%) had scores more than zero [Table/Fig-5]. So, the Positive Predictive Values (PPV) of CTSS ≥15 for detecting clinically severe and symptomatic patients are 81.2% and 98.5%, respectively. The association between CTSS grading and clinical severity was found to be statistically significant (Chi-square value=2654, df=9, p<0.001).
CT Severity Score (CTSS) versus clinical severity in COVID-19 patients.
| Clinical severityCT Severity Score (CTSS) | Asymptomatic | Mild | Moderate | Severe |
|---|
| 0 | 639 | 320 | 11 | 3 |
| 1-7 | 78 | 375 | 87 | 34 |
| 8-14 | 17 | 24 | 272 | 49 |
| 15-25 | 4 | 17 | 28 | 211 |
| Total | 738 | 736 | 398 | 297 |
Chi-square value= 2654, df=9, p<0.001, Significant
Temporal Changes in CT Findings with duration of Symptoms
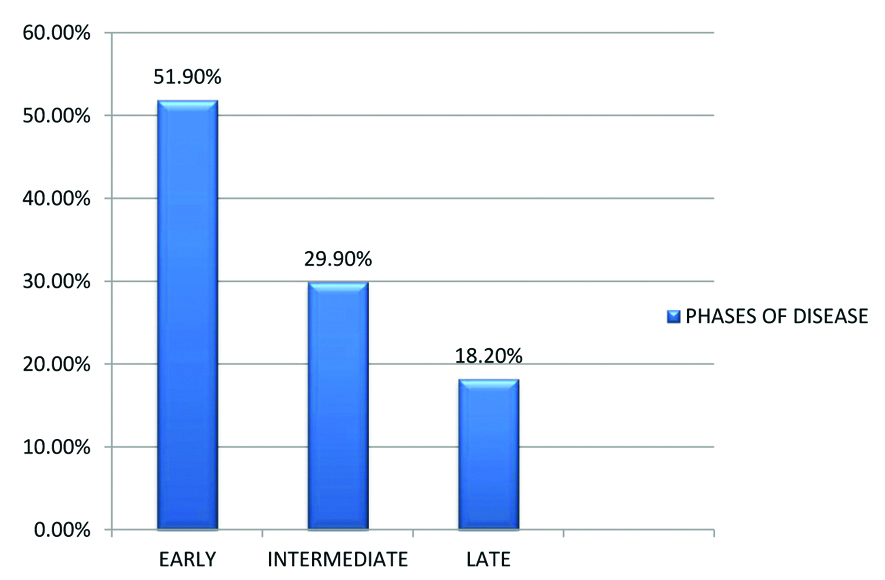
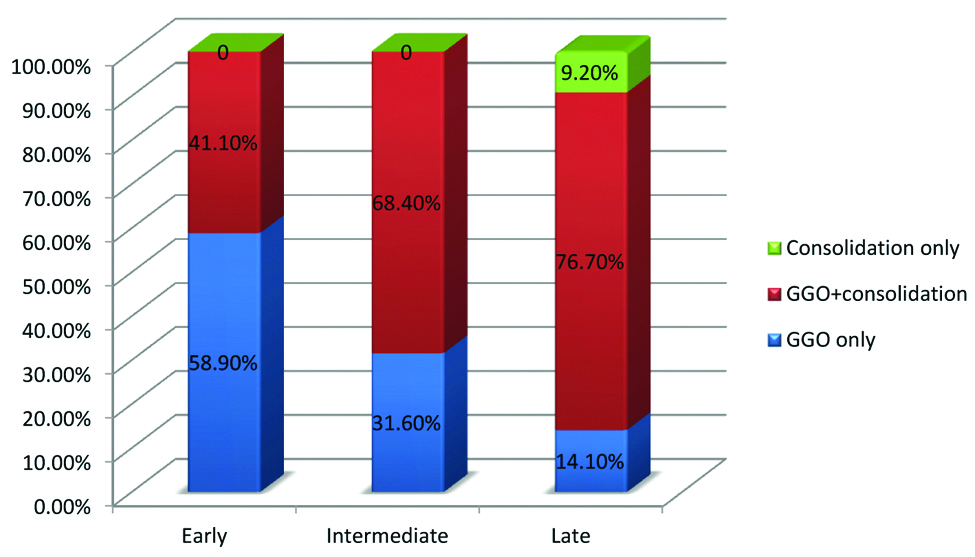
Among the radiologically positive cases, 746 (51.9%) patients were in early phase (≤7 days), 430 patients (29.9%) in intermediate phase (8-14 days), 262 patients (18.2%) in late phase (>14 days) of disease progression [Table/Fig-6]. In the early phase of disease, 58.9% patients had only GGO while the remaining 41.1% had both GGO and consolidation in HRCT chest. In intermediate phase 31.6% patients had only GGO while the remaining 68.4% had both GGO and consolidation in the HRCT chest. In the late phase of disease 14.1% patients had only GGO, 76.7% patients had both GGO and consolidation, while remaining 9.2% patients had only consolidation in imaging of HRCT chest [Table/Fig-7]. Bilateral lung involvement was seen in 39.8% of early phase patients, 81.9% of intermediate and 76.2% late phase patients. The percentage of patients in early, intermediate and late stages of disease having both peripherally and centrally distributed parenchymal lesions were 19%, 63% and 54%. The average numbers of lobes involved in early, intermediate and late phases were 2.3, 4.7 and 4.1, respectively. Average CTSS in early, intermediate and late phases among radiologically positive patients are 4.2, 14.3 and 13.1, respectively. Majority of cases with septal thickening (72.7%) were seen in patients of intermediate phase. Subpleural band like opacities were seen in all phases of disease but are predominant in intermediate phase (40.9% cases) and late phases (79%). Forty cases with pleural effusion were in the intermediate phase of disease and seven cases in late phase [Table/Fig-8]. Bronchiectatic changes were seen predominantly in patients of late phase (7.2% cases) [Table/Fig-9].
Patients in different phases of the disease.
Parenchymal opacification according to phases of disease.
Percentage of different CT features in various phases of disease.
| PhasesCT features/Findings(In % of Patients) | Early | Intermediate | Late |
|---|
| Bilateral lung involvement | 39.8 | 81.9 | 76.2 |
| Both peripherally and centrally distributed parenchymal lesions | 19 | 63 | 54 |
| Septal thickening | 9.1 | 72.7 | 57.4 |
| Subpleural band like opacities | 26.3 | 40.9 | 79 |
| Pleural effusion | 0 | 9.3 | 2.7 |
| Bronchiectasis | 0 | 1.8 | 7.2 |
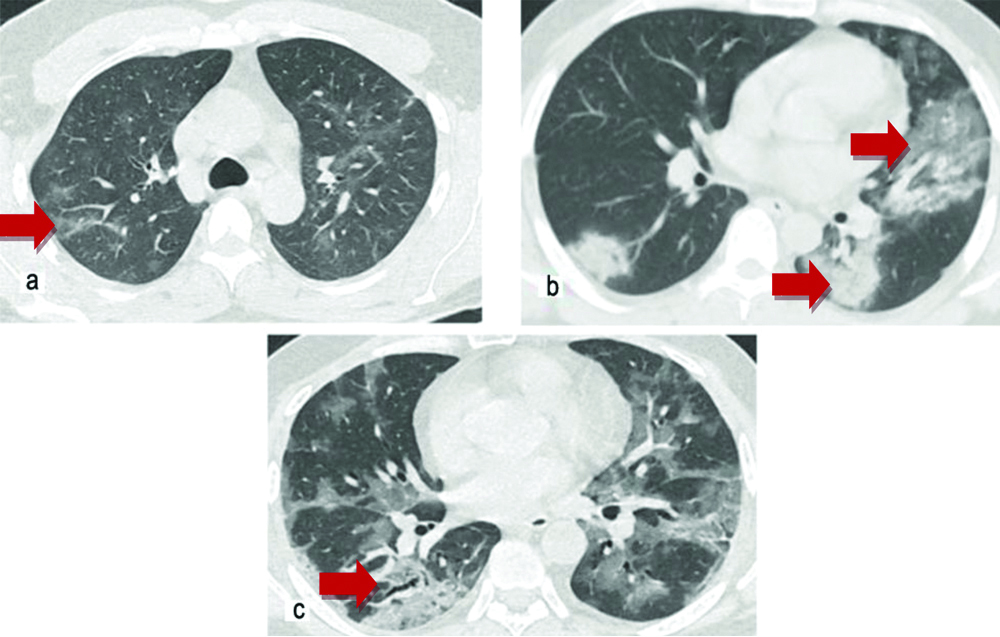
Phases of disease: a) Early phase (Multiple ill-defined GGOs); b) Intermediate phase (Both GGO and consolidation); c) Late phase (Both GGO and consolidation with fibrous stripes and bronchiectasis.
Artificial Intelligence (AI) analysis: PO and PHO in HRCT chest were obtained using “CT pneumonia analysis algorithm”. The algorithm was used randomly on 801 symptomatic patients, out of which 601, 125 and 75 were clinically mild, moderate and severe respectively. The mean PO and PHO are: 1.8±6.7 and 0.3±1.9 in mild category, 7±12.2 and 1.3±2.8 in moderate category and 30.1±28.0 and 8.4±10.4 in severe category respectively. On comparing the means of PO and PHO of different clinical categories by ANOVA test and post-hoc test, it was found that the difference of means within groups and between groups was statistically significant at 0.05 level (PO: F=199, p=0.000; PHO: F=147, p=0.001).
Change in Disease Pattern Over the Course of the Study
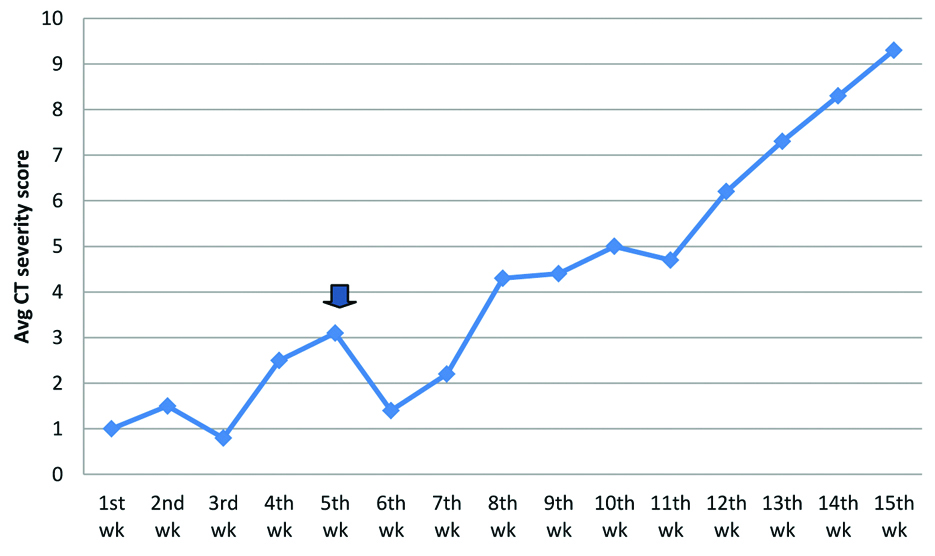
Weekly average CTSS in the first seven weeks of study were in the range of 0.8 to 3 and in the last weeks, those were ranging between 4.3 and 9.3 [Table/Fig-10]. The percentage of severe cases in the initial 7 weeks and last 8 weeks of study were 7.4% and 25.6%.
Time series analysis of weekly average CT Severity Scores (CTSS).
(Arrow denotes the immigration of migrant labourers into state)
Discussion
In the present study, HRCT chest findings in COVID-19 patients were analysed and correlated with symptomatology and severity of patients to explore possible roles of HRCT in diagnostic, therapeutic and prognosis of COVID-19 disease. A total of 2169 patients were studied in the study. More than one third (39.8%) of asymptomatic patients were found to be radiologically positive. This significant percentage of asymptomatic COVID-19 patients pose a real threat to society as they act as silent carriers for transmission of virus. The prominent radiological feature of COVID-19 in HRCT chest is bilateral GGO with or without consolidation. In this study, nearly two-third patients had positive CT findings with most patients (55.8%) showing a mixed pattern of GGO and consolidation. The distribution of the lesions in present study was mostly peripheral and lower lobar with multilobar and bilateral lung involvement seen in 66.6% patients. The predilection for these areas has also been reported previously [12]. Thin or thick subpleural band like opacities usually in the basal segments of lower lobes and some specific patterns like- interstitial/septal thickening (crazy paving/reticular pattern), reverse halo sign and halo sign were seen in a significant proportion of patients. These findings corroborate with the findings of the study done by Ye Z et al., [13]. Another important observation is that HRCT chest findings were seen in some asymptomatic patients, especially young patients, may be due to the differences in disease tolerability in different age groups. Diffuse lesions involving both peripheral and central parts of lungs, causing “white lungs,” appearance were seen in the most severely affected patients. About 91.3% of cases having score ≤7 were asymptomatic or mild. On the other hand, 75.1% cases having CTSS 8-14 were clinically moderate and 81.2% cases having score ≥15 were clinically severe, as shown in [Table/Fig-5]. The CTSS showed good correlation with clinical status of patients, as seen in previous studies [14].
HRCT chest scans of patients in the early phase (0-7 days) of disease show mostly GGO and in late stage (>14 days) consolidation tends to be predominant. In the early stages, single or multiple small GGO, consolidation and mild interstitial thickening could be seen. In the intermediate phase (8-14 days) of disease, the number of involved lobes was more with increase in consolidation and septal thickening in the involved lobes which correlated with increased disease severity. Another observation in present study was, even if the total percentage area of lung involved remained nearly the same, appearance of features such as increased reticulation, predominance of consolidation, presence of fibrous stripes, development of bronchiectatic changes indicated late stage and even corroborated with clinical features of improvement. A long-term follow-up of these patients is needed to assess if these findings completely resolve or some evidence of fibrotic changes persists. The data of present study indicates that CT findings vary according to the time of scan from the onset of illness. This reiterates the results observed by Bernheim A et al., who suggested progression of disease in the form of GGOs in early stage to crazy paving/reticulation and consolidation in later stages [15]. CT chest imaging also showed some non-specific findings which include pleural effusion, pulmonary nodules and thoracic lymphadenopathy. Majority of cases with pleural effusion were in the intermediate phase of disease.
Special features of COVID-19: Sub-pleural band like opacities were seen in all phases of disease, but were predominant in intermediate phase and late phases. It is not clear what they represent, perhaps they are a combination of multiple things i.e., partly resolving pneumonia with an element of subsegmental atelectasis and with an element of fibrosis in some patients. Vascular widening/prominence of proximal or intra-lesional vessels were seen in many patients which may be a simplest sign of vasculopathy. Spontaneous pneumomediastinum was seen in a few cases, for which cause was unclear.
Analysis of CT images using AI showed that the values of PO and PHO were remarkably higher in clinically severe category. AI can also be helpful in comparison of lung parenchymal involvement in different phases of disease.
The weekly average CTSS along with the study period, shows gradually raising trend with abrupt increase seen 7th week onwards i.e., last week of June, as shown in [Table/Fig-9]. The reason for this abrupt increase is thought to be due to immigration of large number of migrant labourers into the state, immediately after the ending lockdown phase in 1st week of June. In addition to that the infectivity and virulence of the virus strain brought by the migrant labourers into the state may be higher.
Limitation(s)
Study was being conducted in a single centre which covered patients from a defined geographical area. Confounding factors like co-morbidities and immune status of the patients were also not taken into consideration in this study. So, this study needs further exploration by taking into account multiple centres and patients from different geographical areas.
Conclusion(s)
Imaging changes in COVID-19 pneumonia are rapid, so radiologists and clinicians need to be familiarised with the typical HRCT chest findings. Present study showed a good correlation between HRCT chest imaging findings and clinical severity. AI can be a powerful tool in recognising lesions in HRCT images, quantitatively characterising findings and comparing changes between follow-up scans, which is crucial for precision medicine. However, the accuracy and reliability of AI is to be properly validated before using for diagnostic purposes in COVID-19 cases.