Direct laryngoscopy and endotracheal intubation is almost always associated with haemodynamic changes. Mechanism of cardiovascular response to intubation is considered to be a sympathetic reflex response to the mechanical stimulation of larynx and trachea. Direct laryngoscopy and intubation may result in increased SBP, DBP, mean Blood Pressure (BP), Heart Rate (HR), arrhythmias etc. Both parasympathetic and sympathetic nervous system mediate cardiovascular responses to laryngoscopy and endotracheal intubation. This pressor response is usually transitory, variable and unpredictable and have no consequence in healthy individuals but either or both may be hazardous to patients with myocardial insufficiency hypertension, penetrating eye injuries, cerebrovascular diseases or intracranial lesion and may result in development of myocardial insufficiency, pulmonary oedema and cerebrovascular accident [1]. Prevention of these pressor responses remains an important clinical goal particularly for the patients with cardiac disease [2] as tachycardia and hypertension cause an imbalance in myocardial oxygen demand and supply, predisposing it to ischemia, infarction and heart failure.
Attenuation of haemodynamic responses to laryngoscopy and intubation have been practiced either by deepening the plane of anaesthesia, topical anaesthesia of the upper respiratory tract prior to laryngoscopy with lignocaine, by the use of drugs known to blunt them or by using new airway devices [3].
The technique or drug of choice depends upon the necessity and duration of the operation, choice of anesthetic technique, route of administration, and medical condition of the patient.
Many studies have reviewed the effect of lignocaine in different forms like aerosol [4], sprays [5] viscous lignocaine [6], and intravenous [7] route to blunt these responses. Intravenous lignocaine has been used to suppress laryngospasm and cough during tracheal intubation and extubation [8]. In a study using inhaled and intravenous lignocaine, in both the routes it attenuated reflex bronchoconstriction but the plasma concentration of lignocaine was significantly lower in the group where lignocaine was used via inhalational route [9].
Intravenous lignocaine has an anti-arrhythmic effect is a suitable alternate method to minimise this haemodynamic response [10]. The present study was undertaken to compare the effect of nebulised versus intravenous lignocaine to suppress the haemodyamic response to laryngoscopy and tracheal intubation.
Materials and Methods
This randomised control study was undertaken in the Department of Anaesthesiology, during January 2018 to June 2019. Ethical Clearance was obtained for the study (Ref No.751/UPUMS/DEAN/2019-20/E.C./2019-20).
Inclusion criteria: There were 90 ASA grade 1 and 2 patients in the age group of 18 to 45 years of either sex, undergoing elective surgeries under general anaesthesia.
Exclusion criteria: Patients with chronic obstructive pulmonary disease, cerebrovascular disease, cardiovascular diseases, psychiatric illness and liver disorders, patients having known allergy either to lignocaine or its preservatives, patients coming for emergency surgical procedures, patients with anticipated difficult airway, patients having history of laryngeal, tracheal surgery or any pathology were excluded from study.
Sample Size Calculation
In the present study, there were three groups and the following formula was used to calculate sample size:
n={z(1-α/2)}2×SD2/d2
where,
z(1-α/2)=standard normal deviate for 95% confidence=1.96
SD=Standard deviation of Mean Arterial Pressure=14 mmHg
d=precision=5%
n=1.962×142/52
n=30
The sample size obtained was 30 patients in each group.
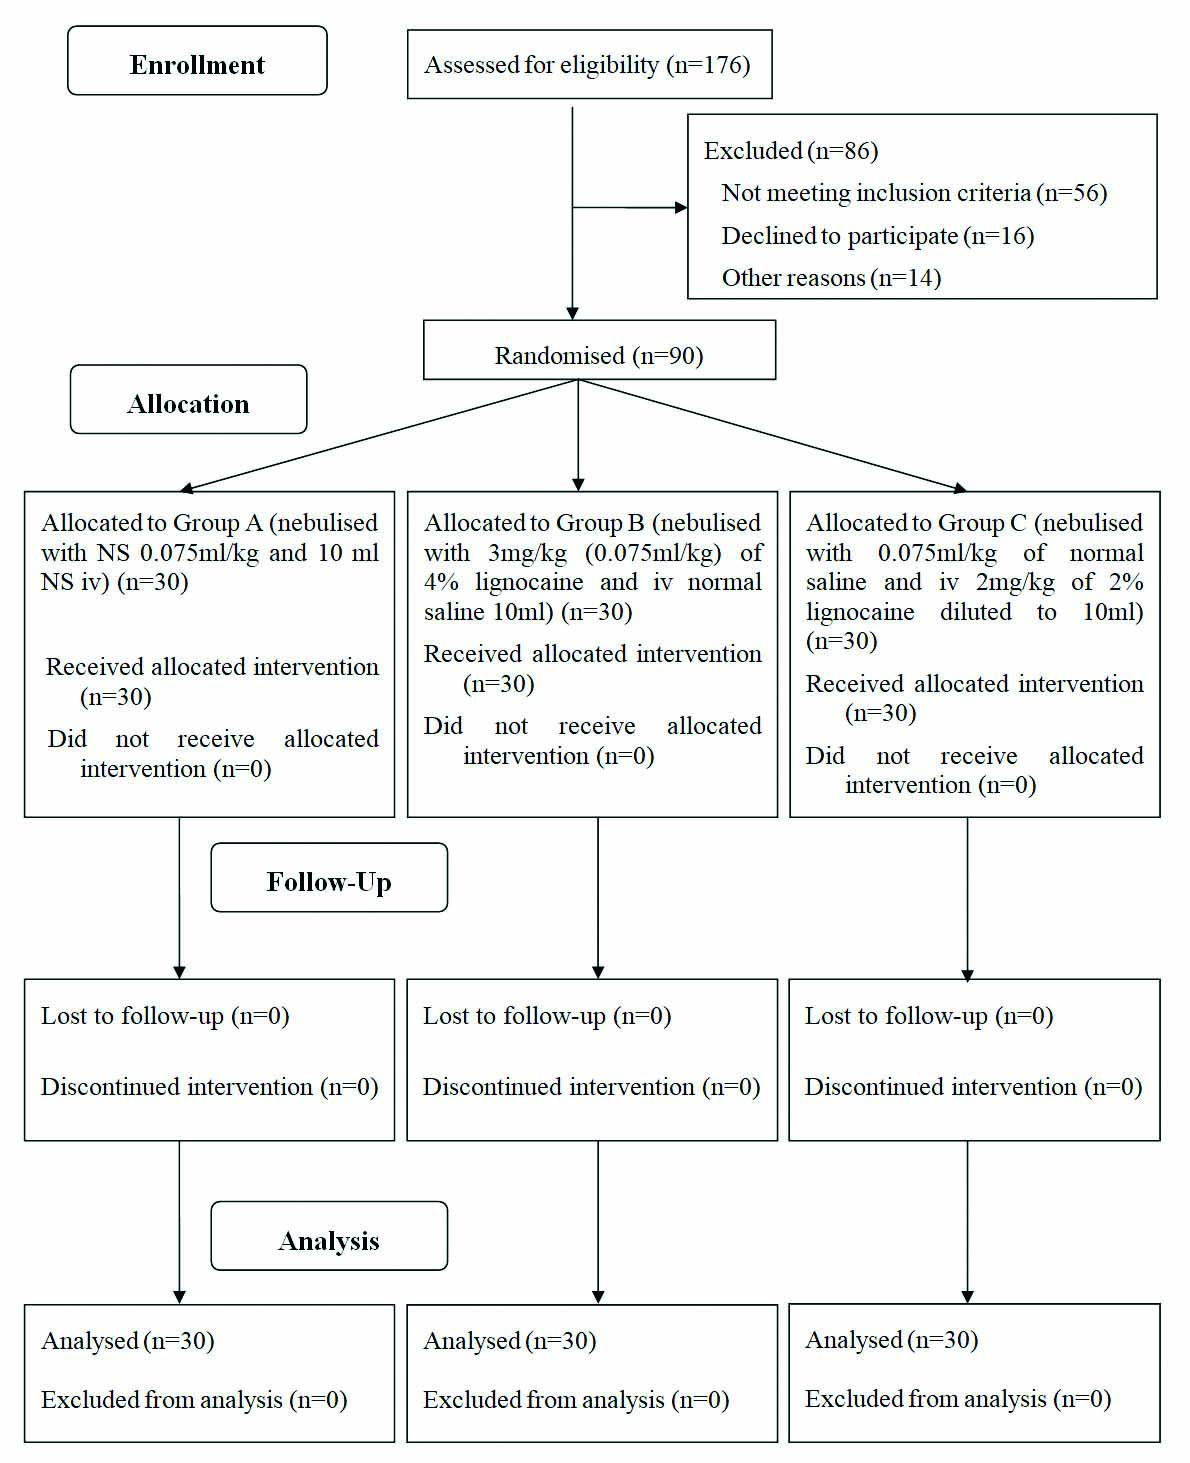
The patients were randomly allocated to three groups using sequentially numbered cards in sealed opaque envelopes to one of three groups. Group A was nebulised with NS 0.075 mL/kg and 10 mL NS iv given. Group B was nebulised with 3 mg/kg (0.075 mL/kg) of 4% lignocaine and iv normal saline 10 mL given. Group C was nebulised with 0.075 mL/kg of normal saline and iv 2 mg/kg of 2% lignocaine diluted to 10 mL. There were no dropouts from the study [Table/Fig-1].
A detailed pre-anaesthetic evaluation including history of previous illness, previous surgeries, general physical examination, and detailed examination of cardiovascular system, Respiratory system and other relevant systems were done. The routine investigations were done in all patients. The following haemodynamic parameters were recorded in all the patients: SBP, DBP, MAP, HR, Oxygen saturation and EtCO2 were noted as baseline before starting nebulisation (at T0) and then at every 5 minutes during nebulisaion (as TN5, TN10, TN15 respectively), before laryngoscopy (TpreI), immediately after intubation (TpostI), 1 minute after intubation and every minute after intubation for 20 minutes.
Statistical Analysis
Descriptive statistical analysis was carried out. Results on continuous measurements was presented as Mean±SD (Min-Max) and results on categorical measurements was presented in number (%). Significance was assessed at 5% level of significance. Analysis of variance (ANOVA) has been used to find the significance of study parameters between three groups of patients followed by Turkey’s post-hoc test to compare continuous variables among the groups. Chi-square test was used to find the significance of study parameters on categorical scale between three groups. The p-value <0.05 was considered significant. All the analysis was carried out on SPSS 16.0 version.
Results
There was no significant difference in age, gender and BMI among the groups [Table/Fig-2].
| Characteristics | Group A | Group B | Group C | p-value |
|---|
| Age in years (Mean±SD) | 33.00±7.31 | 31.27±6.87 | 31.70±8.82 | 0.66 |
| Gender | Male (%) | 7 (23.3%) | 3 (10) | 4 (13.3) | 0.33 |
| Female (%) | 23 (76.7) | 27 (90) | 26 (86.7) |
| BMI in kg/m2 (Mean±SD) | 19.80±1.43 | 19.64±1.50 | 20.55±1.53 | 0.06 |
N=30 in each group
There was no significant (p>0.05) difference in SBP among the groups at T0 to TpreI, The analysis of variance revealed that SBP was significantly different at TpostI (p=0.02), 1 to 3 minutes (p<0.05), 5 minutes (p=0.03) and 12 minutes (p=0.02). The post-hoc testes showed that SBP was significantly (p<0.05) different between Group A and Group B at 1 to 3 minutes. Statistical evaluation between the groups showed that the increase in SBP observed at 1 minute after intubation in control group was statistically highly significant when compared to increase in SBP in group B and C and remained significant even up to 3 minute post-intubation. Between group B and group C was no statistical significance [Table/Fig-3].
Comparison of SBP among the groups across the time periods.
| Time periods | Group A (n=30) | Group B (n=30) | Group C (n=30) | p-value1 | p-value2 |
|---|
| Mean (mmHg) | SD (mmHg) | Mean | SD | Mean | SD | A vs B | A vs C | B vs C |
|---|
| T0 | 127.23 | 9.83 | 122.87 | 8.31 | 124.00 | 7.80 | 0.13 | 0.13 | 0.32 | 0.86 |
| TN5 | 123.53 | 23.08 | 122.40 | 7.45 | 123.27 | 7.25 | 0.95 | 0.95 | 0.99 | 0.97 |
| TN10 | 128.27 | 11.22 | 121.93 | 7.72 | 122.92 | 8.06 | 0.06 | 0.05 | 0.06 | 0.89 |
| TN15 | 125.40 | 8.83 | 121.83 | 8.23 | 123.50 | 6.79 | 0.23 | 0.20 | 0.62 | 0.70 |
| TpreI | 97.23 | 6.43 | 103.13 | 6.71 | 94.37 | 13.38 | 0.12 | 0.10 | 0.23 | 0.07 |
| TpostI | 147.87 | 18.18 | 137.97 | 27.83 | 132.43 | 16.61 | 0.02* | 0.18 | 0.01* | 0.58 |
| 1 min | 142.60 | 18.10 | 128.10 | 18.33 | 124.13 | 17.95 | 0.001* | 0.007* | 0.001* | 0.67 |
| 2 min | 133.50 | 18.36 | 120.53 | 14.33 | 119.87 | 17.91 | 0.003* | 0.01* | 0.007* | 0.98 |
| 3 min | 129.90 | 15.68 | 118.87 | 14.70 | 120.70 | 16.60 | 0.01* | 0.02* | 0.06* | 0.89 |
| 4 min | 126.70 | 17.13 | 117.87 | 12.72 | 120.10 | 16.55 | 0.08 | 0.07 | 0.23 | 0.84 |
| 5 min | 125.77 | 15.60 | 116.43 | 11.60 | 123.57 | 15.46 | 0.03* | 0.03* | 0.82 | 0.13 |
| 6 min | 127.00 | 14.54 | 118.47 | 12.53 | 124.87 | 14.56 | 0.05 | 0.05 | 0.52 | 0.18 |
| 7 min | 127.27 | 14.30 | 119.43 | 14.80 | 125.73 | 13.91 | 0.08 | 0.09 | 0.91 | 0.21 |
| 8 min | 126.93 | 13.31 | 120.50 | 14.46 | 126.70 | 15.55 | 0.15 | 0.20 | 0.99 | 0.22 |
| 9 min | 126.47 | 13.05 | 120.20 | 15.16 | 128.13 | 16.46 | 0.10 | 0.24 | 0.90 | 0.10 |
| 10 min | 125.93 | 12.65 | 119.43 | 15.72 | 121.90 | 24.91 | 0.39 | 0.36 | 0.67 | 0.89 |
| 11 min | 125.37 | 12.12 | 118.67 | 15.00 | 126.60 | 17.09 | 0.09 | 0.19 | 0.94 | 0.10 |
| 12 min | 124.83 | 12.12 | 117.97 | 12.85 | 127.40 | 15.89 | 0.02* | 0.13 | 0.75 | 0.02* |
| 13 min | 125.87 | 13.37 | 119.57 | 11.54 | 125.70 | 13.31 | 0.09 | 0.14 | 0.99 | 0.15 |
| 14 min | 124.77 | 12.31 | 119.67 | 10.80 | 126.43 | 13.71 | 0.09 | 0.25 | 0.86 | 0.09 |
| 15 min | 124.73 | 11.90 | 120.03 | 9.41 | 126.17 | 12.89 | 0.10 | 0.25 | 0.87 | 0.10 |
| 16 min | 125.50 | 15.04 | 119.63 | 9.70 | 124.27 | 13.39 | 0.18 | 0.18 | 0.92 | 0.35 |
| 17 min | 125.67 | 14.49 | 120.37 | 10.12 | 124.70 | 14.10 | 0.25 | 0.26 | 0.95 | 0.40 |
| 18 min | 125.53 | 13.90 | 120.37 | 10.29 | 124.40 | 13.40 | 0.25 | 0.25 | 0.93 | 0.43 |
| 19 min | 124.17 | 14.74 | 118.87 | 8.69 | 125.40 | 13.36 | 0.10 | 0.23 | 0.92 | 0.11 |
| 20 min | 123.77 | 13.60 | 118.90 | 9.00 | 124.37 | 11.68 | 0.14 | 0.24 | 0.97 | 0.11 |
1ANOVA test, 2Post-hoc tests, *Significant; SBP: Systolic blood presure
The analysis of variance revealed that there was no significant (p>0.05) difference in DBP among the groups at T0 to TpreI. DBP was significantly (p<0.05) different at TpostI to 5 minutes and 12 minutes. The post-hoc testes showed that DBP was significantly (p<0.05) different between Group A and Group B at time 1 to 5 minutes. Statistical evaluation between the groups showed that the increase in DBP observed at 1 minute in control group was statistically highly significant when compared to increase in DBP in group B and group C. Between group B and group C there was no statistical significant increase in DBP [Table/Fig-4].
Comparison of DBP among the groups across the time periods.
| Time periods | Group A (n=30) | Group B (n=30) | Group C (n=30) | p-value1 | p-value2 |
|---|
| Mean | SD | Mean | SD | Mean | SD | A vs B | A vs C | B vs C |
|---|
| T0 | 84.47 | 9.30 | 80.23 | 8.75 | 80.13 | 8.60 | 0.05 | 0.06 | 0.01 | 0.99 |
| TN5 | 85.53 | 8.89 | 83.60 | 9.51 | 78.33 | 8.87 | 0.11 | 0.28 | 0.12 | 0.35 |
| TN10 | 84.50 | 17.00 | 81.10 | 9.06 | 78.50 | 9.42 | 0.17 | 0.53 | 0.15 | 0.69 |
| TN15 | 84.33 | 8.85 | 80.70 | 8.54 | 79.83 | 8.26 | 0.10 | 0.23 | 0.10 | 0.91 |
| TpreI | 66.87 | 7.52 | 69.23 | 6.93 | 55.37 | 9.47 | 0.12 | 0.78 | 0.11 | 0.17 |
| TpostI | 102.67 | 20.87 | 93.67 | 18.40 | 87.03 | 15.97 | 0.006* | 0.15 | 0.004* | 0.35 |
| 1 min | 100.90 | 12.98 | 86.50 | 13.86 | 82.63 | 15.00 | 0.001* | 0.001* | 0.001* | 0.53 |
| 2 min | 92.60 | 13.98 | 80.57 | 10.29 | 78.40 | 14.18 | 0.001* | 0.002* | 0.001* | 0.79 |
| 3 min | 89.60 | 13.85 | 81.60 | 10.52 | 77.37 | 12.51 | 0.001* | 0.03* | 0.001* | 0.38 |
| 4 min | 87.60 | 14.49 | 79.23 | 9.05 | 77.90 | 11.78 | 0.004* | 0.02* | 0.007* | 0.90 |
| 5 min | 86.67 | 13.57 | 77.77 | 9.50 | 82.07 | 12.67 | 0.02* | 0.01* | 0.30 | 0.35 |
| 6 min | 87.37 | 12.97 | 80.63 | 11.14 | 82.23 | 14.46 | 0.11 | 0.11 | 0.27 | 0.88 |
| 7 min | 87.13 | 12.89 | 80.77 | 11.60 | 82.40 | 11.92 | 0.11 | 0.11 | 0.29 | 0.86 |
| 8 min | 88.37 | 11.42 | 81.23 | 12.48 | 83.37 | 15.52 | 0.10 | 0.09 | 0.31 | 0.80 |
| 9 min | 85.70 | 12.73 | 80.77 | 11.18 | 83.03 | 14.84 | 0.34 | 0.31 | 0.70 | 0.77 |
| 10 min | 86.57 | 12.02 | 79.60 | 11.71 | 84.40 | 27.66 | 0.34 | 0.32 | 0.89 | 0.58 |
| 11 min | 81.97 | 17.66 | 77.37 | 10.59 | 78.10 | 15.77 | 0.44 | 0.46 | 0.57 | 0.98 |
| 12 min | 84.13 | 10.36 | 77.47 | 8.63 | 76.23 | 13.10 | 0.01* | 0.05 | 0.01* | 0.89 |
| 13 min | 83.90 | 12.64 | 77.90 | 8.50 | 78.40 | 13.80 | 0.10 | 0.12 | 0.17 | 0.98 |
| 14 min | 79.33 | 17.25 | 77.83 | 7.78 | 78.93 | 14.27 | 0.90 | 0.90 | 0.99 | 0.94 |
| 15 min | 82.87 | 12.27 | 78.73 | 8.40 | 78.27 | 15.39 | 0.28 | 0.40 | 0.32 | 0.98 |
| 16 min | 84.23 | 13.29 | 78.50 | 8.59 | 77.13 | 14.92 | 0.07 | 0.16 | 0.07 | 0.90 |
| 17 min | 84.00 | 12.36 | 78.53 | 8.51 | 77.13 | 16.41 | 0.09 | 0.23 | 0.10 | 0.90 |
| 18 min | 83.47 | 12.70 | 78.43 | 8.92 | 76.77 | 15.03 | 0.10 | 0.26 | 0.10 | 0.86 |
| 19 min | 82.37 | 11.72 | 79.30 | 8.05 | 76.70 | 14.67 | 0.18 | 0.57 | 0.15 | 0.67 |
| 20 min | 82.87 | 11.75 | 79.27 | 8.32 | 77.60 | 14.87 | 0.22 | 0.47 | 0.20 | 0.85 |
1ANOVA test, 2Post-hoc tests, *Significant; DBP: Diastolic blood pressure
There was no significant (p>0.05) difference in MAP among the groups at T0 to TpreI. MAP was significantly (p<0.05) different at TpostI to 5 minutes. The post-hoc testes showed that MAP was significantly (p<0.05) different statistical evaluation between the groups showed that the increase in MAP observed post-intubation in control group was statistically highly significant when compared to increase in MAP in group B and C and remained significant even up to 4 minute post-intubation. Between group B and group C was no statistical significance [Table/Fig-5].
Comparison of MAP among the groups across the time periods.
| Time periods | Group A (n=30) | Group B (n=30) | Group C (n=30) | p-value1 | p-value2 |
|---|
| Mean | SD | Mean | SD | Mean | SD | A vs B | A vs C | B vs C |
|---|
| T0 | 99.20 | 6.86 | 92.30 | 6.87 | 90.73 | 8.88 | 0.05 | 0.03 | 0.06 | 0.97 |
| TN5 | 98.12 | 7.19 | 91.63 | 6.26 | 90.87 | 9.12 | 0.11 | 0.20 | 0.02 | 0.63 |
| TN10 | 97.70 | 7.43 | 95.80 | 6.74 | 94.00 | 9.69 | 0.15 | 0.14 | 0.06 | 0.35 |
| TN15 | 98.97 | 7.78 | 93.17 | 7.78 | 93.17 | 8.86 | 0.07 | 0.37 | 0.05 | 0.65 |
| TpreI | 74.17 | 7.21 | 77.43 | 6.57 | 67.67 | 9.89 | 0.12 | 0.10 | 0.11 | 0.05 |
| TpostI | 118.17 | 12.75 | 105.73 | 18.26 | 100.57 | 16.05 | 0.001* | 0.009* | 0.001* | 0.42 |
| 1 min | 112.40 | 13.45 | 99.03 | 14.36 | 94.17 | 16.65 | 0.001* | 0.002* | 0.001* | 0.41 |
| 2 min | 104.47 | 14.41 | 93.33 | 11.94 | 90.23 | 16.13 | 0.001* | 0.009* | 0.001* | 0.67 |
| 3 min | 101.17 | 14.02 | 93.03 | 11.55 | 90.87 | 13.28 | 0.007* | 0.04* | 0.008* | 0.79 |
| 4 min | 99.10 | 14.75 | 91.10 | 9.96 | 91.93 | 14.09 | 0.02* | 0.04* | 0.04* | 1.00 |
| 5 min | 98.60 | 13.86 | 90.50 | 9.85 | 91.33 | 13.55 | 0.04* | 0.05 | 0.57 | 0.30 |
| 6 min | 98.83 | 12.89 | 92.53 | 11.22 | 95.50 | 14.04 | 0.16 | 0.14 | 0.57 | 0.64 |
| 7 min | 99.03 | 13.43 | 93.20 | 11.87 | 95.73 | 13.13 | 0.21 | 0.18 | 0.58 | 0.72 |
| 8 min | 99.87 | 12.50 | 93.03 | 12.73 | 96.50 | 14.85 | 0.14 | 0.12 | 0.59 | 0.57 |
| 9 min | 98.30 | 11.84 | 92.63 | 13.02 | 97.23 | 14.50 | 0.21 | 0.22 | 0.94 | 0.37 |
| 10 min | 98.07 | 11.46 | 92.20 | 13.16 | 95.70 | 13.97 | 0.21 | 0.18 | 0.75 | 0.54 |
| 11 min | 97.10 | 10.34 | 91.17 | 11.54 | 94.60 | 15.86 | 0.29 | 0.17 | 0.73 | 0.55 |
| 12 min | 96.20 | 9.58 | 90.73 | 9.98 | 93.10 | 11.75 | 0.13 | 0.11 | 0.48 | 0.65 |
| 13 min | 96.87 | 11.09 | 91.90 | 8.90 | 94.60 | 11.76 | 0.20 | 0.17 | 0.68 | 0.59 |
| 14 min | 95.63 | 9.81 | 92.40 | 8.20 | 91.73 | 19.17 | 0.48 | 0.61 | 0.49 | 0.97 |
| 15 min | 96.77 | 10.52 | 93.07 | 7.39 | 94.20 | 11.83 | 0.35 | 0.33 | 0.58 | 0.90 |
| 16 min | 97.13 | 12.26 | 92.90 | 7.31 | 93.17 | 12.14 | 0.24 | 0.28 | 0.33 | 0.99 |
| 17 min | 97.47 | 11.61 | 92.63 | 7.12 | 93.60 | 13.28 | 0.20 | 0.20 | 0.36 | 0.93 |
| 18 min | 96.83 | 10.91 | 93.23 | 7.93 | 92.07 | 12.47 | 0.19 | 0.39 | 0.19 | 0.90 |
| 19 min | 95.37 | 11.36 | 92.17 | 7.41 | 93.13 | 11.81 | 0.47 | 0.46 | 0.68 | 0.93 |
| 20 min | 96.03 | 11.13 | 91.90 | 7.25 | 93.40 | 11.86 | 0.29 | 0.27 | 0.58 | 0.83 |
1ANOVA test, 2Post-hoc tests, *Significant; MAP: Mean arterial pressure
The analysis of variance revealed that HR was significantly (p<0.05) different at 5 minutes and 7 to 15 minutes. The post-hoc testes showed that HR was significantly (p<0.05) different between Group A and Group C at 7 to 15 minutes. When mean change in HR at post-intubation in group B and group C were compared with control (group A) group independently, there was no clinical or statistical significance. (group A v/s group B p=0.07, group A v/s group C p=0.95). Statistical evaluation between the groups showed that the increase in HR observed from 7 minutes to 15 minutes post-intubation in control group was statistically significant when compared to increase in HR in group B and group C. For similar duration there was statistically significant increase in HR in group A as compared to group C [Table/Fig-6].
Comparison of HR among the groups across the time periods.
| Time periods | Group A (n=30) | Group B (n=30) | Group C (n=30) | p-value1 | p-value2 |
|---|
| Mean | SD | Mean | SD | Mean | SD | A vs B | A vs C | B vs C |
|---|
| T0 | 89.20 | 10.49 | 90.00 | 11.30 | 88.23 | 11.87 | 0.83 | 0.95 | 0.94 | 0.81 |
| TN5 | 88.67 | 9.54 | 88.60 | 10.28 | 88.37 | 10.58 | 0.99 | 0.99 | 0.99 | 0.99 |
| TN10 | 87.83 | 9.57 | 88.37 | 9.19 | 88.57 | 9.76 | 0.95 | 0.97 | 0.95 | 0.99 |
| TN15 | 87.90 | 8.90 | 88.20 | 9.96 | 88.00 | 9.61 | 0.99 | 0.99 | 0.99 | 0.99 |
| TpreI | 83.07 | 9.26 | 85.17 | 8.36 | 89.33 | 15.90 | 0.11 | 0.76 | 0.10 | 0.35 |
| TpostI | 103.20 | 9.63 | 96.87 | 11.89 | 102.37 | 11.63 | 0.06 | 0.07 | 0.95 | 0.13 |
| 1 min | 102.93 | 8.93 | 96.70 | 12.98 | 101.67 | 12.85 | 0.07 | 0.10 | 0.99 | 0.12 |
| 2 min | 101.90 | 8.75 | 94.83 | 12.84 | 98.90 | 13.34 | 0.07 | 0.05 | 0.59 | 0.38 |
| 3 min | 99.40 | 8.10 | 93.57 | 11.11 | 98.43 | 11.76 | 0.07 | 0.08 | 0.93 | 0.17 |
| 4 min | 96.83 | 7.66 | 92.43 | 10.65 | 99.10 | 12.92 | 0.05 | 0.25 | 0.68 | 0.05 |
| 5 min | 94.93 | 7.48 | 90.83 | 12.26 | 98.83 | 14.17 | 0.02* | 0.28 | 0.40 | 0.01* |
| 6 min | 93.20 | 6.78 | 91.90 | 11.73 | 98.00 | 14.21 | 0.09 | 0.89 | 0.23 | 0.09 |
| 7 min | 91.93 | 6.93 | 91.93 | 11.55 | 98.67 | 13.32 | 0.02* | 1.00 | 0.04* | 0.04* |
| 8 min | 91.80 | 7.57 | 91.37 | 10.87 | 99.43 | 14.71 | 0.01* | 0.98 | 0.03* | 0.02* |
| 9 min | 88.13 | 16.34 | 90.83 | 11.63 | 98.97 | 14.37 | 0.01* | 0.74 | 0.01* | 0.07* |
| 10 min | 90.70 | 8.55 | 90.33 | 11.75 | 98.67 | 13.29 | 0.01* | 0.99 | 0.02* | 0.02* |
| 11 min | 89.83 | 9.09 | 90.60 | 11.61 | 97.17 | 12.32 | 0.02* | 0.96 | 0.03* | 0.06 |
| 12 min | 90.17 | 8.66 | 90.87 | 11.16 | 97.37 | 12.44 | 0.02* | 0.96 | 0.03* | 0.05 |
| 13 min | 89.80 | 9.88 | 91.60 | 10.87 | 98.27 | 13.16 | 0.01* | 0.81 | 0.01* | 0.06 |
| 14 min | 89.70 | 9.59 | 91.70 | 10.97 | 98.17 | 13.81 | 0.01* | 0.78 | 0.01* | 0.08 |
| 15 min | 88.80 | 10.26 | 92.23 | 10.22 | 96.60 | 14.58 | 0.04* | 0.50 | 0.03* | 0.33 |
| 16 min | 88.93 | 11.22 | 91.83 | 10.06 | 95.83 | 14.57 | 0.09 | 0.62 | 0.07 | 0.41 |
| 17 min | 88.73 | 10.86 | 91.97 | 9.38 | 94.17 | 14.68 | 0.20 | 0.54 | 0.18 | 0.75 |
| 18 min | 88.80 | 10.84 | 91.80 | 8.85 | 93.43 | 14.16 | 0.29 | 0.57 | 0.26 | 0.84 |
| 19 min | 89.30 | 11.82 | 91.33 | 8.92 | 93.93 | 14.21 | 0.32 | 0.78 | 0.28 | 0.67 |
| 20 min | 89.37 | 13.22 | 90.77 | 9.48 | 93.30 | 13.98 | 0.46 | 0.90 | 0.43 | 0.70 |
1ANOVA test, 2Post-hoc tests, *Significant; HR: Heart rate
[Table/Fig-7] shows the comparison of SpO2 among the groups across the time periods. The analysis of variance revealed that SpO2 was similar at all the time points in all the groups.
Comparison of SpO2 among the groups across the time periods.
| Time periods | Group A (n=30) | Group B (n=30) | Group C (n=30) | p-value1 | p-value2 |
|---|
| Mean | SD | Mean | SD | Mean | SD | A vs B | A vs C | B vs C |
|---|
| T0 | 100 | 0 | 100 | 0 | 100 | 0 | - | - | - | - |
| TN5 | 100 | 0 | 100 | 0 | 100 | 0 | - | - | - | - |
| TN10 | 100 | 0 | 100 | 0 | 100 | 0 | - | - | - | - |
| TN15 | 100 | 0 | 99.97 | 0.18 | 100 | 0 | - | - | - | - |
| TpreI | 100 | 0 | 100 | 0 | 100 | 0 | - | - | - | - |
| TpostI | 100 | 0 | 100 | 0 | 99.97 | 0.18 | - | - | - | - |
| 1 min | 99.97 | 0.18 | 99.97 | 0.18 | 100 | 0 | - | - | - | - |
| 2 min | 99.97 | 0.18 | 99.97 | 0.18 | 100 | 0 | - | - | - | - |
| 3 min | 100 | 0 | 99.93 | 0.25 | 99.97 | 0.18 | - | - | - | - |
| 4 min | 100 | 0 | 99.93 | 0.25 | 99.97 | 0.18 | - | - | - | - |
| 5 min | 100 | 0 | 99.93 | 0.25 | 99.97 | 0.18 | - | - | - | - |
| 6 min | 100 | 0 | 99.87 | 0.35 | 100 | 0 | - | - | - | - |
| 7 min | 100 | 0 | 99.93 | 0.25 | 100 | 0 | - | - | - | - |
| 8 min | 100 | 0 | 99.93 | 0.25 | 100 | 0 | - | - | - | - |
| 9 min | 100 | 0 | 99.97 | 0.18 | 100 | 0 | - | - | - | - |
| 10 min | 99.97 | 0.18 | 99.97 | 0.18 | 100 | 0 | - | - | - | - |
| 11 min | 99.97 | 0.18 | 99.97 | 0.18 | 99.97 | 0.18 | - | - | - | - |
| 12 min | 99.97 | 0.18 | 99.97 | 0.18 | 99.97 | 0.18 | - | - | - | - |
| 13 min | 99.97 | 0.18 | 99.97 | 0.18 | 99.97 | 0.18 | - | - | - | - |
| 14 min | 100 | 0 | 99.97 | 0.18 | 100 | 0 | - | - | - | - |
| 15 min | 100 | 0 | 99.97 | 0.18 | 100 | 0 | - | - | - | - |
| 16 min | 100 | 0 | 99.97 | 0.18 | 100 | 0 | - | - | - | - |
| 17 min | 100 | 0 | 100 | 0 | 100 | 0 | - | - | - | - |
| 18 min | 100 | 0 | 99.93 | 0.25 | 100 | 0 | - | - | - | - |
| 19 min | 100 | 0 | 99.97 | 0.18 | 100 | 0 | - | - | - | - |
| 20 min | 100 | 0 | 100 | 0 | 100 | 0 | - | - | - | - |
1ANOVA test, 2Post-hoc tests, SpO2 was similar at all the time point in all the groups
[Table/Fig-8] shows the comparison of EtCO2 among the groups across the time periods. The analysis of variance revealed that there was no significant (p>0.05) difference in EtCO2 at all the time points among the groups.
Comparison of EtCO2 among the groups across the time periods.
| Time periods | Group A (n=30) | Group B (n=30) | Group C (n=30) | p-value1 | p-value2 |
|---|
| Mean | SD | Mean | SD | Mean | SD | A vs B | A vs C | B vs C |
|---|
| T0 | 24.57 | 2.25 | 25.40 | 2.69 | 24.90 | 2.41 | 0.42 | 0.39 | 0.85 | 0.71 |
| TN5 | 24.77 | 2.37 | 27.27 | 9.96 | 25.07 | 2.20 | 0.22 | 0.28 | 0.98 | 0.34 |
| TN10 | 24.60 | 2.50 | 25.40 | 2.09 | 24.60 | 2.27 | 0.30 | 0.37 | 1.00 | 0.37 |
| TN15 | 24.37 | 2.66 | 25.63 | 2.53 | 25.10 | 2.23 | 0.14 | 0.12 | 0.12 | 0.68 |
| TpreI | 25.40 | 3.96 | 26.00 | 3.30 | 25.67 | 3.04 | 0.79 | 0.78 | 0.95 | 0.92 |
| TpostI | 31.73 | 2.95 | 31.00 | 1.86 | 31.23 | 3.30 | 0.57 | 0.56 | 0.76 | 0.94 |
| 1 min | 31.97 | 2.48 | 31.50 | 1.55 | 31.23 | 3.08 | 0.50 | 0.74 | 0.48 | 0.90 |
| 2 min | 31.87 | 2.27 | 31.50 | 1.48 | 31.43 | 1.89 | 0.64 | 0.73 | 0.65 | 0.99 |
| 3 min | 31.87 | 1.83 | 31.63 | 1.25 | 31.50 | 1.68 | 0.67 | 0.84 | 0.65 | 0.94 |
| 4 min | 31.73 | 2.12 | 31.83 | 1.23 | 31.47 | 2.00 | 0.72 | 0.97 | 0.83 | 0.71 |
| 5 min | 31.80 | 2.17 | 31.90 | 1.03 | 31.93 | 1.08 | 0.94 | 0.96 | 0.93 | 0.99 |
| 6 min | 31.83 | 1.72 | 31.73 | 0.87 | 32.10 | 0.89 | 0.49 | 0.94 | 0.67 | 0.48 |
| 7 min | 31.87 | 1.43 | 32.17 | 1.21 | 31.93 | 1.14 | 0.63 | 0.63 | 0.97 | 0.75 |
| 8 min | 31.77 | 1.85 | 32.20 | 1.50 | 32.23 | 1.01 | 0.40 | 0.50 | 0.44 | 0.99 |
| 9 min | 31.97 | 1.45 | 32.27 | 1.36 | 32.27 | 1.02 | 0.58 | 0.64 | 0.64 | 1.00 |
| 10 min | 32.07 | 1.29 | 31.73 | 0.91 | 32.10 | 0.96 | 0.34 | 0.44 | 0.99 | 0.38 |
| 11 min | 31.93 | 1.34 | 32.00 | 0.83 | 32.03 | 0.93 | 0.93 | 0.96 | 0.92 | 0.99 |
| 12 min | 31.93 | 2.02 | 31.90 | 0.80 | 31.93 | 0.79 | 0.99 | 0.99 | 1.00 | 0.99 |
| 13 min | 32.03 | 1.45 | 31.63 | 0.93 | 31.93 | 0.79 | 0.34 | 0.33 | 0.93 | 0.53 |
| 14 min | 32.13 | 1.46 | 31.77 | 1.10 | 32.10 | 1.06 | 0.44 | 0.47 | 0.99 | 0.54 |
| 15 min | 32.07 | 2.12 | 31.87 | 0.94 | 32.10 | 1.09 | 0.80 | 0.86 | 0.99 | 0.81 |
| 16 min | 32.20 | 1.63 | 31.83 | 0.87 | 32.03 | 0.81 | 0.47 | 0.44 | 0.88 | 0.78 |
| 17 min | 31.90 | 1.61 | 31.97 | 0.77 | 31.97 | 0.93 | 0.96 | 0.97 | 0.97 | 1.00 |
| 18 min | 32.03 | 1.45 | 32.00 | 0.91 | 32.13 | 0.90 | 0.89 | 0.99 | 0.93 | 0.88 |
| 19 min | 32.13 | 1.25 | 31.93 | 0.69 | 32.03 | 0.96 | 0.74 | 0.71 | 0.92 | 0.92 |
| 20 min | 32.10 | 1.32 | 31.87 | 0.82 | 32.13 | 0.94 | 0.56 | 0.66 | 0.99 | 0.58 |
1ANOVA test; 2Post-hoc tests
Discussion
Aim of this study was to compare the efficacy of nebulised lignocaine and intravenous lignocaine and the haemodynamic response to laryngoscopy and tracheal Intubation. It was found that intravenous lignocaine effectively controls haemodynamic response however; blood pressure changes seem to be controlled better than HR changes. Nebulised lignocaine was not effective in controlling the haemodynamic changes though there was marginal increase in pressure responses.
Miller CD and Warren SJ, studied the effect of intravenous lignocaine on the cardiovascular responses to laryngoscopy and tracheal intubation [11]. A total of 45 patients were divided into four groups. Group I- Received normal saline 4 mL iv over 30 seconds, 3 minutes before laryngoscopy and intubation and served as control Group II- Received 1.5 mg/kg of lignocaine iv 3 min before laryngoscopy and intubation. Group III- Received 1.5 mg/kg of lignocaine iv 2 minutes before laryngoscopy and intubation. Group IV- Received 1.5 mg/kg of lignocaine iv 1 min before laryngoscopy and intubation and found statistically significant increase in HR, systolic and DBP in control group, Group III and Group IV, and concluded that lignocaine 1.5 mg/kg given intravenously within 3 minutes of laryngoscopy and intubation failed to attenuate cardiovascular responses.
Sarvanan S et al., conducted a study to compare the effect of lignocaine nebulisation with intravenous lignocaine on stress response to laryngoscopy and tracheal Intubation [12]. Ninety patients scheduled for elective surgeries under general anaesthesia were allocated into three groups, Group C, Group I, Group N with the sample size of 30 in each. Group I received 2% lignocaine 2 mg/kg intravenous 90 seconds and Group N received nebulisation with 2% lignocaine 2 mg/kg 10 minute before induction.
Miller CD and Warren SJ, noticed rise in SBP to be 33 mmHg, DBP to be 37 mmHg [11]. Sarvanan S et al., noticed that increase in SBP, DBP and MAP in Group I, one minute following laryngoscopy and intubation, was 17.54 mmHg, 13.84 mmHg and 16.1 mmHg, that is maximum above the baseline value, then started settling down towards the baseline value by 10 to 15 minutes [12].
In the present study, in group B, i.e., in nebulisaed lignocaine, the maximal increase in the SBP, DBP and MAP was found to be 15.1 mmHg, 13.44 mmHg and 13.43 mmHg, respectively.
Sarvanan S et al., noticed that increase in SBP, DBP and MAP in nebulised group, one minute following laryngoscopy and intubation, was 32.26 mmHg, 24.83 mmHg and 27.3 mmHg, that is maximum above the base line value and started settling down towards the baseline value by 10 to 15 minutes [12]. As compared to the study by Sarvanan S et al., changes in SBP, DBP, and MAP in nebulised group was much less in this study, which may be due to higher concentration and dose of lignocaine being used. In the present study, the pressor response was highly significant in the intravenous group than the control which concurs well with Sarvanan S et al., [12].
In the control group the baseline HR was 89.20 bpm. Post-intubation the maximal rise of HR was by an average of 14 bpm. It was seen that the elevated HR started settling down towards the baseline value by 9 to11 minutes, but it was still above the baseline even at 8 minutes. Miller CD and Warren SJ, noticed an increase in HR in control group to be around 27bpm [11]. Sarvanan S et al., noticed an increase in HR in control group, one minute following laryngoscopy and intubation, to be 23.4 bpm that is maximum, above the baseline value [12]. It was seen that the elevated HR started settling down towards the base line value by 7 to11 minutes. In present study, increase in the HR in control group following laryngoscopy and intubation, concurs with the observations made by Miller CD et al., and Sarvanan S et al., [11,12].
In group B, the base line HR was 90 bpm, post-intubation, a rise of 6.87 bpm. Subsequently, the elevated HR started settling down by 10 minutes as at 1, 5 and 10 minutes it was 96.70, 90.83 and 90.33 bpm, respectively. Sarvanan S et al., noticed the maximum increase in HR by 24.86 bpm in nebulised lignocaine group (group N), one minute following laryngoscopy and intubation, and elevated HR started settling down towards the baseline value by 7 minutes [12].
In group C (intravenous lignocaine) the base line value HR was 88.23 bpm. Post-intubation, there was a rise of 14.14 bpm. Subsequently, the elevated HR started settling down by 10 minutes. By 1, 5 and 10 min it was 101.67, 98.83 and 98.67 bpm, respectively. Sarvanan S et al., noticed maximum rise in HR to be 18 bpm in iv lignocaine group, one minute following laryngoscopy and intubation, and the elevated HR started to settle down towards the baseline value by 7 minutes [12]. In the present study, better HR control was observed in nebulised lignocaine group as compared to intravenous lignocaine group which does not concur with the observation made by Sarvanan S et al., [12]. The mean rise in HR after intubation in control group was 14 bpm compared to 6.87 bpm and 14.14 bpm in nebulised and intravenous lignocaine group respectively. The maximum rise in the HR was comparatively lesser in the nebulised group but not statistically significant when compared to the group C and group A. There were no clinical or statistical significant difference between group A and Group B.
There were no clinical or statistical changes that were seen with oxygen saturation in any of the groups. Majority of the patients who were nebulised with lignocaine complained of bitter taste postadministration of the drug which was considered as a minor side-effect but was not of much concern as it was for shorter period.
Limitation(s)
The droplet size, drug output from the nebuliser and respiratory rate of patient could not be standardised. There was loss of a significant amount of lignocaine during nebulisation in the form of aerosol and residual volume. It was not possible to measure plasma lignocaine concentrations, effect of lignocaine on other organ systems such as suppression airway reactivity and reduction of intracranial hypertension.
Conclusion(s)
Marked rise in the SBP, DBP, MAP and HR occur following laryngoscopy and intubation when lignocaine was not given by either of the route. Intravenous lignocaine effectively controls the haemodynamic response to laryngoscopy and endotracheal intubation however; blood pressure changes seem to be controlled better than HR changes. Nebulised lignocaine was not effective in controlling the haemodynamic changes, though there was marginal increase in pressure responses. In this study, though nebulisation was not that much effective as compared to intravenous lignocaine in attenuating the cardiovascular responses to laryngoscopy and intubation, it is still a safe and a simple technique to be used. According to the authors, a longer latent period of time could be beneficial for complete establishment of the effects of nebulisation on the airway.
N=30 in each group
1ANOVA test, 2Post-hoc tests, *Significant; SBP: Systolic blood presure
1ANOVA test, 2Post-hoc tests, *Significant; DBP: Diastolic blood pressure
1ANOVA test, 2Post-hoc tests, *Significant; MAP: Mean arterial pressure
1ANOVA test, 2Post-hoc tests, *Significant; HR: Heart rate
1ANOVA test, 2Post-hoc tests, SpO2 was similar at all the time point in all the groups
1ANOVA test; 2Post-hoc tests