On March 11, 2020, World Health Organisation (WHO) declared that COVID-19 was a pandemic disease. According to the Diagnosis and Treatment Scheme (6th edition) released by the National Health Commission, the diagnostic criteria for COVID-19 should include epidemiology, clinical manifestations, CT findings, and a COVID-19 nucleic acid test [1].
Because the disease manifests as a chest infection, radiological imaging also has an essential role in the diagnosis, management, and follow-up [2]. Chest High Resolution CT (HRCT) is one method of choice for the diagnosis of COVID-19, even in the early stages. The most common CT findings are multifocal GGO that may or may not be associated with consolidation areas [2]. These lesions are mainly peripheral and show greater involvement in the lower lung zones. A crazy-paving pattern is also seen in some cases [2]. Less common CT findings include the reversed-halo sign (a focal area of GGO with a peripheral ring of consolidation), cavitation, calcifications, lymphadenopathies, and pleural effusion [2].
Chest X-Rays (CXR) have a low sensitivity in identifying COVID-19, especially in the initial stages when CXR can be completely negative. In the advanced stages of infection, CXR shows bilateral multifocal alveolar opacities, which tend to become confluent and involve the whole lung [2].
CT may be considered the primary imaging modality for the diagnosis of COVID-19 pneumonia. However, in the United States (US) and Europe, CT has been used somewhat infrequently and is typically only used to follow-up on the disease progression and complications. In fact, some US guidelines have recommended against using CT as a screening method [3,4]. The current literature indicates some variation in CT sensitivity for the detection and diagnosis of COVID-19, and many reasons can explain these variations (88%-98%) [4,5].
Aim of the present study was to summarise the most common CT features of COVID-19 and to review the sensitivity of CT revealed by different studies and to highlight the reasons for the variations found when reporting CT results for the diagnosis of COVID-19 pneumonia.
Materials and Methods
This meta-analysis included a total of 31 research articles collected from Medline via the Europe BMC, PubMed, Science Direct, and Scopus databases (conducted from January to June 2020) dealing with CT finding and sensitivity in diagnosis of COVID-19 pneumonia. A total of 200 articles were previewed and then 31 studies meeting the inclusion criteria were finally used for the meta-analysis [Table/Fig-1].
PRISMA diagram for selection of meta-analysis of the study.
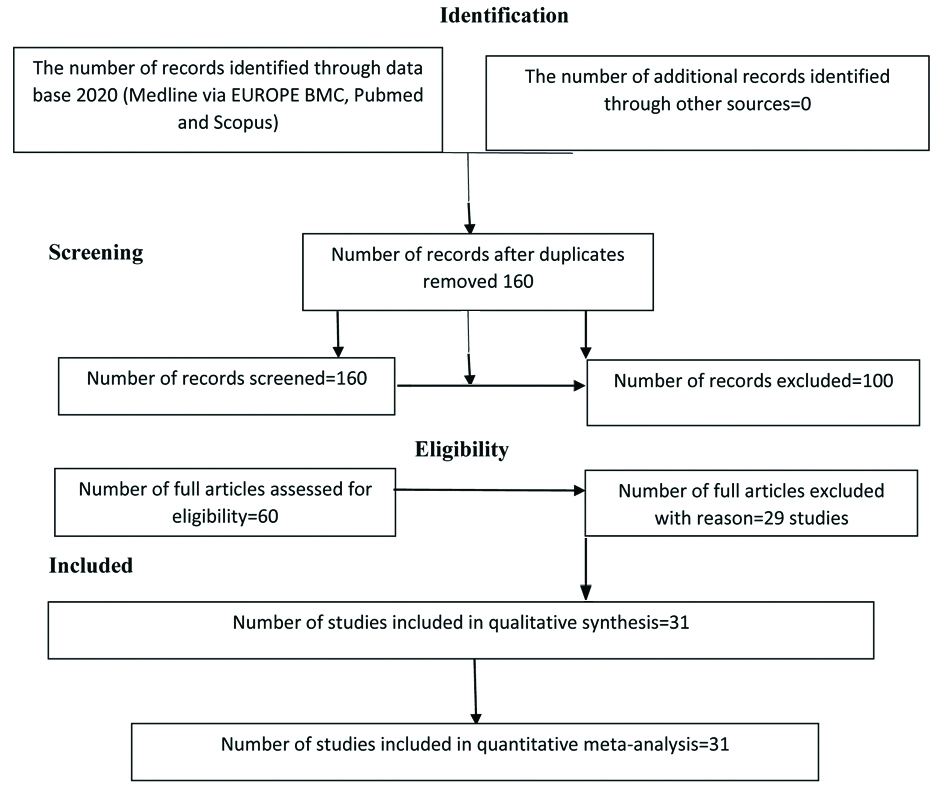
The keywords were “COVID-19” or “SARS-CoV-2” or “CT sensitivity” or “RT-PCR.” Reference lists were checked for all key articles and any additional eligible articles. At last, a total of 200 articles were previewed and then 31 studies meeting the inclusion criteria were finally used for the meta-analysis.
Inclusion criteria: Reported the performance of CT chest in diagnosing COVID-19, patients diagnosed as COVID-19 based on the results of RT-PCR, studies which provided enough information to extract data of diagnostic test of CT chest for COVID-19, and study sample size that was larger than 30.
Exclusion criteria: Meta-analyses, literature reviews, duplicate articles, case reports, articles without open access and those dealing with CT imaging features without true positive cases.
Statistical Analysis
The total number of cases were calculated, and the categorical data, such as gender, were analysed with Microsoft Excel for Windows 10. A meta-analysis was then performed to assess the pooled sensitivity of CT in the diagnosis of COVID-19 pneumonia.
The meta-analysis was conducted using OpenMeta (Analyst) software (cebm.brown.edu/openmeta/) to verify the pooled sensitivity of CT in the detection and diagnosis of COVID-19 pneumonia. The meta-analyses included the use of forest plots, ROC curves, cumulative meta-analyses forest plots, and leave-one-out forest plots. Firstly, the effect sizes were pooled using random-effects maximum likelihood model, 95% confidence interval of differences was considered in calculating the pooled sensitivity. The heterogeneity assesses by Cochran Q Chi-square test a statistically significant test (p-value <0.01) indicated heterogeneity among the included articles, I2 indicate inconsistency in the pooled measured, then cumulative forest plot and one leave forest plot is obtained to pooled sensitivity of CT for diagnosis of COVID-19.
Results
The total number of cases in the included 31 studies was 4472 patients [1,4-33]. Of those, 4274 patients had COVID-19 confirmed by either CT or RT-PCR or both. The mean age mentioned in 15 studies ranged between 41.6±14.5 to 60±17 years [4,6,8,9,11-13,17,20,24,27-29,31,32]. The median age in 16 studies ranged between 36-57 years [1,5,7,8,10,14-16,18,21-23,25,26,30,33]. The number of patients with high-resolution chest CT was 4145 from 4274 diagnosed with COVID-19 (97.6%) [Table/Fig-2].
Frequency of abnormal CT findings in previous studies in relation to age and gender [1,4-33].
| No. | Author (Reference) | Number | Male | Female | Mean±SD, Median age\years | Abnormal CT |
|---|
| 1 | Luo N et al., [1] | 78* | NA | NA | 49+ | 70 |
| 2 | Fang Y et al., [5] | 51 | 29 | 22 | 45+ | 50 |
| 3 | Ai T et al., [4] | 1014 | 467 | 547 | 51±15 | 888 |
| 4 | Long C, et al., [6] | 36* | 20 | 16 | 44.8±18.2 | 35 |
| 5 | Guan WJ et al., [7] | 1099 | 640 | 459 | 47+ | 840975\ >> |
| 6 | Liu K et al., [8] | 137 | 61 | 76 | 57+55±16 | 116 |
| 7 | Wu J et al., [9] | 80 | 39 | 41 | 46.1±15.42 | 55 |
| 8 | Zhang J et al., [10] | 14 | 7 | 7 | 41+ | 13 |
| 9 | Caruso D et al., [11] | 158 | 83 | 75 | 57±17 | 114 |
| 10 | Li Y and Xia L [12] | 51* | 28 | 23 | 58±17 | 49 |
| 11 | Li X et al., [13] | 131 | 63 | 68 | 47±15 | 125 |
| 12 | Wang D et al., [14] | 138 | 75 | 61 | 56+ | 138 |
| 13 | Zhu W [15] | 32* | 15 | 17 | 46+ | 30 |
| 14 | Xu X et al., [16] | 90 | 39 | 51 | 50+ | 69 |
| 15 | Inui S et al., [17] | 104 | 54 | 50 | 60±17 | 63 |
| 16 | He JL et al., [18] | 34* | 17 | 17 | 52+ | 26 |
| 17 | Xie X et al., [19] | 167 | NA | NA | NA | 160 |
| 18 | Chung M et al., [20] | 21 | 13 | 8 | 51±14 | 18 |
| 19 | Wang K et al., [21] | 114 | 58 | 56 | 53+ | 110 |
| 20 | Huang CL et al., [22] | 41 | 30 | 11 | 49+ | 41 |
| 21 | Xu XW et al., [23] | 62 | 35 | 27 | 41+ | 61 |
| 22 | Liu KC et al., [24] | 73 | 41 | 32 | 41.6±14.5 | 70 |
| 23 | Ng MY et al., [25] | 21 | 13 | 8 | 56+ | 19 |
| 24 | Zhang MQ et al., [26] | 9 | 5 | 4 | 36+ | 7 |
| 25 | Wu J et al., [27] | 80 | 42 | 38 | 44±11 | 76 |
| 26 | Song F et al. [28] | 51 | 25 | 26 | 49±16 | 51 |
| 27 | Pan Y et al., [29] | 63 | 33 | 30 | 44.9±15.2 | 63 |
| 28 | Wang J et al., [30] | 52 | 29 | 23 | 44+ | 50 |
| 29 | Xu YH et al., [31] | 50 | 29 | 21 | 43.9±16.8 | 41 |
| 30 | Li K et al., [32] | 83 | 44 | 39 | 45.5±12.3 | 81 |
| 31 | Zhang JJ et al., [33] | 140 | 71 | 69 | 57+ | 134\135>> |
| Total | | 4145 | 2015 | 1924 | | 3663 |
*Number of patients with COVID-19 cases from total
>>number of patients with abnormal CT from whom performed CT
+median age
Most of the articles reviewed were studies conducted in China in 2020 (January to June). COVID-19 was found to occur more frequently in males (2105; 51%) than in females (1924; 49%), the ratio of male: female was 1.04:1. Two studies (245 patients) did not mention the gender of the COVID-19 patients [1,19].
The most common findings were bilateral involvement, GGO, and consolidation, and the crazy-paving pattern. A study reported that some specific features for COVID-19 patients included a batwing sign, a white lung sign, a Rosa roxburghii sign, and a gypsum sign [21].
Among all patients with chest CT images (4145 patients), 3663 patients had abnormal chest CT images (3663/4145, 88.4%), while 482 patients (diagnosed based on RT-PCR) had normal chest CT images [Table/Fig-2]. Summarisation of CT features of COVID-19 pneumonia and severity of the illness and symptoms is demonstrated in [Table/Fig-3].
Summary of CT findings in reviewed studies according to patients classifications.
| Patient’s classification | CT chest features |
|---|
| According to symptom | Asymptomatic | GGO was more frequent than consolidation [17] |
| Symptomatic | Lung opacities and abnormalities of the airways on CT were more frequent, consolidation was more [17] |
| According to clinical status | ICU | Multiple bilateral lobular and sub-segmental regions of consolidation [22] |
| Non-ICU | Bilateral (GGO) and sub-segmental regions of consolidation [22] |
| According to disease progression | <4 days | More GGOs including pure GGO and GGO with reticular and/or interlobular septal thickening [28] |
| ≥4 days | More consolidation and few GGO (GGO with consolation or just consolidation) [28] |
| According to disease severity | Mild | No significant abnormalities [24,31], or mild changes such as enlarged lung hila, with thickening of lung texture [24] |
| Common | Multiple GGO peripherally located in lung with or without interlobar thickening [24,31] |
| Severe and critical | Extensive GGO and consolidation, crazy paving pattern with bronchial wall thickening, “white lung” formation, atelectasis, enlargement of lymph nodes, pericardial effusion, and pleural effusion [24,32] |
| According to age of patients | More presence of consolidations, more area of involvement with a few GGO is seen in older than in younger patients [28] |
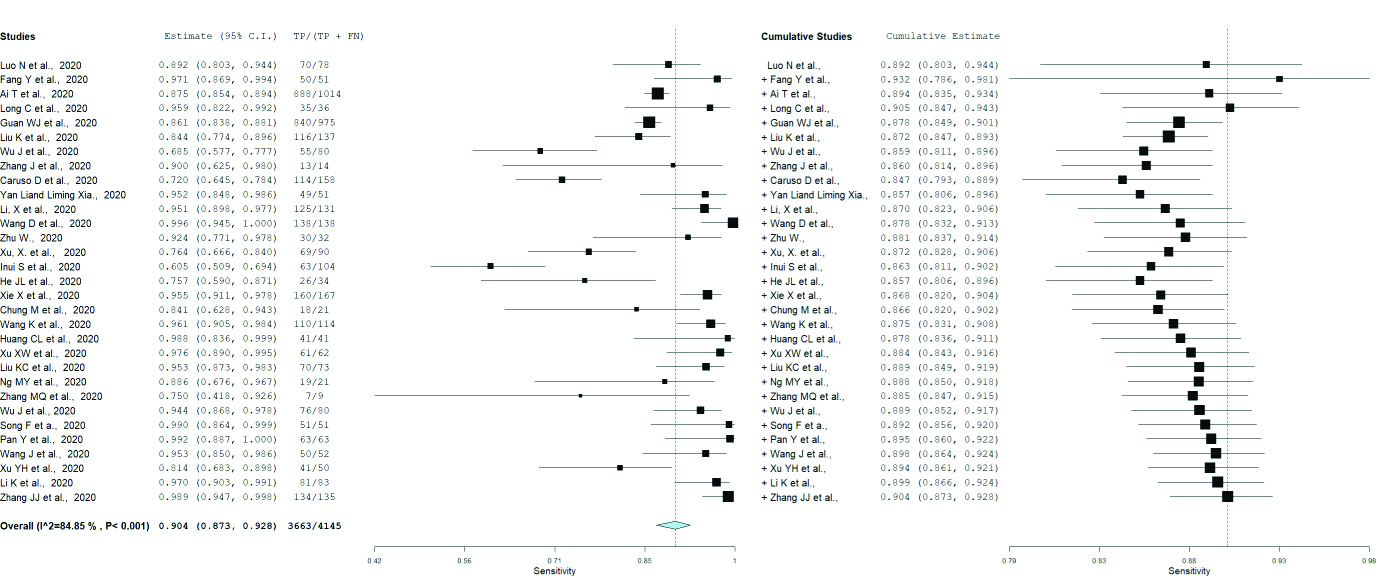
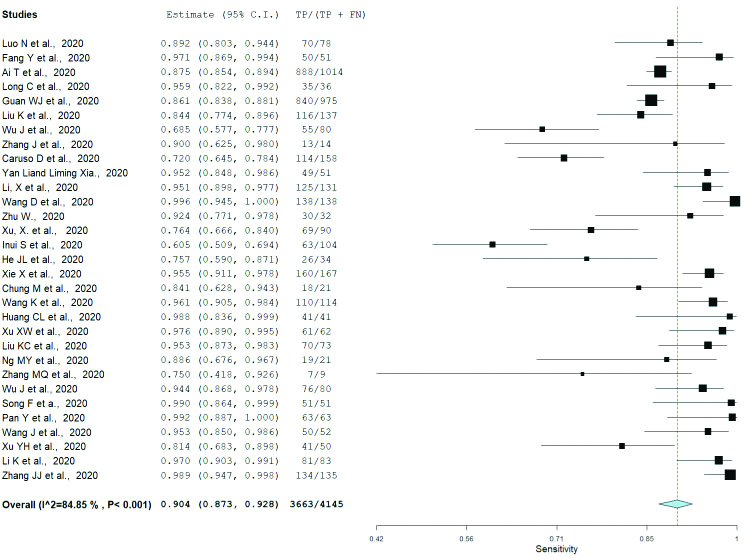
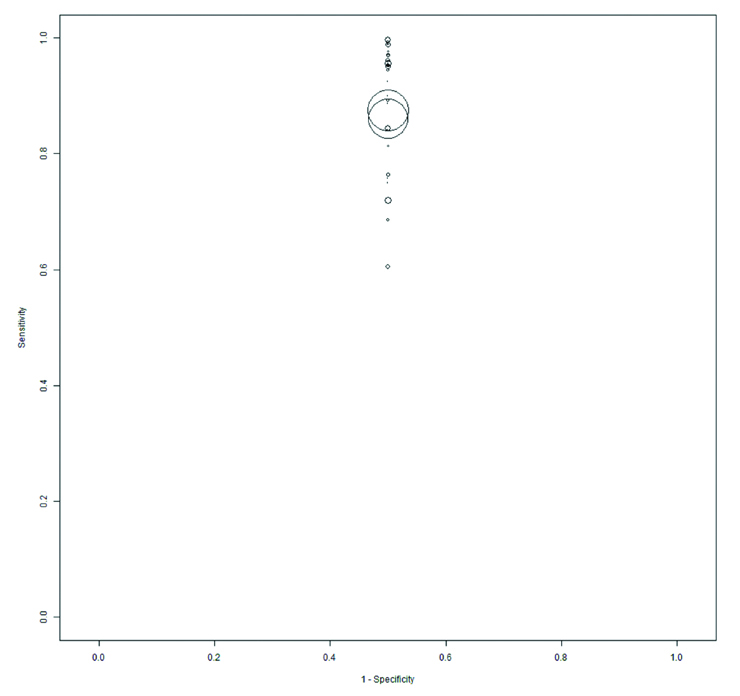
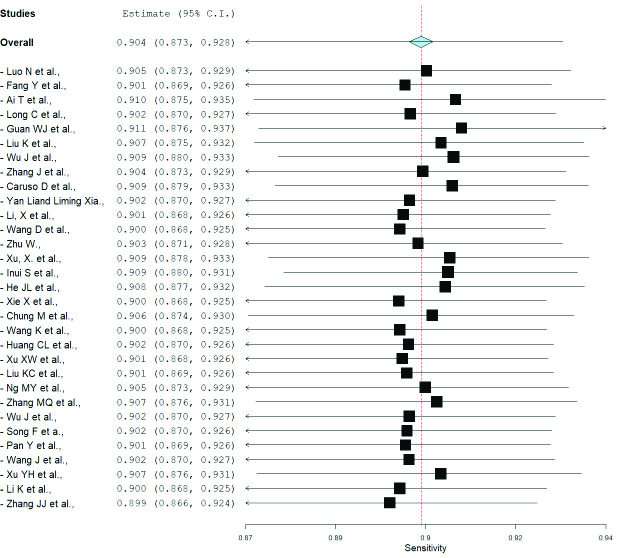
The pooled sensitivity of CT in detection of COVID-19 pneumonia was 90%, ranged from 60–100% (95% CI: 87-93%) and the Cochran Q Chi-square test indicated that there is heterogeneity among the studies included (I2=84.85% with p-value <0.01) [Table/Fig-4]. The cumulative forest plot also showed the pooled sensitivity of CT in detection and diagnosis of COVID-19 pneumonia [Table/Fig-5]. ROC curve for pooled sensitivity is shown in [Table/Fig-6]. Minimal fluctuation in the pooled sensitivity estimate with all studies included for sensitivity of CT scan is demonstrated in one leave meta-analysis graph [Table/Fig-7].
Forest Plot for sensitivity of CT for diagnosis of COVID-19 in the current year 2020. The heterogeneity among the studies (p<0.01, I2=84.85%).
Cumulative Forest Plot Sensitivity of CT for diagnosis of COVID -19 for the current year 2020.
ROC curves for the sensitivity and specificity of CT in diagnosis of COVID-19.
Leave-one forest plot shows exceptionally minimal variation in the pooled estimate with all studies included for sensitivity of CT scan.
Discussion
This literature review assessed the analysis of CT sensitivity for evaluation of COVID-19 pneumonia. It was found that the mean and median age of patients with COVID-19 pneumonia ranged between 36 and 57 years, the frequency of COVID-19 was slightly more in males than in females. The meta-analysis of the data showed a high pooled sensitivity (90%) of chest CT for the diagnosis of SARS-CoV-2 infection, with a 95% confidence interval ranging from 60-100%.
The analysis of chest CT findings was classified according to the findings already described for the interpretation of previous studies in patients with suspected COVID-19. The most common CT finding is bilateral involvement [5-11]. The presence of GGO, consolidation, and peripheral distribution of abnormalities were reported to be common [4,16,20,24,33]. Other few studies reported features of spider web and crazy-paving patterns [13,15,16,24,27].
A study conducted by Li X et al., demonstrated that 95.4% of the patients had abnormal CT, and 81% had patchy GGO [13]. Wang D et al., found bilateral lung involvement (patchy shadows) in 100% of their cases [14]. Zhu W et al., found abnormal chest CT in 94% of their cases, with bilateral involvement and GGO in 91% of the patients with suspected disease upon admission [15].
Xu X et al., reported 90 cases of COVID-19 chest CT. They found no abnormalities in 23% and abnormality in 77%; in 59% of the cases, the involvement was found in more than two lobes. More than half of the patients had bilateral, multifocal, and peripherally located lung lesions evenly distributed in the lower lobes [16].
Some specific features for COVID-19 patients included: (1) a batwing sign, defined as a large shadow surrounding the lung hila that mimics bat or butterfly wings; (2) a white lung sign, recognised as blizzard lung; this appears as nodular and flaky high-density shadows that are distributed in both lungs and partially merged and consolidated; (3) a Rosa roxburghii sign, which consists of semi-round GGO distributed in the peripheral zone of the lung lobes and has the appearance of a rose; (4) a gypsum sign, which is defined as patchy consolidated lung lobes with different densities [21].
The sensitivity of CT for the diagnosis of COVID-19 differs among different studies. These variations in CT sensitivity for the demonstration of COVID-19 pneumonia can have several different causes, such as the clinical condition of the patients. In general, combination of laboratory test results and CT findings with clinical manifestation are necessary to complete the diagnosis of COVID-19 pneumonia.
Some authors classified the patients according to their clinical conditions as symptomatic or asymptomatic symptomatic [17], while others classified the patients according to the severity of the disease, as to mild, common, severe, and critical cases [7,10,11,24]. Other studies classified the patients according to the RT-PCR test results as positive and negative [4,5], and according to the time between onset of symptom and conduction of CT investigation [28].
The studies that classified the patients according to symptoms revealed that abnormalities in CT were more prevalent in symptomatic than in asymptomatic patients [17]. Lung opacities and abnormalities of the airways were more frequent on CT in symptomatic patients, whereas GGO was more frequent in asymptomatic ones. Consolidation was more prevalent in symptomatic patients [17].
The studies that considered the results of RT-PCR assays tended to view chest CT as primary imaging tool for assessing the COVID-19. Ai T et al., assessed the diagnostic value of chest CT versus an RT-PCR assay of throat swabs sampled in 1,014 patients with COVID-19 [4]. They found that 59% of the cases had positive RT-PCR results and 88% had positive chest CT exams. Based on positive RT-PCR, the sensitivity of chest CT was 97%, while in the patients with negative RT-PCR results, 75% had positive chest CT findings. Fang Y et al., found a significant difference in the sensitivity of CT thorax (98%) versus the RT-PCR results (71%) [5]. Long C et al., also found that CT was more sensitive than RT-PCR, at 97.2% versus 83.3%, respectively, at presentation time and suggested isolating the patients or repeating the RT-PCR if a lung finding was apparent with CT [6]. Caruso D et al.,, [11] found an overall sensitivity of CT of 64.5% while that of RT-PCR was 39%, whereas in patients with a positive RT-PCR test, the sensitivity of CT for COVID-19 pneumonia was 97%, in patients with a negative RT-PCR test, the CT showed abnormalities in 44%, while in patients with a positive RT-PCR test, the bilateral GGO was 100%. The results of present study supported the use of the chest CT as an accurate and useful test for infected patients with epidemiologic and clinical features, specifically when the results of RT-PCR tests are negative. Li Y and Xia L found that a missed rate is only 3.9% of CT in diagnosis of COVID-19, which indicated that the CT chest could be an optimal tool for detection and management of the disease [12]. Wang K et al., found that the chest CT was abnormal in 110 (96.5%) of 114 confirmed cases of COVID-19 and concluded that CT is more sensitive than nucleic acid tests for the detection of COVID-19 pneumonia [21]. Conversely, He JL et al., reported a lower sensitivity and specificity for CT (77% and 96%, respectively) than for initial RT-PCR (79% and 100%, respectively), the difference was not statistically significant but combining the results of RT-PCR and chest CT gave a correct COVID-19 pneumonia diagnosis with 94% sensitivity and 100% specificity [18].
Some studies reported that a chest CT might be negative for COVID-19 infection at initial presentation even if the RT-PCR test is positive and that a chest CT may be positive even if the RT-PCR is negative [5,19]. Patients with a negative RT-PCR test may show abnormality on CT images. Xie X et al., mentioned that 3% of their cases with negative RT-PCR results had positive CT findings at initial presentation and that 4% with positive RT-PCR results had negative CT findings [19].
Huang CL et al., examined the chest CT findings in Intensive Care Unit (ICU) and non-ICU patients [22]. The ICU patients had multiple bilateral lobular and sub-segmental regions of consolidation, whereas the non-ICU patients showed bilateral GGO and sub-segmental regions of consolidation.
Another study done by Song F et al., indicated that the lung consolidation increased (GGO with consolidation or consolidation only) as the duration of the disease increased (four days or more from symptom onset to CT). More consolidation with a smaller number of GGO lesions was observed in the older patients than in younger ones (older than 50 years). Therefore, the finding of consolidation lesions could be considered an alert during treatment of COVID-19 pneumonia [28].
According to National Health Commission of the People’s Republic of China Diagnosis and treatment protocols of pneumonia caused by a novel coronavirus (trial version 5) [32,34], mild type patients had mild symptoms with no abnormality in imaging, common type patients (ordinary patients) had fever or symptoms with radiology manifestations of pneumonia. The severe/critical patients had respiratory rate of ≥30 breaths per minute, finger of oxygen saturation of ≤93% in a resting state, arterial oxygen tension inspiratory oxygen fraction of ≤300 mmHg) [32,34].
The studies which classify the patients according to disease severity found that the abnormalities in CT were more prominent in the severe and critical cases than in the mild and common cases [7,10,11]. Guan WJ et al., stated that chest CT abnormalities were more common in severe (94.6%) than in nonsevere (84.4%) cases; the severe patients were older and had more co-existing illness than the non-severe cases [7]. Similarly, one study of 14 cases confirmed by RT-PCR found abnormal CT results in 92.8% and reported that the abnormalities were more prominent in the severe than in the nonsevere cases of COVID-19 [10]. Other studies have found no statistically significant differences in CT features in severe cases versus those with mild infections. The insignificant difference may be due to the small number of mild cases [11].
Chung M et al., in study done in symptomatic patients found that the CT features included bilateral ground-glass and consolidation, sometimes with a rounded morphology, peripheral distribution and crazy- paving pattern [20].
Liu KC et al., found that the CT findings of COVID-19 pneumonia varied according to the disease severity [24]. In six patients with a mild form of pneumonia, they found three patients with no obvious abnormalities in either lung and three cases with lung involvement that included enlarged lung hila and thickening of the lung texture. The common type of disease was characterised by multiple GGO peripherally located in the lung, with or without interlobar thickening, while severe cases commonly showed extensive GGO and pulmonary consolidation. In critical type patients, confluent lesions were seen in multiple lobes, along with pulmonary fibrosis and “white lung” formation, while pleural effusion and atelectasis were noted in a few cases [24].
Xu YH et al., also classified patients with COVID-19 according to disease severity and determined that the mild cases typically have no obvious abnormality in chest HRCT, while critically and severely infected patients have positive chest imaging [31]. CT imaging at early stages shows bilaterally irregular scattered patches of GGO. Some lesions may have mixed patterns of consolidation in the center and GGO in the periphery, forming a “halo sign.” In critically or severely infected patients, multiple patches of GGO, consolidation, or a mixed consolidation and GGO can be found in both lungs. Thickened interlobular septa and consolidation are more frequently present in severe and critically infected patients than in patients with the common type of infection. These findings suggest changes with the development of the disease. The lesions are mostly located in the peripheral regions beneath the pleura but may extend to the lung center. Peripheral lesions with involvement of the lung center are mostly observed in severely and critically infected patients [31].
Li K et al., verified a significant statistical difference in clinical symptoms, laboratory examinations, and CT manifestations between the commonly infected patients and the critically or severely infected patients [32]. The severely/critically infected patients were older and had higher incidences of co-morbidities, expectoration, cough, dyspnea, and chest pain. The incidences of consolidation and the crazy-paving pattern with bronchial wall thickening were considerably greater in the severely/critically infected patients than in the commonly infected patients. In addition, the prevalence of enlargement of the lymph nodes, pericardial effusion, and pleural effusion was greater in the severely/critically infected cases than in the mild cases. Generally, the CT findings score was significantly higher in the severely/critically infected patients than in the commonly infected patients (p<0.001).
Another study on 135 infected patients that underwent chest CT exams on admission showed that the majority (99.3%) had abnormal findings that included multiple bilateral GGO or consolidation [33].
Zhang JJ et al., found that in all severe cases there is abnormalities on CT images (100%), while 98.7% of the nonsevere cases also revealed abnormalities on CT scans, with bilateral lung abnormalities in 89.6% of the severe cases and in 87.2% of the nonsevere cases [33].
Limitation(s)
Lack of homogeneity among the reviewed studies is really a challenge. Among the studies, there were variations in patients’ clinical condition such as presence of symptoms, diseases severity and duration of presence of illness which is responsible for the variation in the presence of imaging findings. Another limitation is that, the analysis of bias was not estimated as the statistical soft-ware program encountered some problems. These limitations may cause minimal effect in estimation of the CT sensitivity. Despite that the CT produced high sensitivity in detection and diagnosis of COVID-19 pneumonia.
Conclusion(s)
In conclusion, this systemic review and meta-analysis verified that the most common CT findings presented in previous studies were bilateral involvement, GGO, and consolidation, and the crazy-paving pattern. The peripheral distribution of abnormalities was more evident in severe and critical cases than in mild cases, and more common in symptomatic than in asymptomatic patients. Consolidation was more evident in symptomatic COVID-19 patients and was more prominent in older patients than in younger patients. The pooled sensitivity of CT in the diagnosis of COVID-19 was 90% and ranged from 60-100%. The CT sensitivity for the diagnosis of COVID-19 was higher in severe cases than in mild and moderate cases. The CT sensitivity was greater in symptomatic than in asymptomatic patients. Overall, the findings presented here emphasise the importance of having specialists consider a combination of clinical manifestations and epidemiological features, along with laboratory tests and chest CT scans, to confirm the diagnosis and to help in the management of COVID-19 pneumonia.
*Number of patients with COVID-19 cases from total
>>number of patients with abnormal CT from whom performed CT
+median age